Square
Following
Hot
News
Profile
Share your thoughts
placeholder
Article
Is that him? We used to be in the same group, 😂. Looks like he deleted me. I guess I’m not a good friend of his.
CRYPTO TODAY: BTC TRADES SIDEWAYS AROUND $83,000 AS FLOWS DIVERGE
The crypto market on October 21 is showing a notable divergence between Bitcoin and Ethereum.
BTC is fluctuating around $83,000, while ETH has seen a stronger rebound during the session. However, the price action still needs to be confirmed by actual buying pressure.
One notable point is the spot ETF flows in the U.S. during the October 19 session:
Bitcoin ETFs recorded net inflows of approximately $526.7 million.
Ethereum ETFs recorded net outflows of approximately $103.3 million.
This shows that institutional flows have recent
BTC+0.91%
ETH+1.75%
Trenches
Kimchi
K
bade
b
Kimchi
CSoc...pump
Market Cap
$.
Change
.
24h Vol
$.
Holders
.
Pokémon
P
bade
b
Pokémon
D42T...Xvb1
Market Cap
$.
Change
.
24h Vol
$.
Holders
.
AGT
A
bade
b
AGT
0x5d...e274
Market Cap
$.
Change
.
24h Vol
$.
Holders
.
Dacity
D
bade
b
Dacity
nxPq...pump
Market Cap
$.
Change
.
24h Vol
$.
Holders
.
STONK
S
bade
b
STONK
6GmA...UNgx
Market Cap
$
Change
.
24h Vol
$.
Holders
.
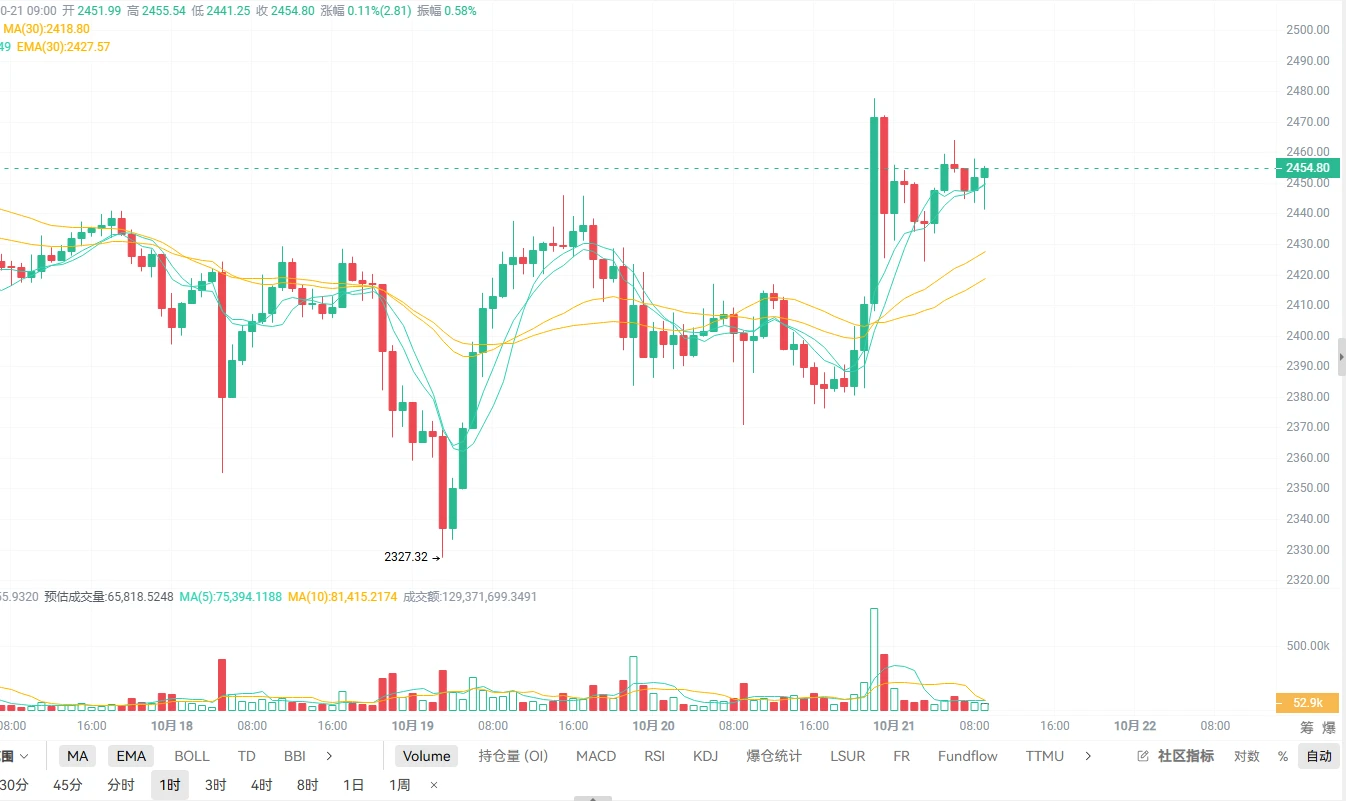
Yang Guang bit | October 21 $ETH —ETF daily net inflows of $526 million drive a rebound; trend turns bullish, buy the pullback
【Today's Strategy】
Entry timing: Place long orders on a pullback to the 2430–2440 range
Stop-loss: Set the long position stop below 2415
Take-profit targets:
First target: 2470–2480
Second target: 2500–2520
【Key Takeaway】
ETH followed BTC higher overnight, surging in a long bullish candle from around 2380 to 2477.70. It is currently near 2455, with price above all moving averages on both the 4-hour and 1-hour charts, signaling a short-term trend reversal from bearish t
post-image
ETH+2.31%
Bro, you know what’s the saddest part?
We can’t even see who we’re trading against,
yet we’re willingly giving them 15% of the profits.
post-image
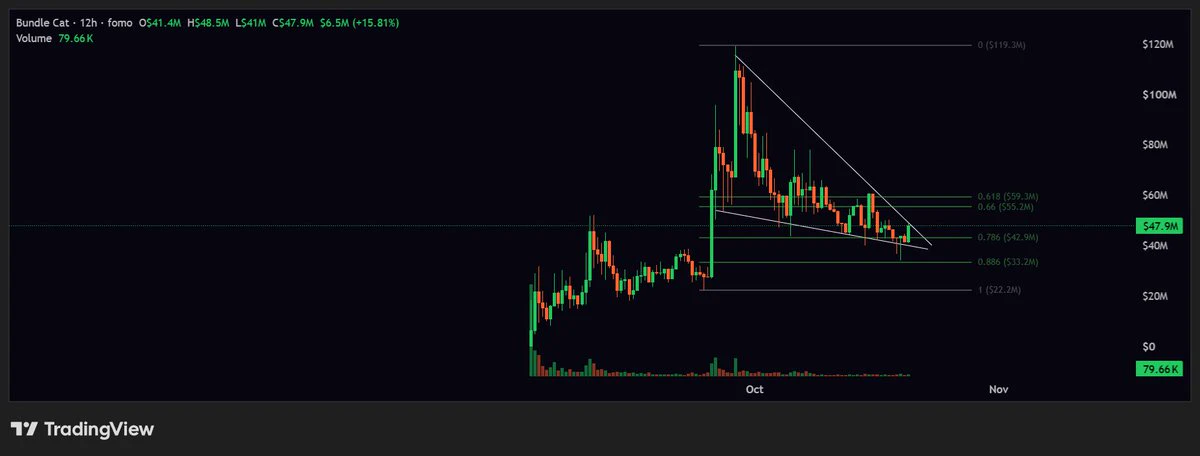
$BUN H12 rh eco picking up again
post-image
RH+5.03%
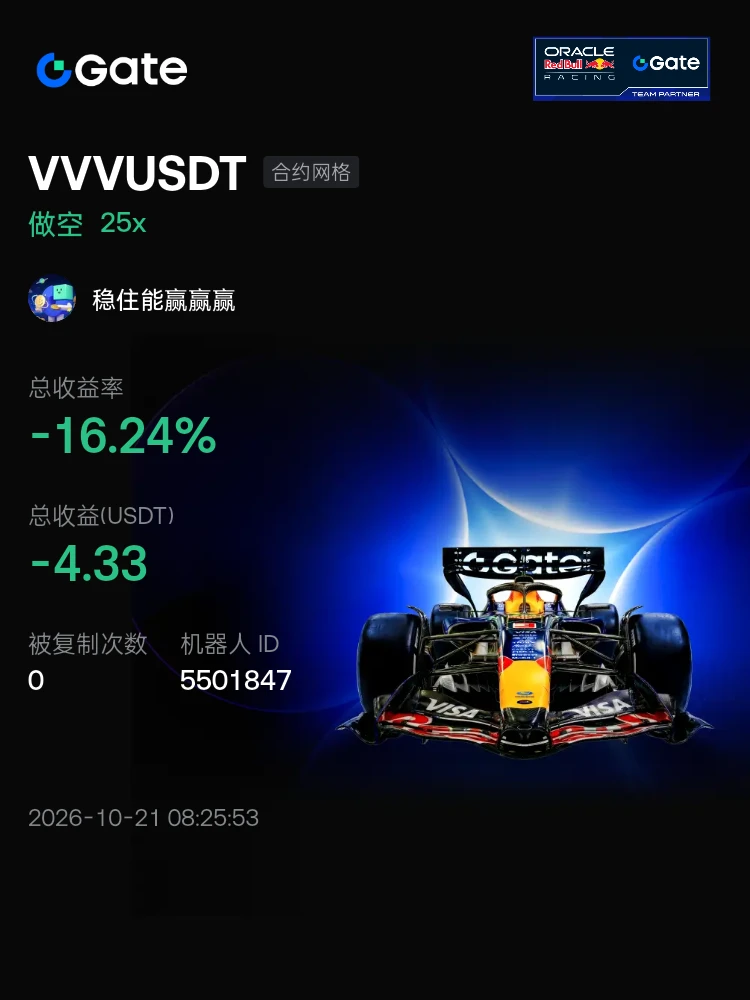
#交易机器人 I'm using the VVVUSDT futures grid bot on Gate—come copy trade with me
post-image
Former Google CEO bets on Anthropic! Holding about 1 of its shares, how many super-rich investors wi
live-cover
LIVE2,091
Scumbag Watch: SPCX Update 10.21
Big Rocket closed at 147.79 in U.S. trading, down 0.11%. The intraday high was 148.66 and the low was 143.27.
Big Rocket released its third-quarter earnings after the market close, greatly exceeding expectations. I’ll share more about the report separately later.
Looking at the candlestick chart first, the stock retested the 60-day moving average again after the U.S. market opened, then rebounded and hovered around 147. The after-hours price has now reached around 160, so we can see how long the earnings boost lasts, especially with a large-scale unlock still a
SPCX-0.01%
ZEC PERPETUAL TRADE
SELL SETUP
Short from $1285
Currently $1285
Targeting $1176 or Down
(Trading plan IF ZEC go up to $1348
will add more shorts)
Its not a Financial advice
#ZEC: #SALAHUDDIN2004
ZEC+10.65%
🔹Musk Unveils Another Trillion-Dollar Vision! SpaceXs Computing Capacity Could Exceed 13 GW Next Ye
live-cover
LIVE2,044
$OP is clinging desperately to support, as if its life depends on it. How much longer do you think this bottom can hold?
Take profit: 0.13459 Stop loss: 0.12422 Other coins: $BIRB : Current price 0.06231 - 24-hour gain: +34.61%$ZEC : Current price 1,268.33 - 24-hour gain: +11.90%
post-image
BIRB+31.10%
ZEC+10.61%
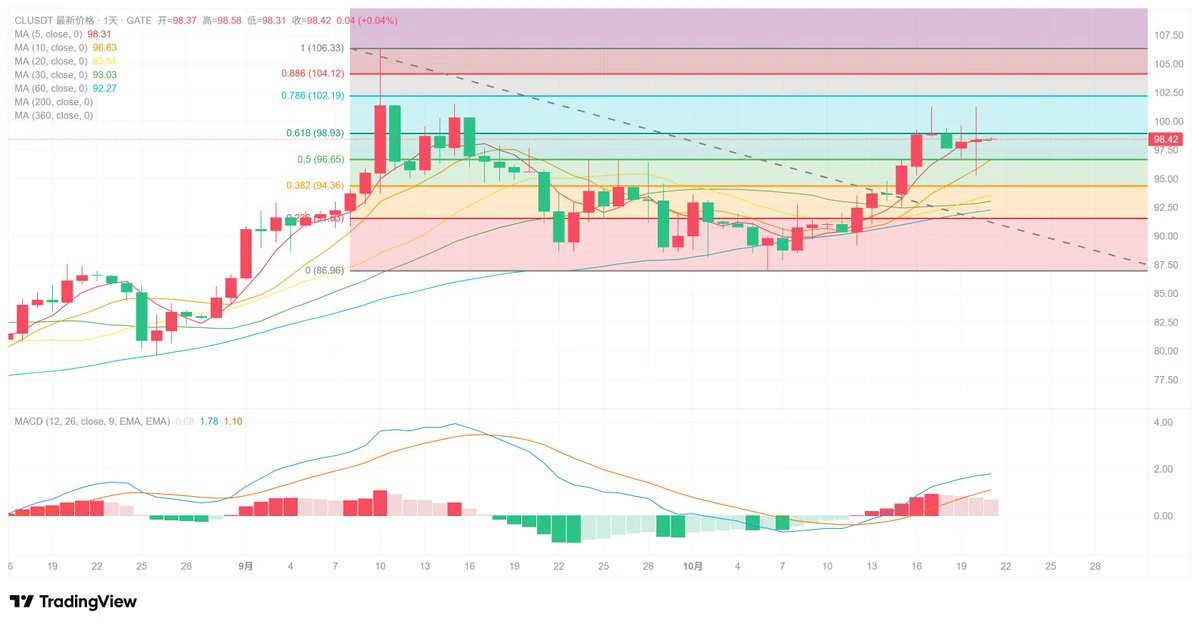
The Jerk’s Take on CL WTI Crude Oil, 10.21
CL rose and then fell yesterday, ultimately closing with a doji. As I’ve said before, a pullback in CL to the 10-day moving average would be an opportunity for us to reduce our U.S. stock positions. CL has now rebounded again, and the headwinds for U.S. stocks remain.
Let’s see how CL and U.S. stocks move tonight. Before the end of the month, we’ll continue to focus on reducing positions into rallies.
post-image
CL+0.28%
After $SPCXB heats up, the first pullback is the real test
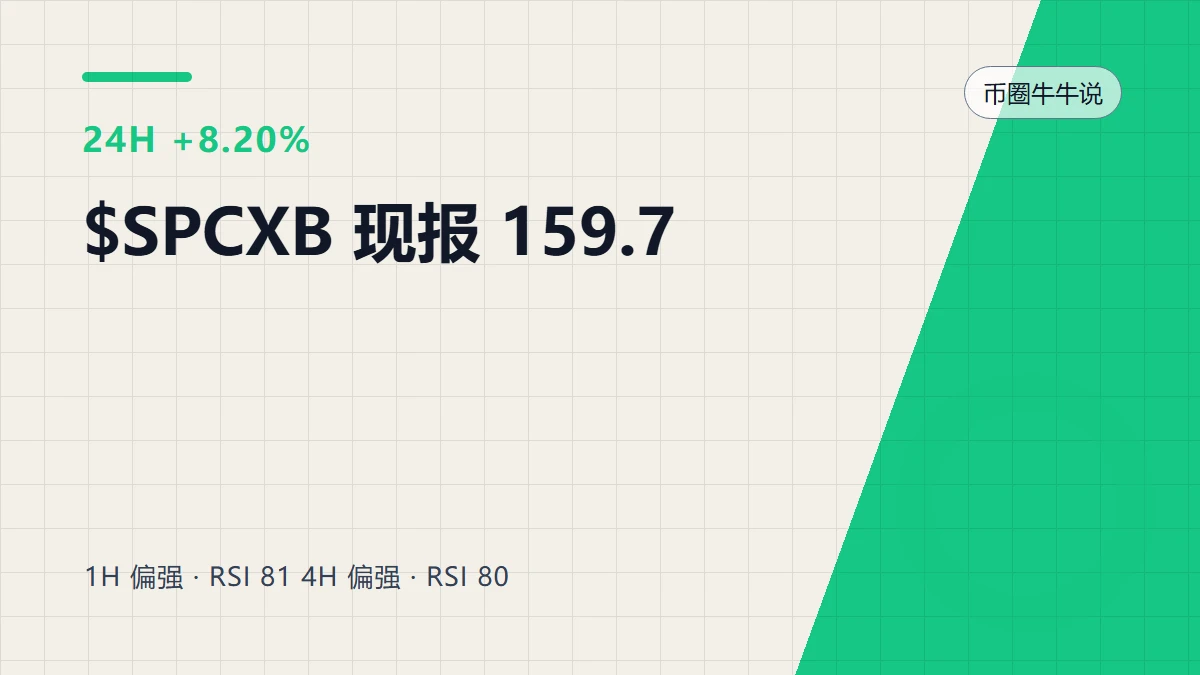
What matters most on this $SPCXB chart is not the 8.20% gain over 24 hours itself, but that the 1-hour and 4-hour timeframes both look strong yet haven’t given the same answer.
$SPCXB The current price is 159.7 USDT, up 8.20% over 24 hours, with a high and low of 161.6 and 143.52, respectively. The 1-hour trend is strong, and the 4-hour trend is also strong. The price is almost at the top of the 24-hour range, with 1-hour resistance at 161.6 directly overhead.
Strength and crowding are really two sides of the same thing. An 8.20% gain
post-image
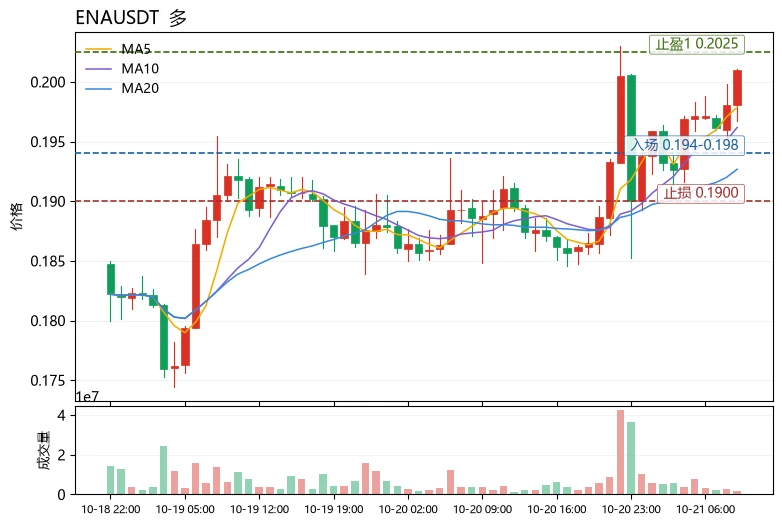
$ENA Current price: 0.201, 24h +6.29%, trading volume 33.9M USDT. MA5=0.19788 has crossed above MA20=0.19268, turning the short- to medium-term structure bullish; the MACD histogram at +0.0006819 remains bullish, but its absolute value is relatively small, indicating moderate progress rather than acceleration; RSI=64.7 is in strong territory but not yet overbought, leaving room to rise; price is near the Bollinger upper band at 0.202594, trading along the upper band, and a breakout needs confirmation from increased volume. The Fear and Greed Index is 63 (Greed), signaling warm but not extreme
post-image
ENA+5.48%
COMP+22.33%
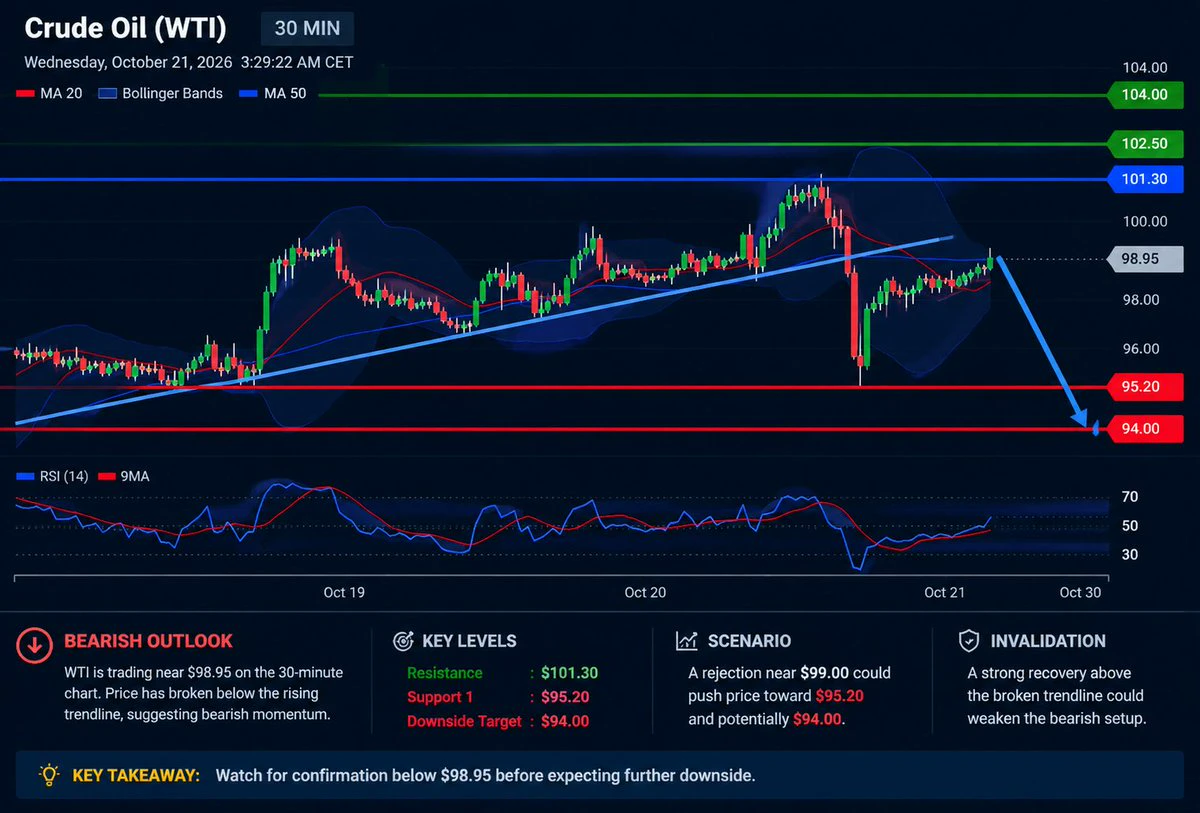
Crude Oil (WTI) – Bearish Outlook 📉
WTI is trading near $98.95 on the 30-minute chart. Price has broken below the rising trendline, suggesting bearish momentum.
- Resistance: $101.30
- Support 1: $95.20
- Downside Target: $94.00
- Bearish Scenario: A rejection near $99.00
post-image
Pinduoduo’s Mac Mini M6 has already dropped to 4,299, and it could fall below 4,000 during Double 11
post-image
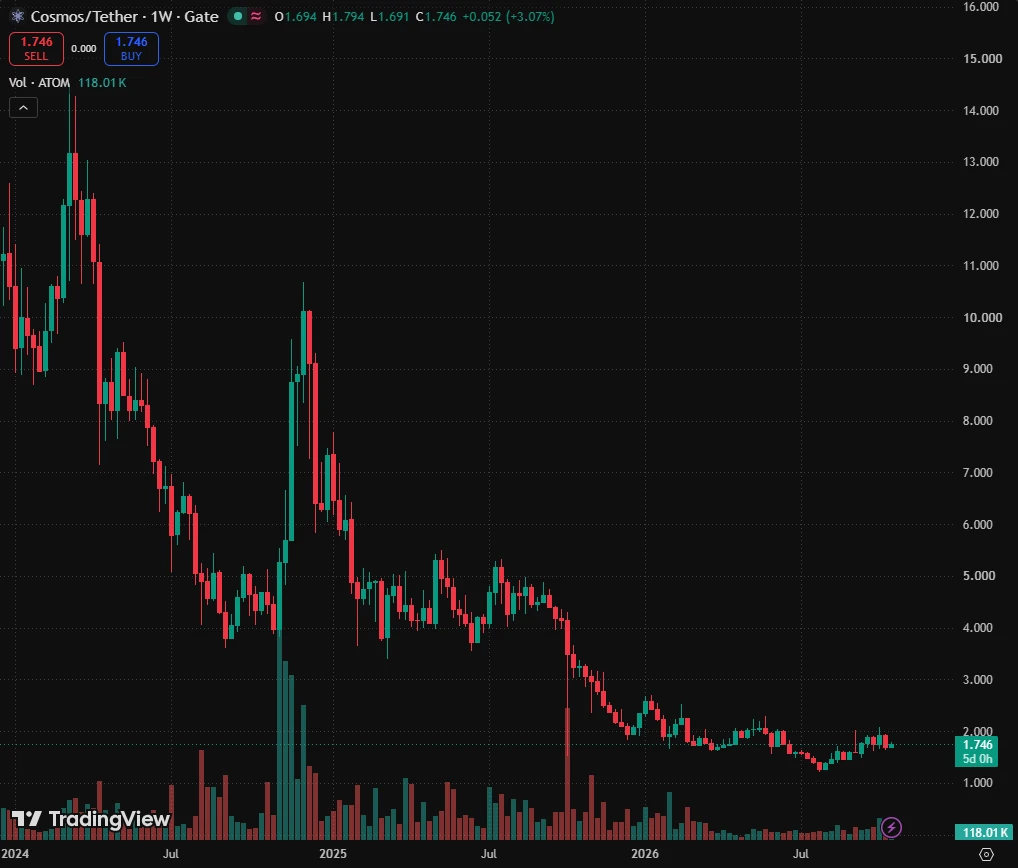
$ATOM ATOM (Cosmos) 4X LONG (PP: 1268%) · Bear-market bottom confirmed
ATOMUSDT (Cosmos) found its bear-market bottom and is now turning bullish. Good things happen here because this project is early compared to most. Some are so advanced that they cannot be bought anymore. ATOM still trades at the bottom, within the opportunity buy-zone.
TA · The last portion of the drop is an ending diagonal. The all-time low and recovery produced a triangular bottom. Both patterns work as bullish reversal signals. Both patterns are being confirmed with recent price action but more is needed.
This is a good
post-image
ATOM-1.42%
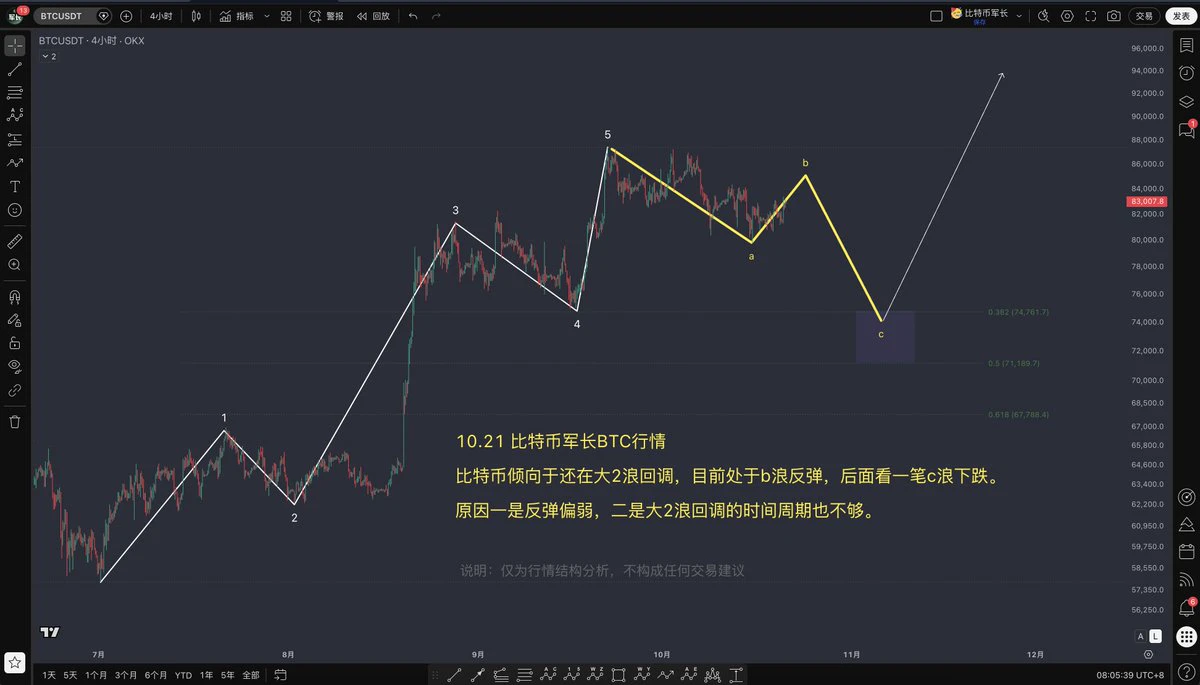
$BTC 10.21 Bitcoin Trend Analysis
Bitcoin is likely still in the larger Wave 2 correction and is currently experiencing a Wave B rebound, followed by a Wave C decline.
The first reason is that the rebound is relatively weak, and the second is that the time period of the larger Wave 2 correction is also insufficient.
Risk warning: This is only a market structure analysis and does not constitute any trading advice.
#BTC走势分析 #比特币走势分析
post-image
BTC+1.51%
#特斯拉Q3财报 #每周来晒 Tesla’s Q3 earnings are unlikely to beat expectations across the board; short-term share price swings hinge on tangible Robotaxi progress
I. Earnings are likely to be a mixed bag, with margin pressure the key concern
1. Deliveries meet expectations, but revenue forecasts are lowered
Q3 deliveries reached 486,500 units, beating market expectations for the second consecutive quarter, but were still down 2.1% year over year. Consensus revenue is around $27.8 billion to $28.1 billion, down 10%-14% from a year earlier, while consensus EPS estimates have been cut by 3 cents over the p
TSLA+1.55%
  • 4
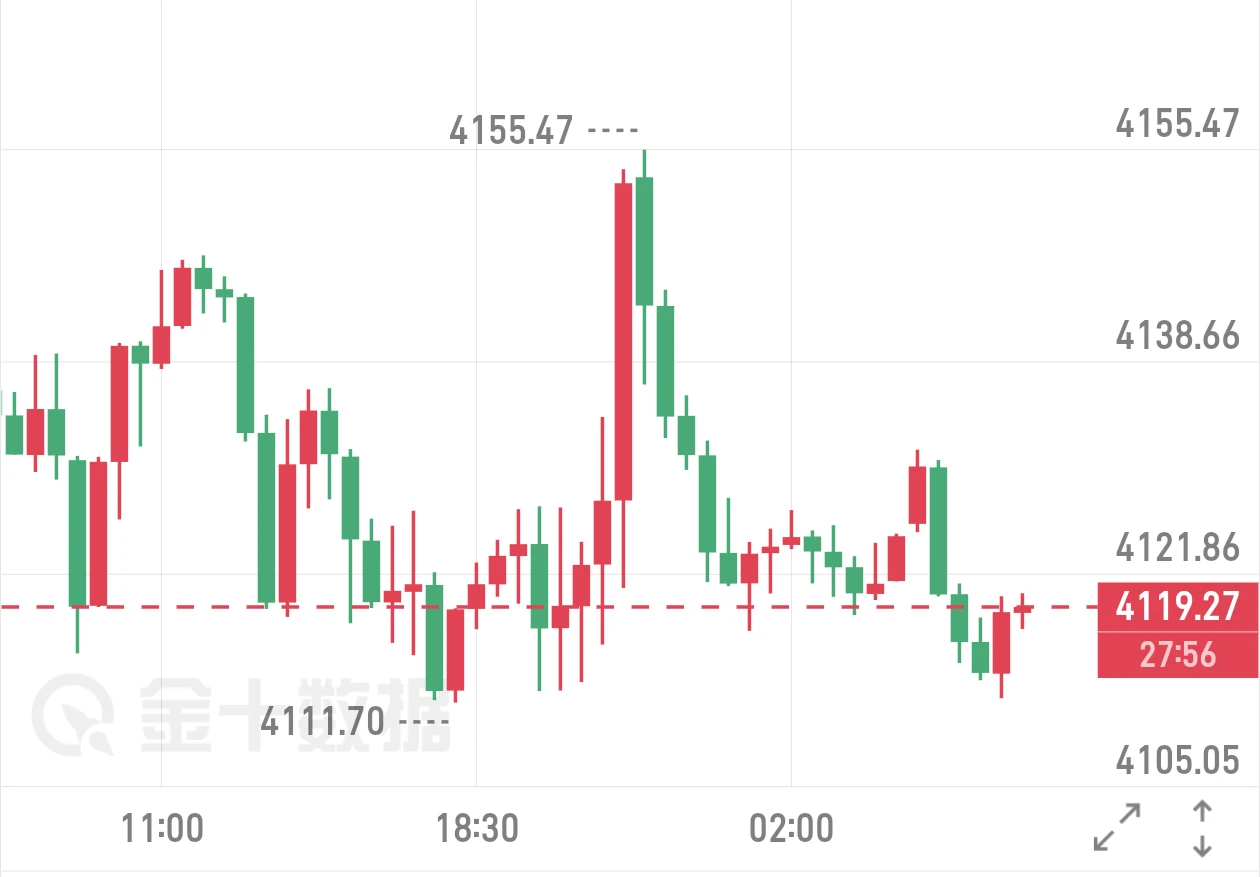
$XAUT 10.21 Gold Outlook
Gold is at a critical juncture as macro headwinds contend with long-term support, with elevated U.S. Treasury yields and the dollar weighing on prices in the short term
In the medium to long term, central bank gold purchases and gold’s inflation-hedging properties support a floor; next week’s Fed rate decision will be a key catalyst for near-term direction
From a technical perspective, there is still no clear bottoming signal on higher timeframes; the daily chart has repeatedly tested resistance at the middle band, and each rebound has lacked sustained buying
Trading r
post-image
XAUT-0.20%
Load More

Join 40 M users in our growing community

⚡️ Join 40 M users in the crypto craze discussion

💬 Engage with your favorite top creators

👍 See what interests you

Trending Topics

GateRanks2ndIn30DayNetInflows

6.49k Views795 Discussing

According to DefiLlama, Gate recorded over $199 million in net inflow over the past 30 days, ranking second among global centralized exchanges. Capital keeps flowing in — what's your strategy? [👉 Read more](https://www.odaily.news/en/newsflash/525820)

GateIdleFundsSurpass$300M

10.03k Views1.49k Discussing

TeslaQ3EarningsPreview

4.04k Views142 Discussing

View More