
Square
Following
Hot
News
Notifications
Profile
Share your thoughts
placeholder
Article
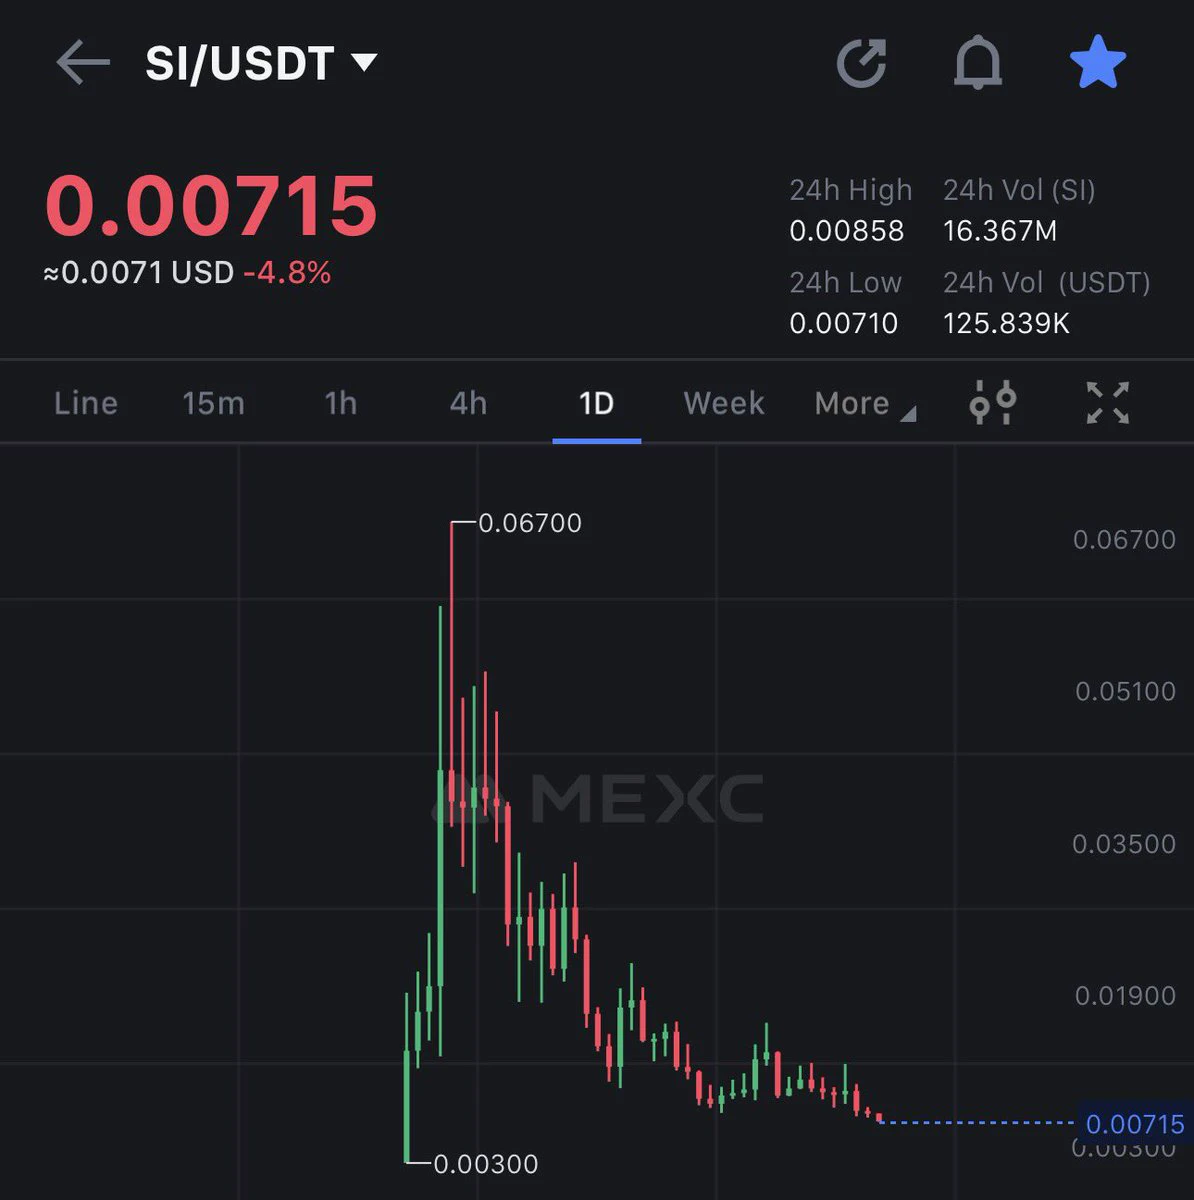
$SI is the most undervalued meme rn.
The last time i was in a meme where Elon’ posts could pump the chart was $grok and it did 300 million MC.
SI has both Elon and Trump’ effect.
Don’t be surprised if it does Billions from here.
post-image
SI-0.73%
GROK-3.49%
MUSE’s [Spaces] feature is really useful
It basically lets you customize your own website or functional app directly
I sent one prompt—to pull data from TG groups, news, and market prices
After one round of optimization
I can now get the latest market updates, news, and hot topics anytime in Spaces
Creating customized services for yourself is seriously awesome. That’s the greatest value of a personal Agent: customization is what maximizes its value most.
post-image
MUSE-2.05%
Trenches
ZIG
Z
bade
b
ZIG
0x8c...1145
Market Cap
$.
Change
.
24h Vol
$.
Holders
.
BTC
B
bade
b
BTC
C5xp...pump
Market Cap
$.
Change
.
24h Vol
$.
Holders
.
José
J
bade
b
José
87CQ...1UJT
Market Cap
$.
Change
.
24h Vol
$.
Holders
.
IDOL
I
bade
b
IDOL
0x3b...ab07
Market Cap
$.
Change
.
24h Vol
$.
Holders
.
scamsem
s
bade
b
scamsem
41Wp...pump
Market Cap
$.
Change
.
24h Vol
$.
Holders
.
Over seven days, people buying actual $BTC on the US spot venue outspent sellers by +$331M, yet leveraged traders on the global perp market ended net sellers at -$14M. Their selling hit -$223M in the 24 hours to Nov 7.
BTC-0.67%
There’s definitely a reason you’re able to be in the United States.
post-image
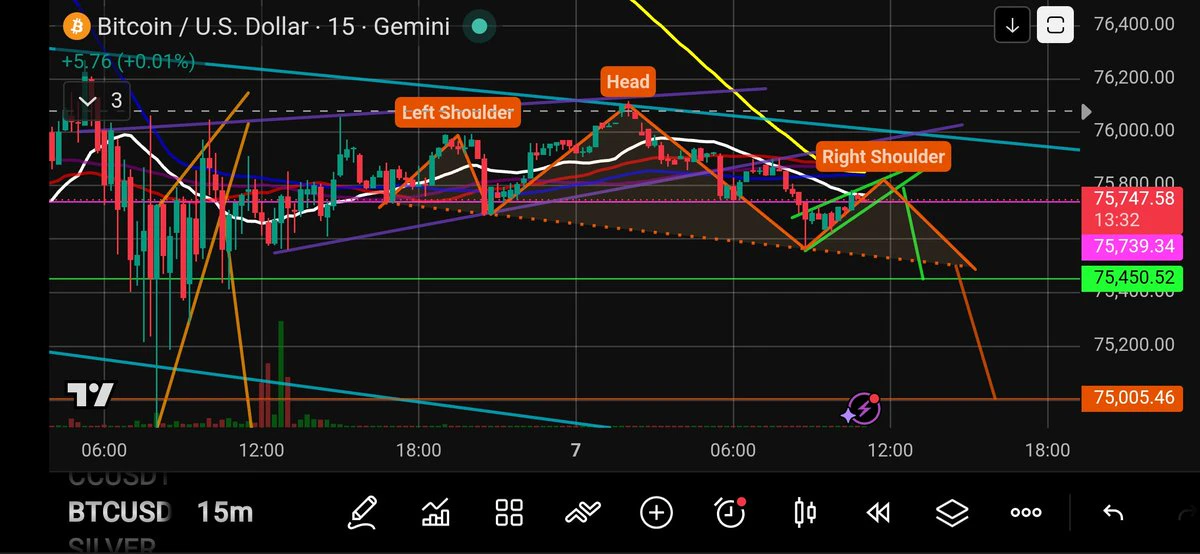
$BTC Rejection Begins! 👀
Now I'll watching this orange head and shoulder reversal pattern forming the right shoulder.
Inside the right shoulder we see a green rising wedge.
The patterns are telling us a bearish story.
Price continues to get chased down by the yellow 15 min 200MA. More bearish confluence.
$BTC Near-Term Bearish Targets 🎯
1) $75,560
2) $75,450 (Approx)
3) $75,000 (Approx)
4) $74,423
Some targets are approximate because the breakdown of the pattern has yet to occur.
NFA, DYOR ⚠️
#Crypto #Trading #BTC
post-image
BTC-0.67%
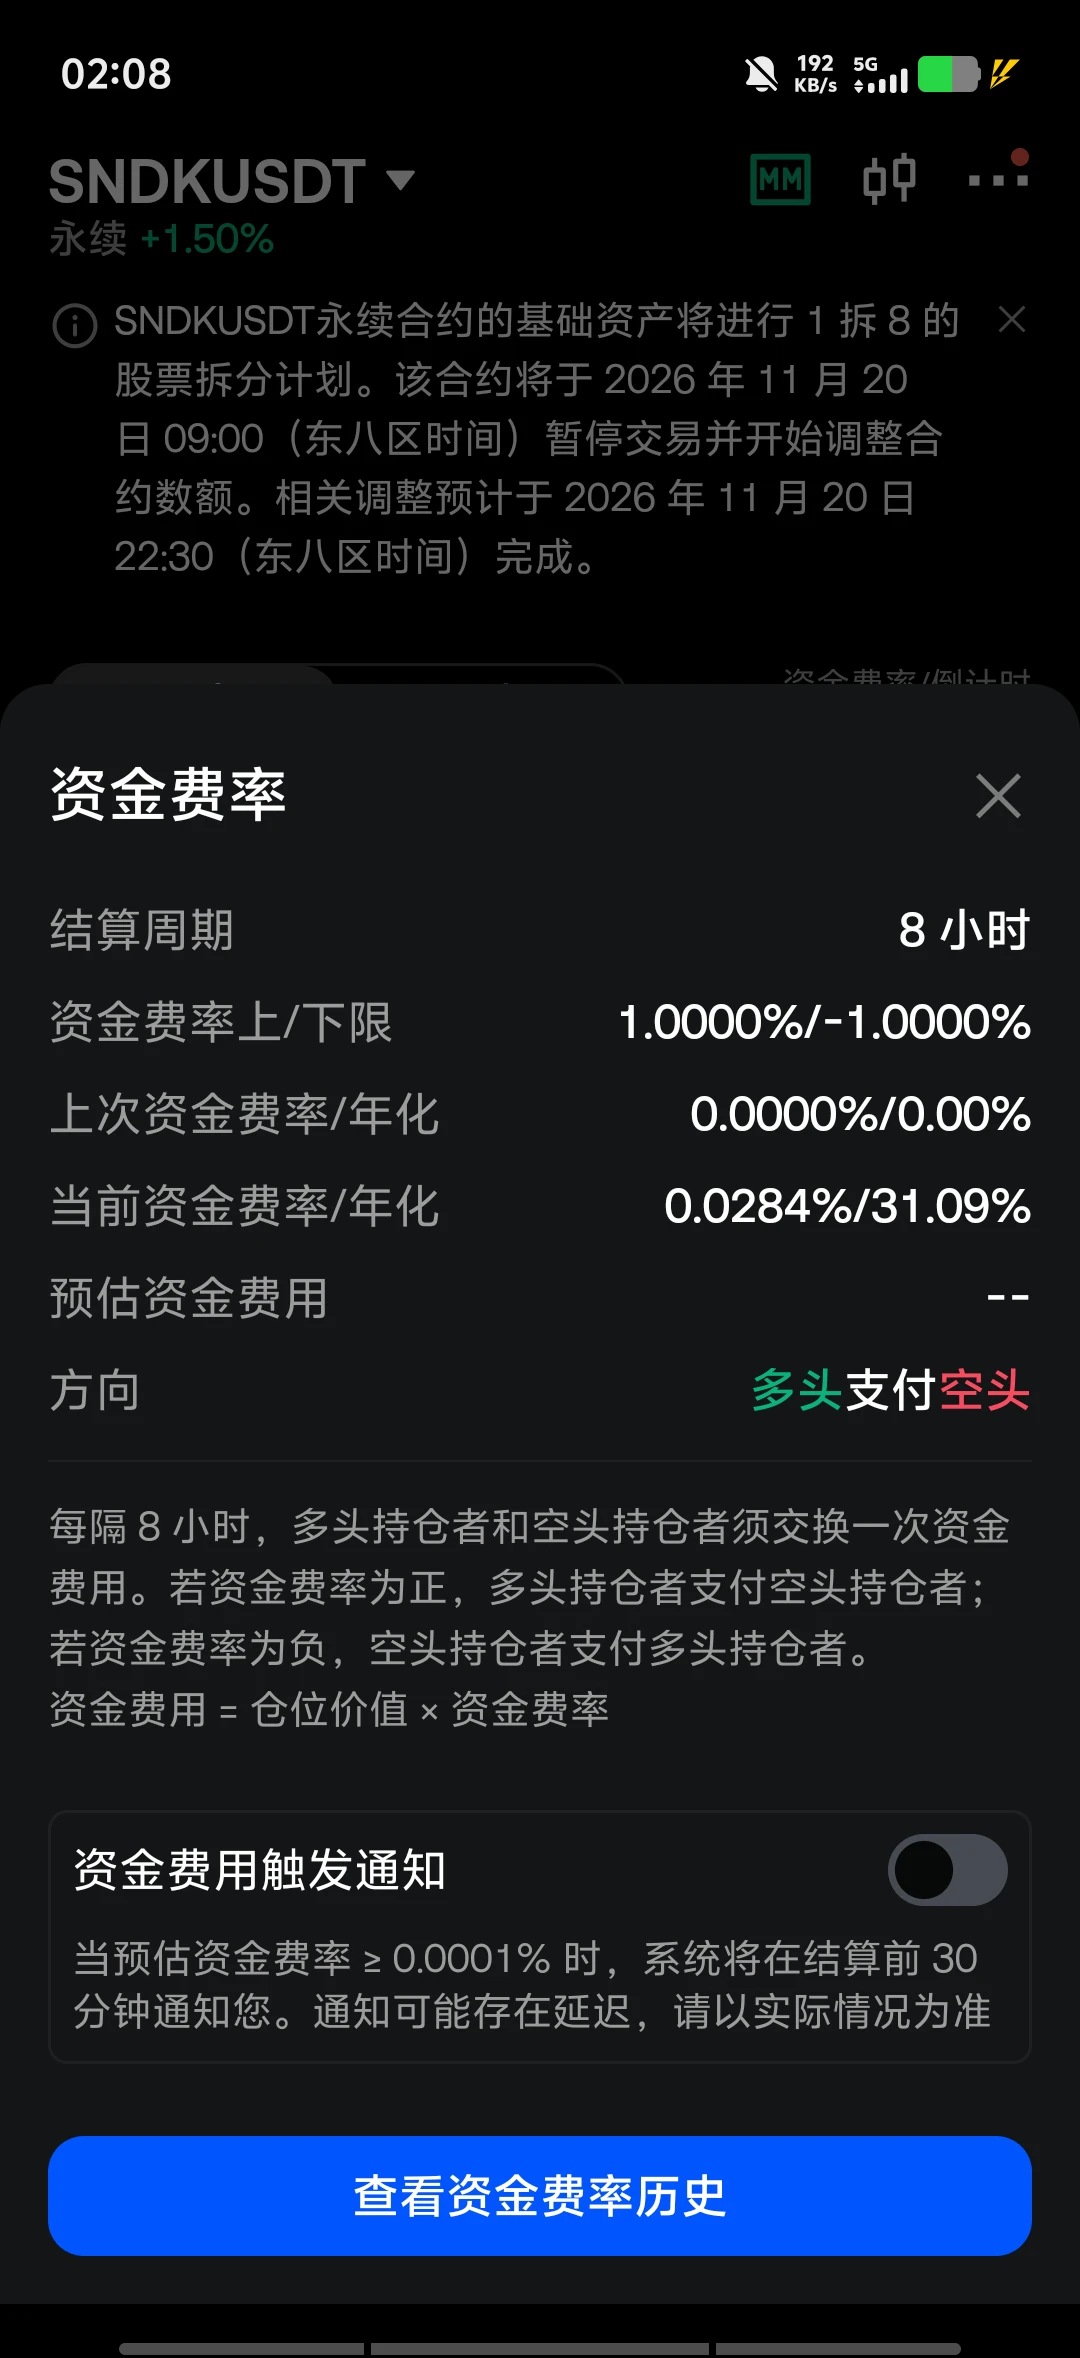
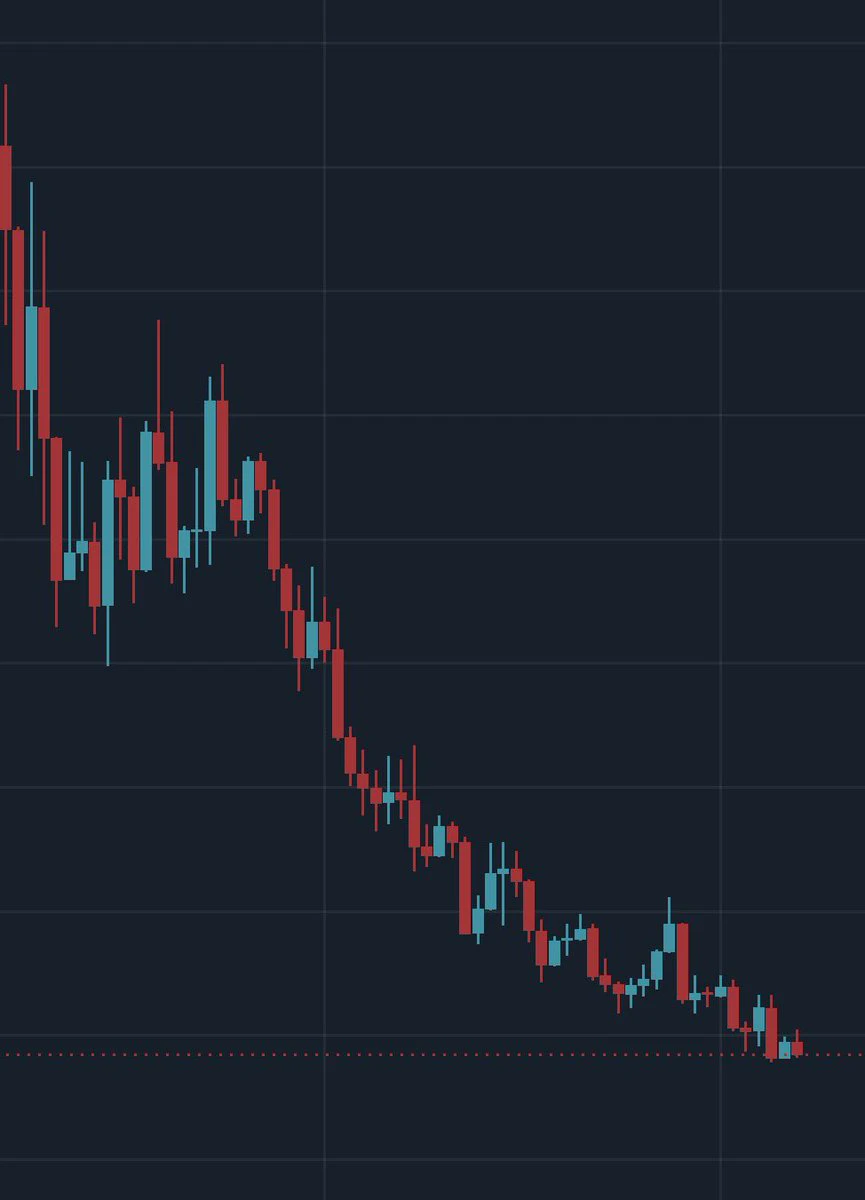
SanDisk had already been draining my funds this whole time. I thought I’d try the “steal U for takeout” strategy, but ended up stuck with an ant-sized position. I’m done—drop already!$IDOL $SNDK $SOXL ‌ ‌ ‌
post-image
IDOL-7.01%
SNDK-0.18%
SOXL-1.16%
$XAG Copy the bot below for free. Increase returns and reduce risks.
XAG+0.47%
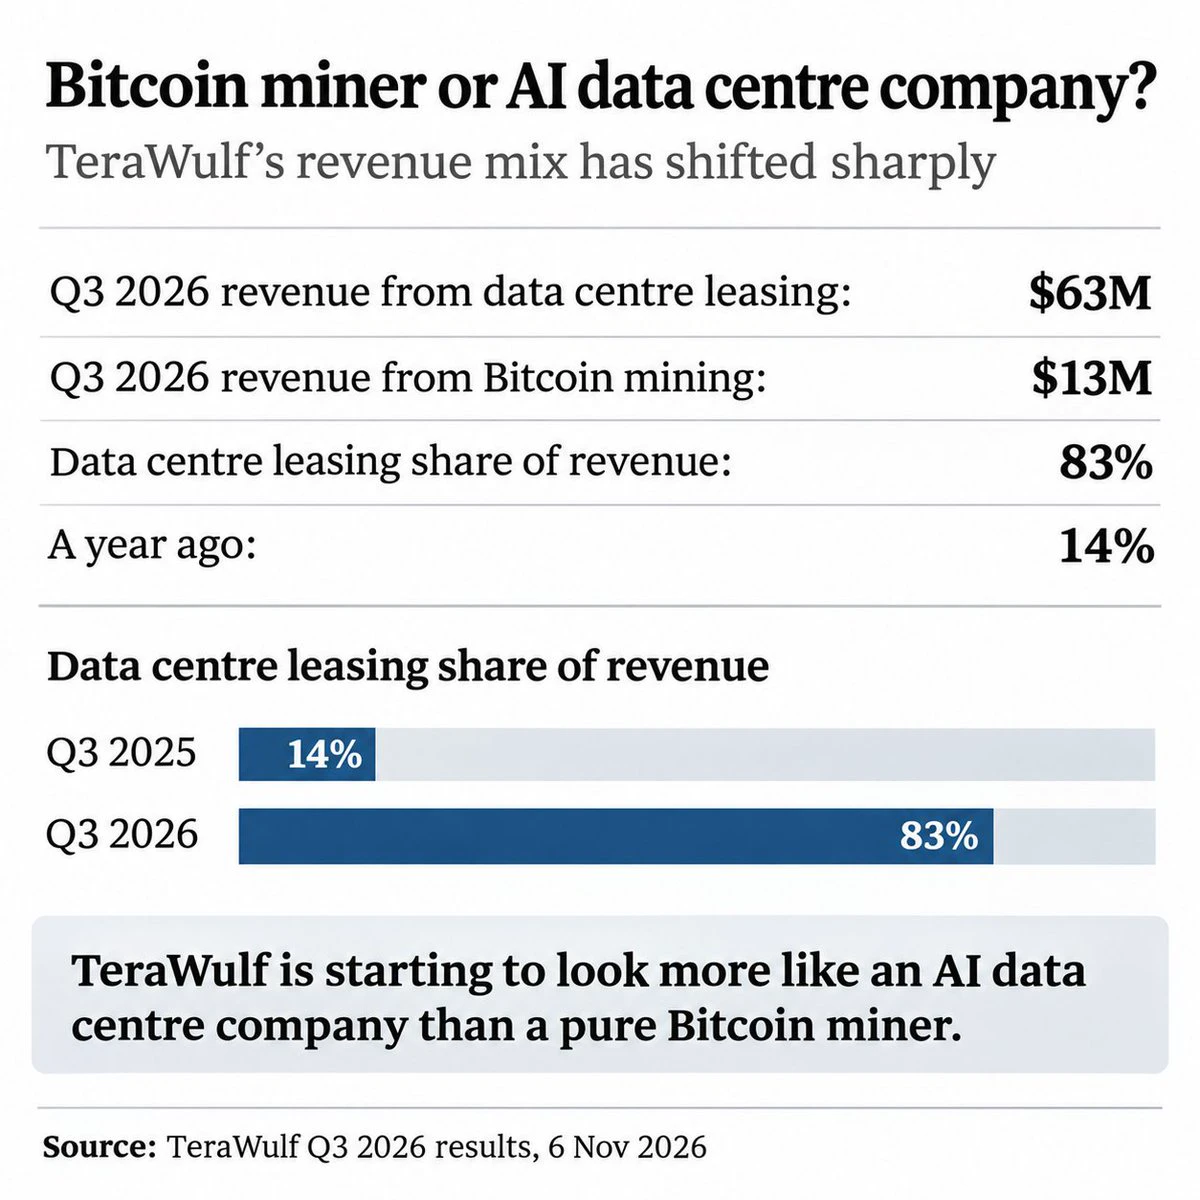
Some Bitcoin mining stocks are turning into AI infrastructure investments 👀
Look at TeraWulf. Last quarter, it made $63M from data centre leasing and just $13M from Bitcoin mining.
If you're buying mining stocks because you're bullish on BTC, it's worth checking what business you're actually investing in.
#Bitcoin #BitcoinMining #AI
post-image
BTC-0.67%
Core Automation trained one AI model in two data centers 9,000 miles apart, and it came out about 1% better than training in one place on the same compute.
The US and Asian sites only had to exchange updates every 50 training steps. I like these types of tests.
Kidly send me followers red packet arrange a time 60 minut in my live streaming i am starting the
live-cover
LIVE17
Does @elonmusk have a favorite meme?
post-image
Robinhood chain visualized
post-image
HOOD+4.25%
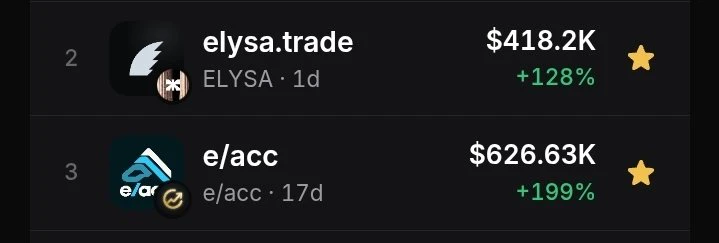
Money is flowing into the Elysium network.
$ELYSA and OG $eacc both instantly 2x...
post-image
OG+0.11%
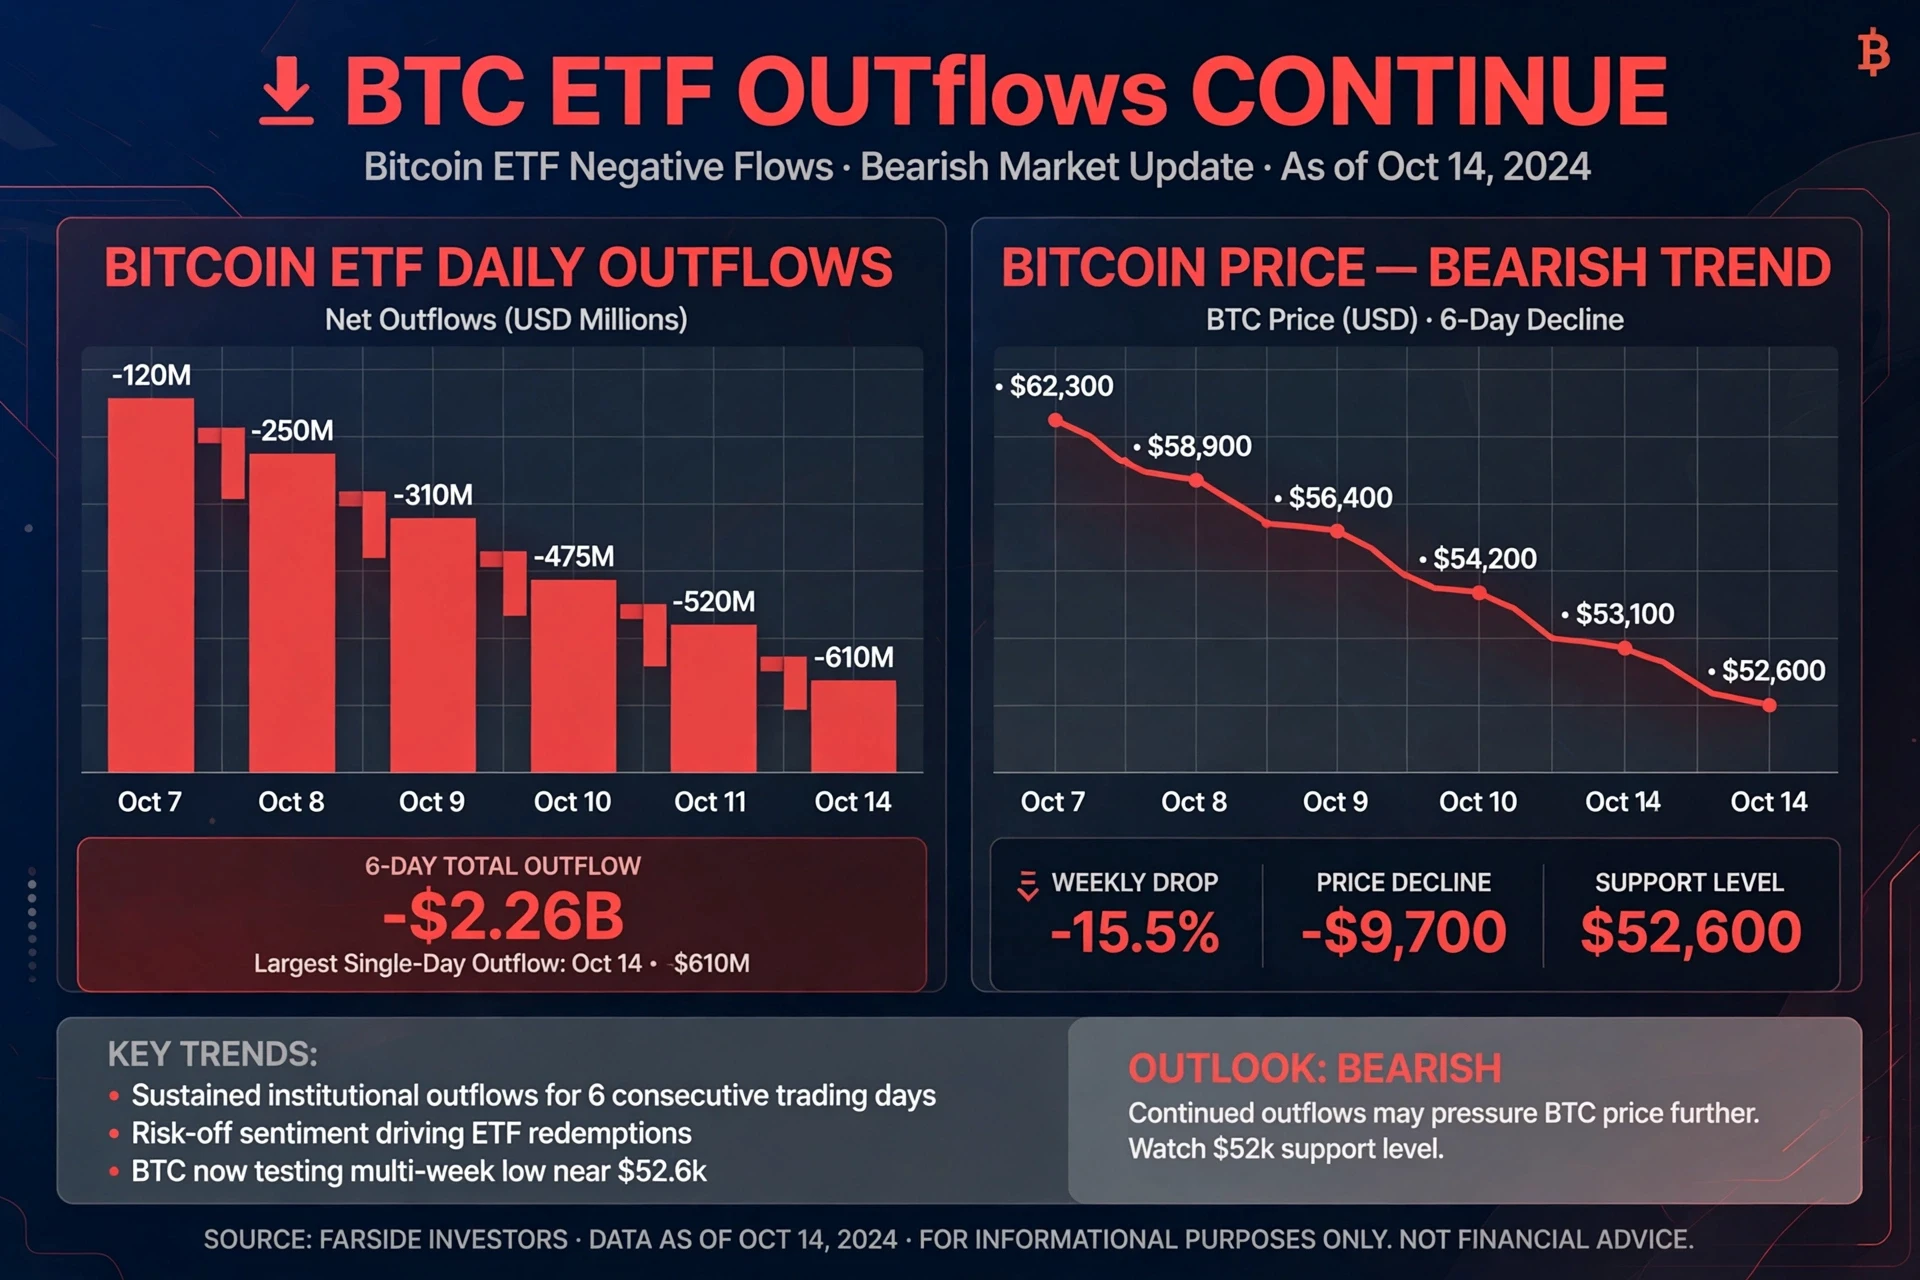
*#BTCETFOutflowsContinue — Institutional Pressure Persists*

Bitcoin ETFs remain under pressure, posting a *6th consecutive day of net outflows*.
On Oct 14 alone, ETFs saw *-$610M* in outflows, pushing the 6-day total to *-$2.26B*, according to Farside Investors — one of the largest outflow streaks since launch.

Bitcoin price has mirrored the trend, falling from $62,300 to *$52,600 — down -15.5% (-$9,700)* in 6 days, now testing multi-week support.

Key drivers: Risk-off sentiment, profit-taking, and broader crypto market weakness. Sustained redemptions signal cautious institutional position
post-image
BTC-0.31%
GN to those who GN💤
post-image
MARKET PREDICTION
live-cover
LIVE86
$SIGN ‌ just showed some serious volatility. Is a reversal finally brewing?

SIGN is trading near $0.00937 after briefly dipping to $0.00828 and bouncing sharply.

That long lower wick suggests buyers stepped in, but the daily trend remains bearish below the Supertrend at $0.01133.

Key levels I'm watching:

Support: $0.0090
Major support: $0.00828
Immediate resistance: $0.0106
Breakout zone: $0.0111–$0.01133

A sustained move above $0.01133 could signal a stronger recovery. Losing $0.00828 would put sellers back in control.

Interesting reaction from the lows, but bulls still have work to d
SIGN-2.90%
AMD+11.55%
$ACT It posted an 11.84% green candle over the past 24 hours, and the sentiment gauge flashed two extreme readings: the Fear & Greed Index surged to 78 (the upper end of the greed range), while the funding rate hit +0.035% (longs are paying, and positioning is crowded). How do these readings compare with historical levels? Over the past three months, ACT’s funding rate has risen above 0.03% only twice: once in early February, when it spiked to 0.0145 before pulling back 18% over two days, and once in mid-March, on the eve of a sideways stretch. The pattern is clear: once longs push the funding
ACT-1.76%
XRP Technical Outlook: Ripple Breaks Lower as Selling Pressure Pushes Price Toward $1.00 Support

XRP is showing renewed bearish momentum on the daily chart after losing its recent consolidation structure. Price has dropped below all four major EMAs, while RSI is approaching oversold territory. The key question now is whether buyers can defend the current area or whether XRP will continue toward its previous major low near $0.99.

1. EMA Structure: Bearish Alignment

Current XRP price: $1.1623

- EMA 20: $1.2714
- EMA 50: $1.3188
- EMA 100: $1.3161
- EMA 200: $1.3580

XRP is trading below all
XRP-1.12%
  • 1
Load More

Join 40 M users in our growing community

⚡️ Join 40 M users in the crypto craze discussion

💬 Engage with your favorite top creators

👍 See what interests you

Trending Topics

USAIStocksHitHard

20.78k Views3.67k Discussing

U.S. stocks sold off sharply on Thursday, November 5 (UTC). The Nasdaq closed down around 5.5%, entering correction territory, while the Philadelphia Semiconductor Index plunged roughly 12%, with chip stocks including $NVDA and $AMD posting steep losses. Beyond profit-taking, investors are growing concerned about the pace of AI data center construction, capital spending, and future returns on investment. The key question now is whether the AI sector’s lofty growth expectations need to be repriced. Where do you think the next opportunities will emerge: chip stocks, tech giants, or other sectors?

USNonfarmPayrolls

33.48k Views4.34k Discussing

StakeOnLaunchpoolToShare450KVLX

9.28k Views827 Discussing

View More