Square
Following
Hot
News
Notifications
Profile

DigitalAssetResearch

vip
No content yet
Peak Tier VIP 02.0 Year(s)
0
Following
13
Followers
76
Liked
Highly recommend watching this video from March 2023.
If I hadn't put a date on it, you might think it was recorded today.
The market setup, the way we were thinking about the cycle, and the opportunity we were watching are remarkably relevant.
post-image
The cycles suggest we're at a peak buying opportunity for meme coins.
Look at the timing:
• 180 days from the May top.
• 60 weeks from the major cycle top.
• The 7th week following 6 consecutive red weeks — a Gann rule worth watching.
• Seasonal time.
• 60 days from the early September meme coin highs.
The price action is starting to get interesting, too.
PEPE showing relative strength through the weekend selloff is notable.
We're seeing similar signs of rotation in equities. DNUT surged 40% on Friday amid market fear, while KSS is now moving near its yearly highs.
This doesn't look like a mar
MEME-0.94%
PEPE+0.97%
KSS+7.90%
Despite election fears and Bitcoin weakness, the resilience of the altcoin market has been one of the biggest stories of the year.
Watch what the market is actually doing, not what you think it should be doing.
post-image
BTC-0.67%
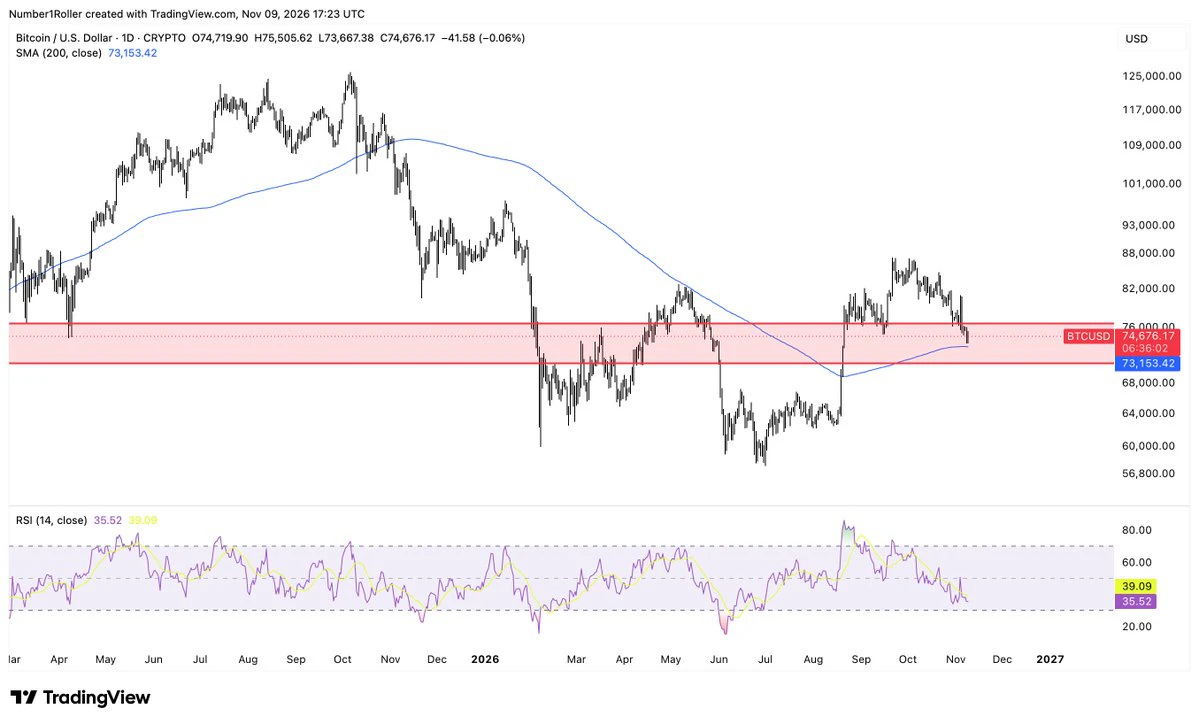
There has been a fairly consistent 56 week top to bottom cycle since mid 2022. Measure from a major weekly top in the previous year and you get a major weekly bottom in the following year. This week is 56 weeks from that October 2025 top.
  • 1
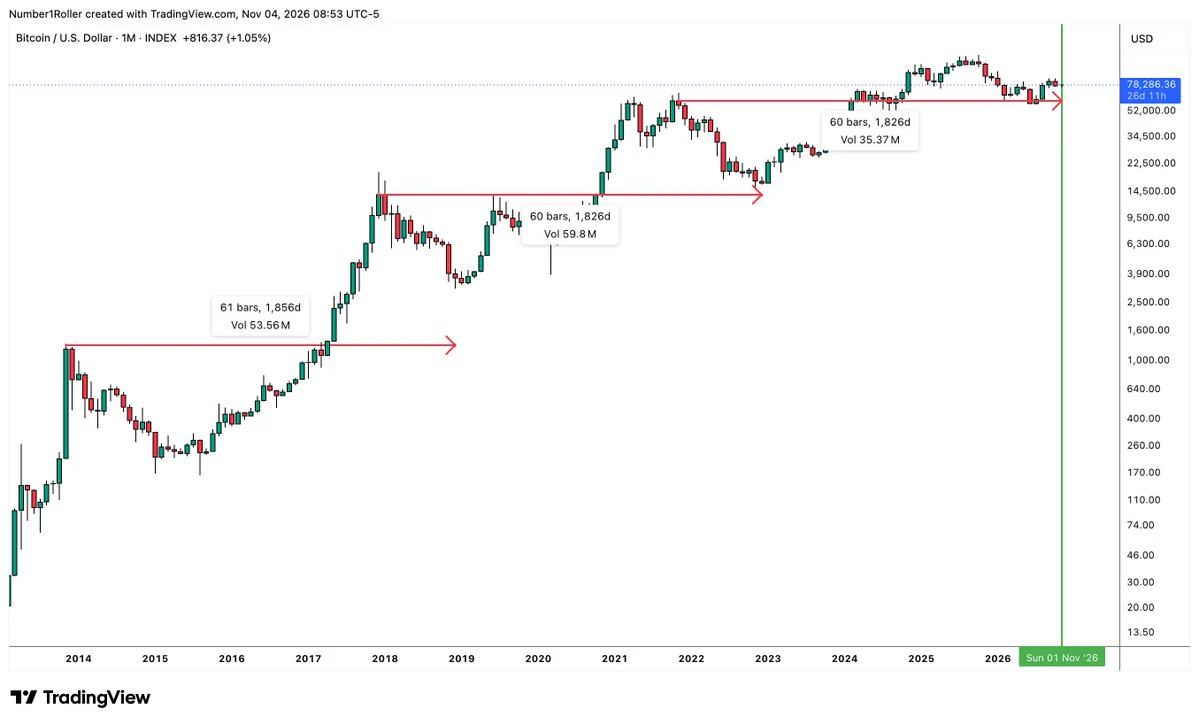
The 60 month major top to major bottom cycle is another strong historical pattern that slates this month for a major bottom in BTC.
post-image
BTC-0.67%
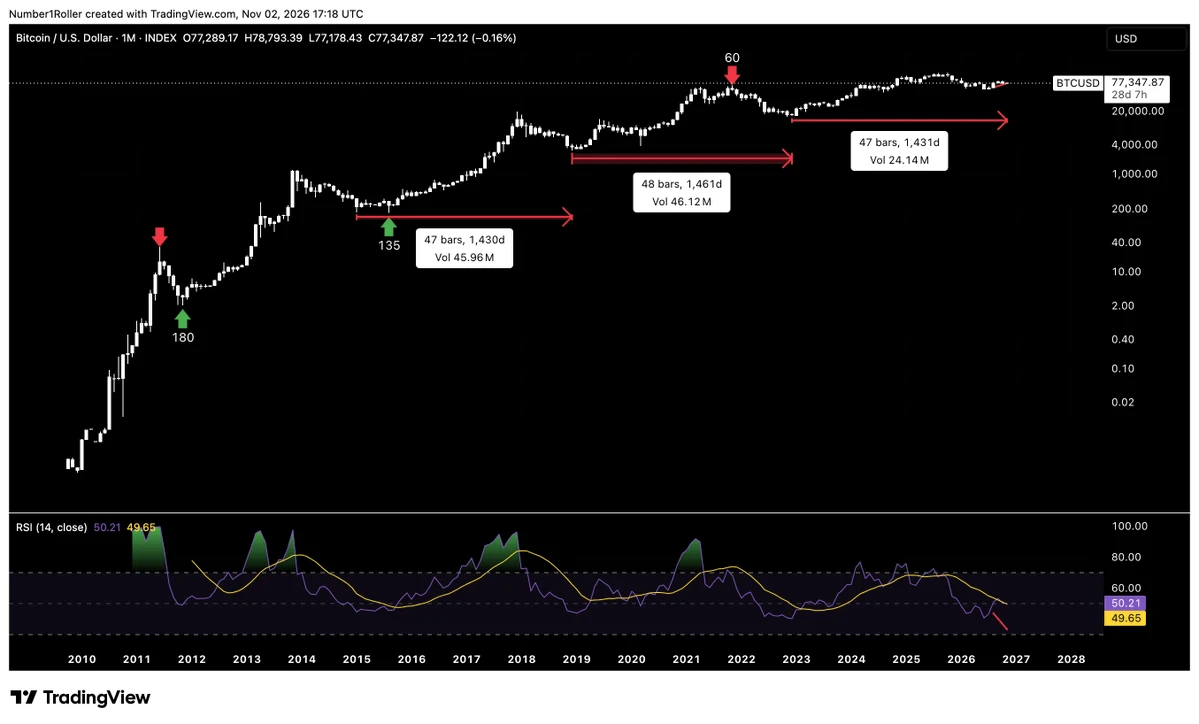
November is one of the most pivotal months of the year. Not only is the classic 47 month (4 year) cycle due for a low but it also aligns with the major 180 month cycle which produced a major market bottom back in November 2011.
post-image
Familiar pattern for ETH
ETH-1.26%
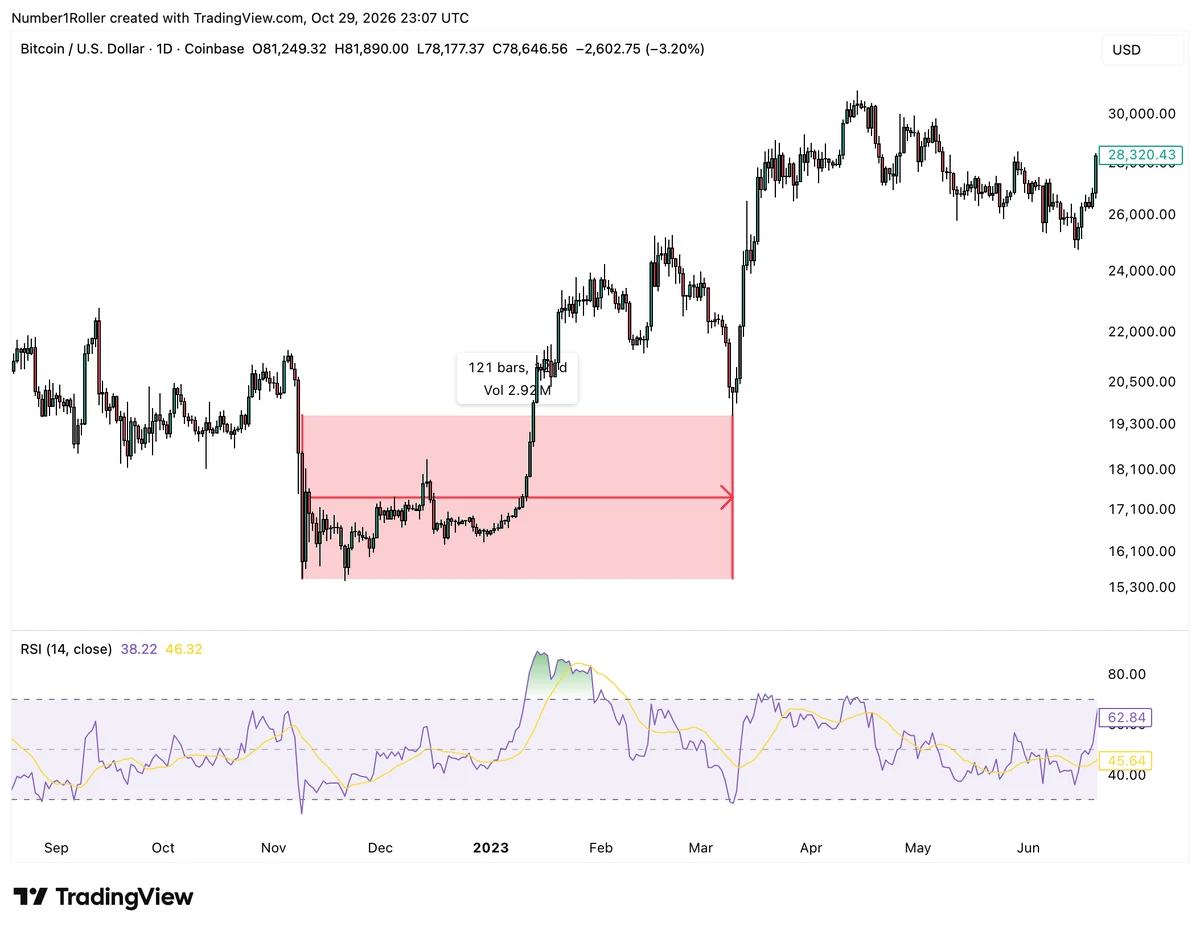
In 2023, the Silicon Valley Bank crisis created one of the most frightening moments of the early bull market.
Bitcoin experienced a sharp reversal, sentiment deteriorated and investors questioned whether the recovery was already over.
But the timing was interesting.
That panic occurred approximately 120 days after the November 2022 FTX collapse.
Fast forward to this year.
We're seeing a remarkably similar sequence of events approximately 120 days after the summer low.
The news is different. The market structure isn't identical. But the timing and the character of the decline deserve attention.
post-image
BTC-0.67%
Why November is as important as June for this market.
BTC.D is at the top of its year long range while also completing the exact same 69 week time range before the 2021 collapse.
BTC-0.67%
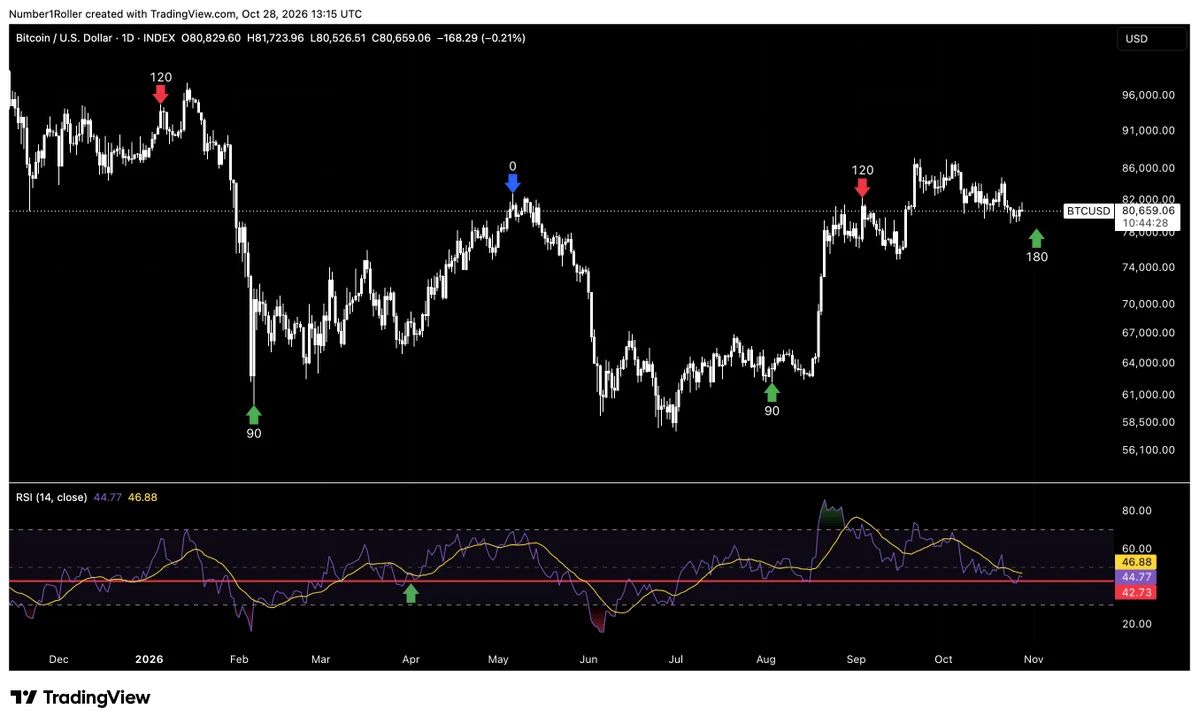
A simple view of btc looking at the year in seasonal times and breaking it into 3rds and 4ths.
The major high of the year was on May 6th. Why may 6th? Because the cycle starts on the 21st of march at the spring equinox.
When we measure from that point both forward and backward 90 and 120 degrees (breaking the year into 3rds and 4ths) you get the corresponding arrows.
These arrows also fall directly around seasonal dates and midpoints.
What time is saying is that we are at the next turn and the 90s have been giving us lows while the 120s have been giving us highs.
Had you sold the red arro
post-image
BTC-0.67%
Applying Time Cycles to Crypto
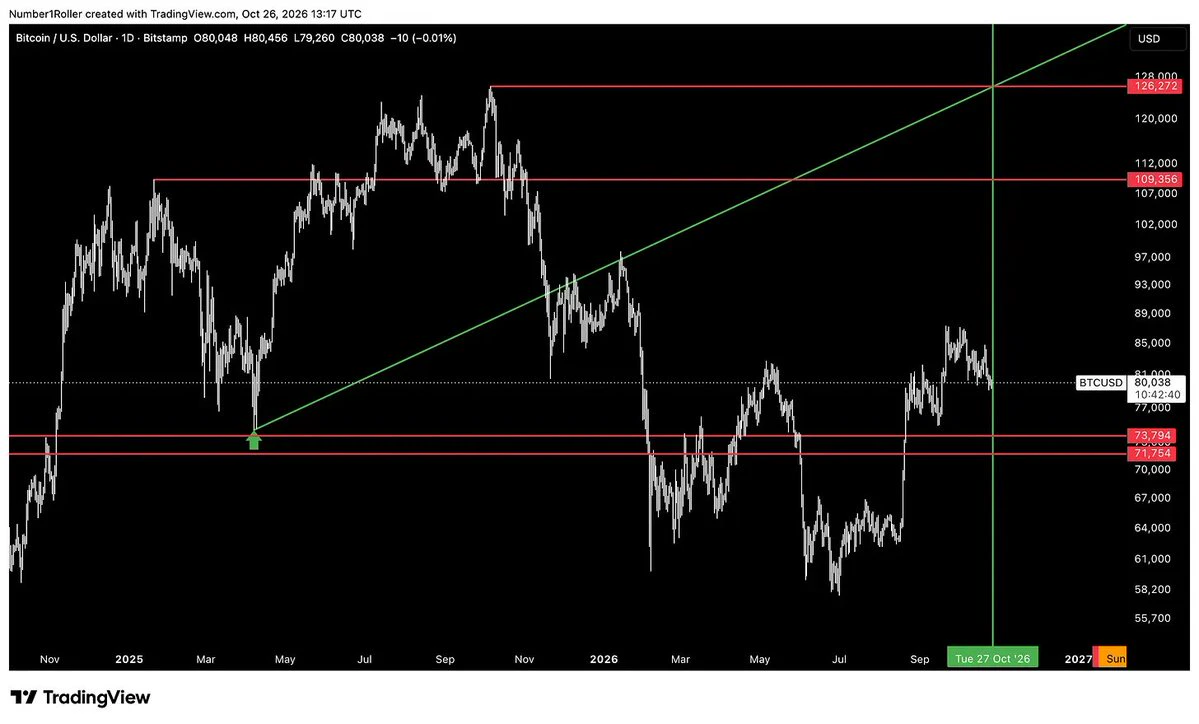
BTC time and price squaring out off the 2025 panic low tomorrow. BTC trading at 80k eighty weeks later. High probability change in trend. Given the direction and sentiment expect a low to take shape going into November.
post-image
BTC-0.67%
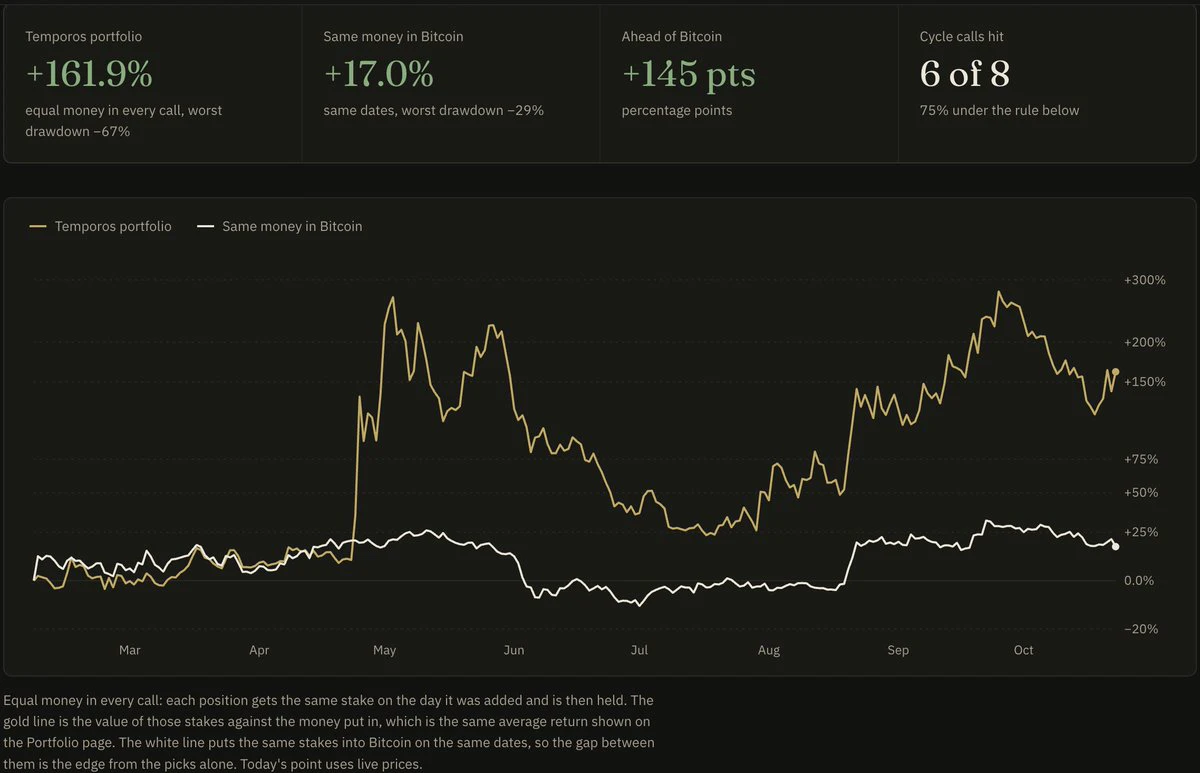
Our alt coin portfolio is trouncing BTC performance since the February lows.
We respected what the charts were telling us all year rather than 4 year cycle dogma.
Some of these positions are already nearing +1000% gains while people still argue about whether or not its a bear market.
Time is the edge ⏳
post-image
BTC-0.67%
In a market where creating something new is easy, surviving long enough to become significant is much harder.
Temporos Terminal V2 is now live for members.
Cycle forecasts
Temporos portfolios
And performance track record all in one place.
ETH/BTC time and price squaring out just like it did 75 months ago. Expecting ETH to begin another major outperformance leg against BTC.
ETH-1.26%
BTC-0.67%
Time is the edge ⏳
Is history repeating?
ETH has been trading in a tight range since late August with a deviation above the range and now what could be the setup for a deviation below the range. Last time we saw this pattern unfold ETH rallied nearly 135% in 60 days.
ETH-1.26%
Could this week be the low of q4 and the start of a move that catapults ETH over 5k by year end?
Thats what we will look at in today’s report.
ETH-1.26%
Load More