Square
Following
Hot
News
Profile
Share your thoughts
placeholder
Article
You’re logged into your account, but a script sells your positions and transfers your money?
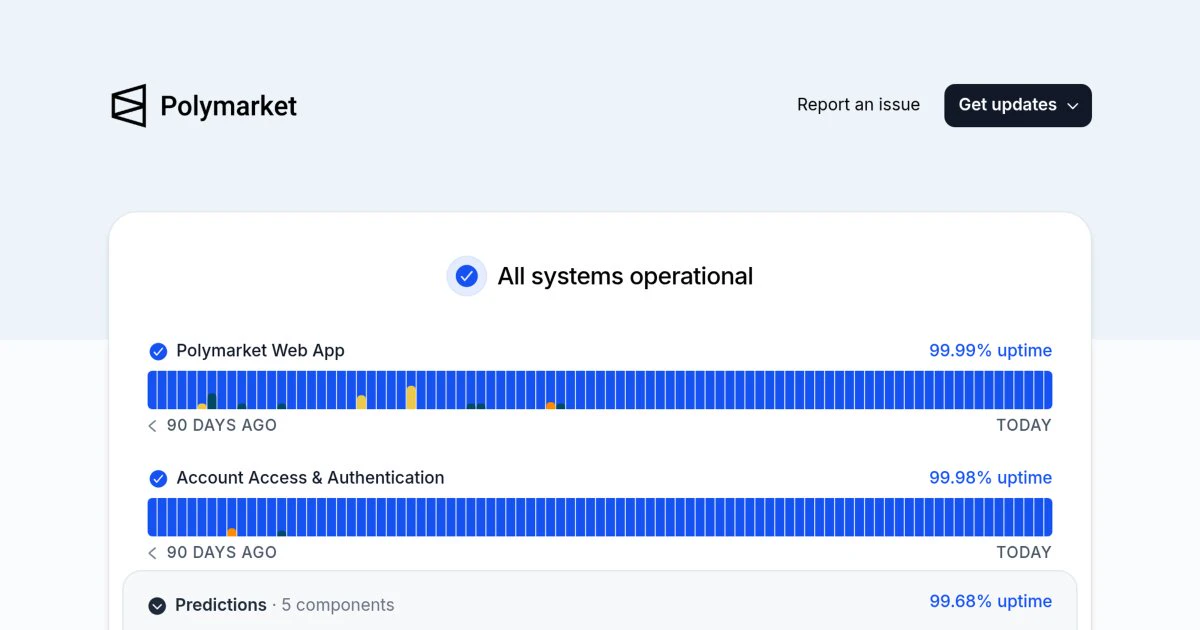
This time, Polymarket wasn’t hit by a smart contract exploit. A third-party performance monitoring vendor was compromised, and its script was replaced with a fund-draining tool.
In the October 29 attack, the attackers exploited some users’ active sessions to sell their positions and move funds out of their wallets—your money was gone even while you were logged in.
The official response was to remove the script, clear caches, pause trading and the relayer, then reopen after cleanup and reset all active
post-image
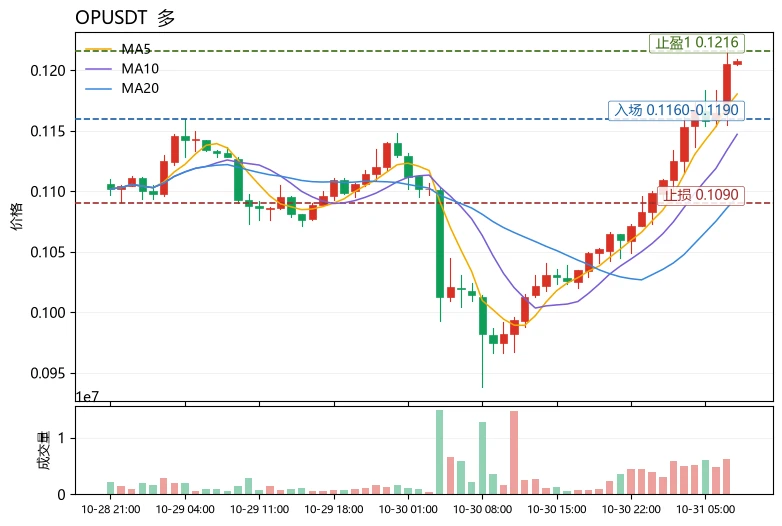
$OP Current price: 0.1208. The first resistance above is the Bollinger upper band at 0.1216; pullback support is at MA5 0.1180, with strong support at MA20 0.1096. These levels mark the current divide between bulls and bears. The conclusion first, then the rationale.
Trend health can be assessed using three checks: “moving average alignment + momentum + sentiment.” First, check whether MA5 is above MA20 and both are rising in tandem: OP’s MA5=0.1180>MA20=0.1096, so the medium-term structure remains bullish. Second, check whether momentum is keeping pace: the MACD histogram at +0.001537 remains
post-image
OP-1.31%
BEAMX+5.82%
Trenches
ZIG
Z
bade
b
ZIG
0x8c...1145
Market Cap
$.
Change
.
24h Vol
$.
Holders
.
IDOL
I
bade
b
IDOL
0x3b...ab07
Market Cap
$.
Change
.
24h Vol
$.
Holders
.
SAFU
S
bade
b
SAFU
0x7c...7777
Market Cap
$.
Change
.
24h Vol
$.
Holders
.
Q
Q
bade
b
Q
0xc0...0589
Market Cap
$.
Change
.
24h Vol
$.
Holders
.
STONK
S
bade
b
STONK
6GmA...UNgx
Market Cap
$.
Change
.
24h Vol
$.
Holders
.
Have breakfast, grab a cup of coffee, and sit quietly for a while
In the crypto market, you have to survive before you earn the right to talk about the future. Young people, don’t rush to chase big gains. If you make a few hundred RMB a day, you wouldn’t even have to work, right? And what about compounding over time? So don’t rush—I know you’re in a hurry
Good morning, Zuo Zuo has a recap of last night’s U.S. markets for you☕
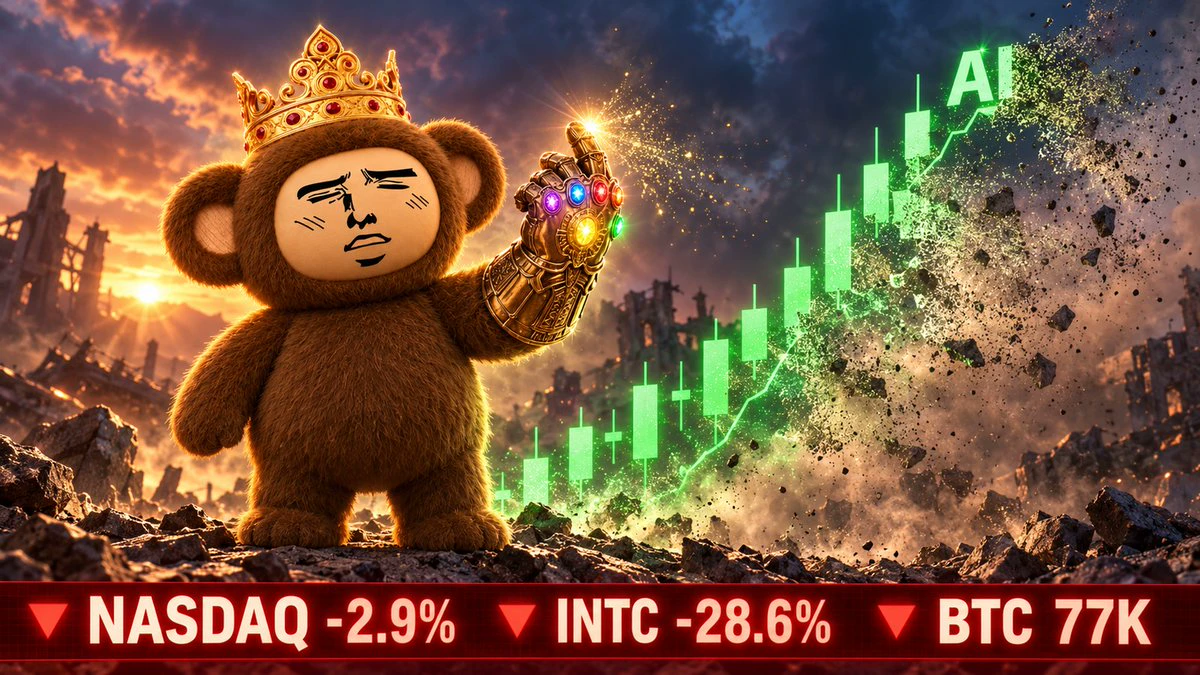
On the last trading day of October, AI giants’ earnings were all tallied up—and the market marked them down across the board📉
At the close:
Nasdaq -2.9% to 25,437, down 5.3% for all of October—its worst month since March last year
S&P 500 -1.8% to 7,580
Dow -1.1% to 51,770
The hardest hit was $INTC:
Down 28.6% in a single day to $65.76. It had surged about 250% at one point this year, then gave back nearly a third overnight
The U.S. government’s 10% stake lost about $12 billion in a day
Nvidia -4.2%, while Amazon and Alph
post-image
INTC-28.49%
AMZN-1.55%
BTC-0.67%
#AIP AIP mode officially launches
  • 1
The AI cash-burning inflection point: Apple “coasts” back to No. 1 in global market cap
At Friday’s close, the crown of the world’s largest company by market cap quietly changed hands: Apple, at $5.03 trillion, overtook Nvidia at $4.93 trillion. Ironically, Apple actually fell 1.2% that day—it won only because Nvidia fell harder, dropping 4.2%.
Behind this is a clear signal: the market is starting to do the math. As investors reassess the returns on AI infrastructure investment, “cash flow” is suddenly carrying much more weight. Alphabet posted free cash flow of -$9.1 billion in the third quar
post-image
NVDA-4.16%
AAPL-1.18%
Copy Trading Live Profit Show
live-cover
LIVE912
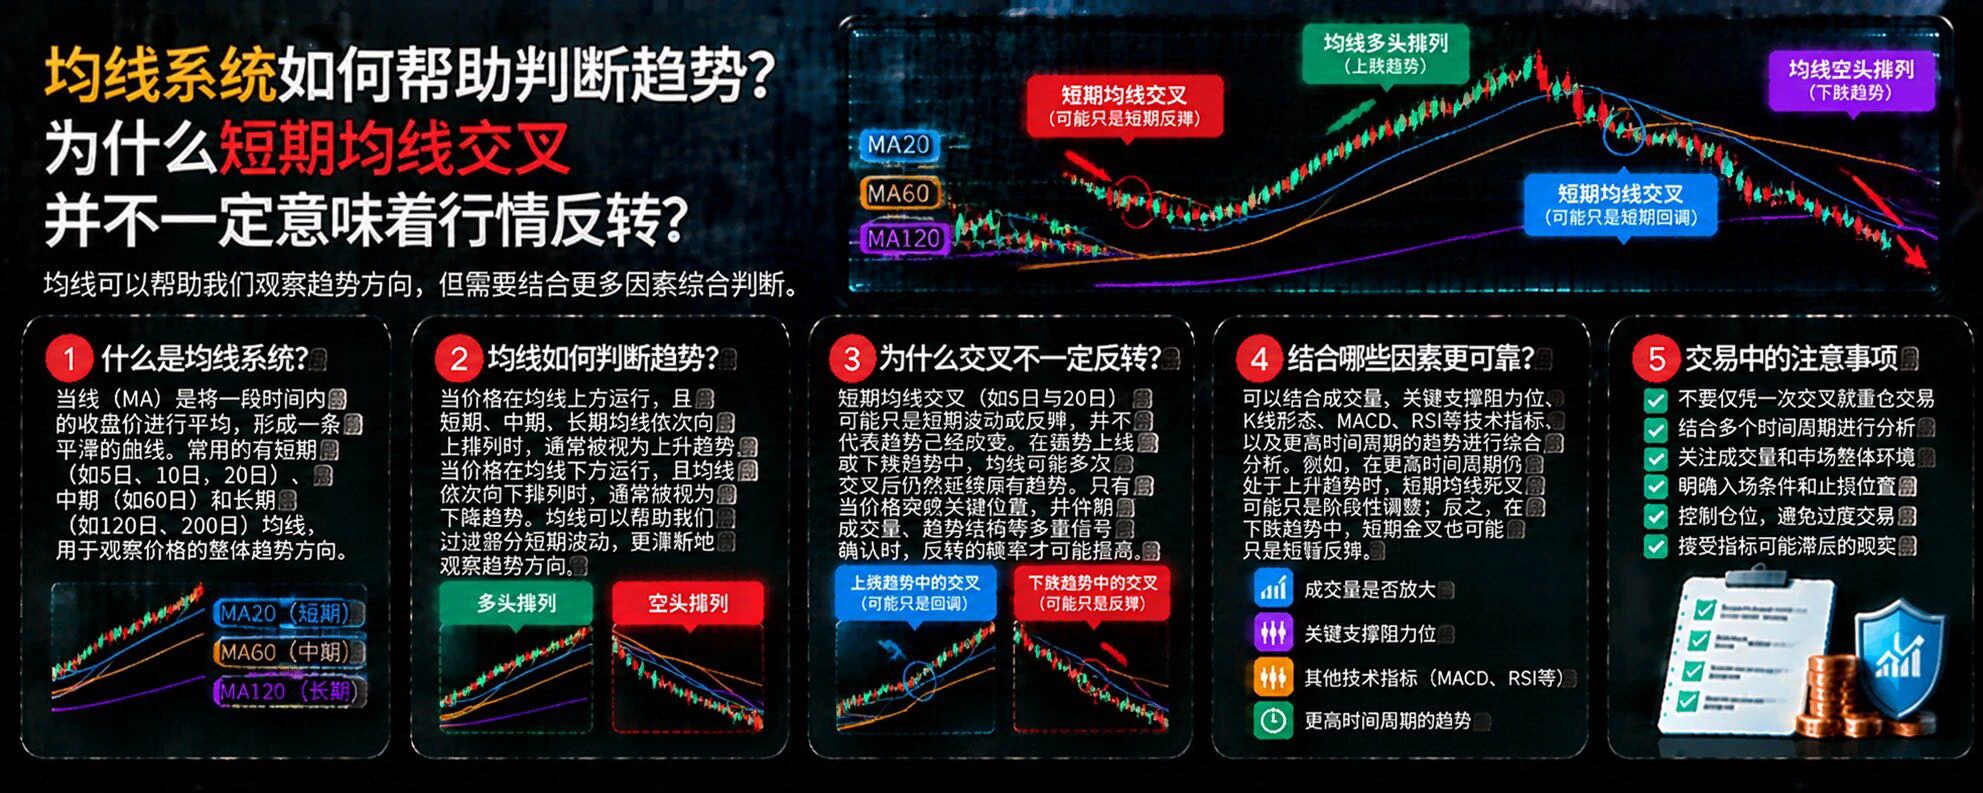
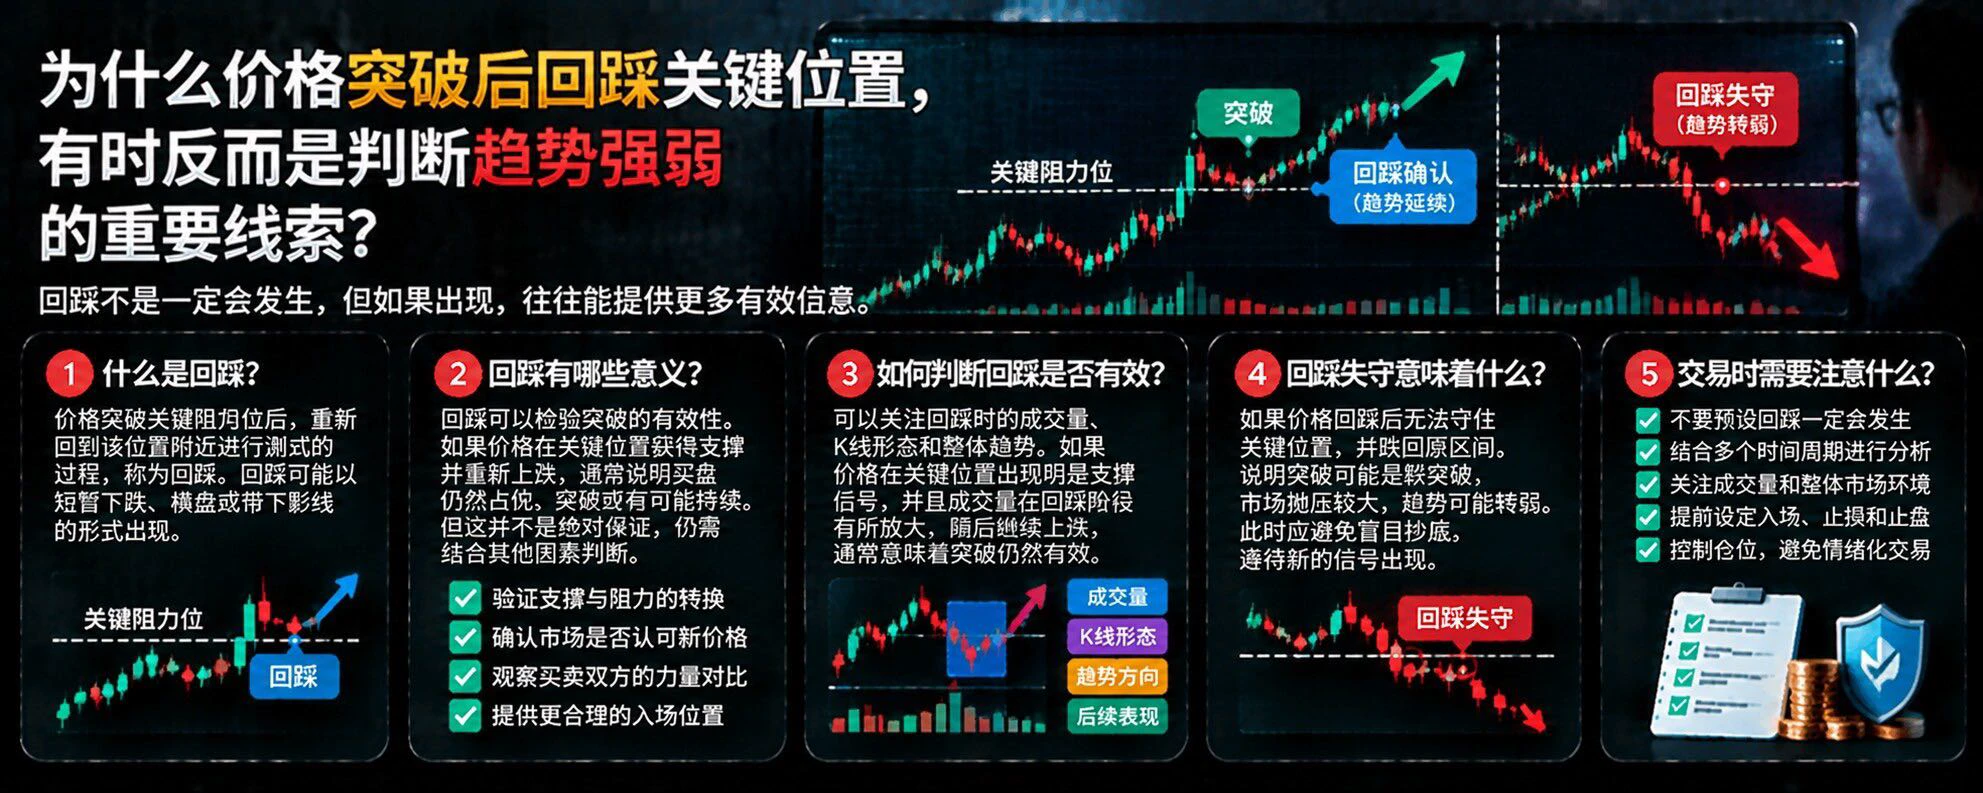
How Can Moving Average Systems Help Identify Trends? Why Don’t Short-Term Moving Average Crossovers Necessarily Signal a Market Reversal?
In the crypto market, moving averages (MAs) are a commonly used tool for observing price trends. They smooth out short-term price fluctuations and help traders identify market direction, but moving average crossovers are not definitive signals for predicting price movements.
First, what is a moving average system?
A moving average is a curve formed by calculating the average price over a specific period. Common settings include MA20, MA60, and MA120, which a
post-image
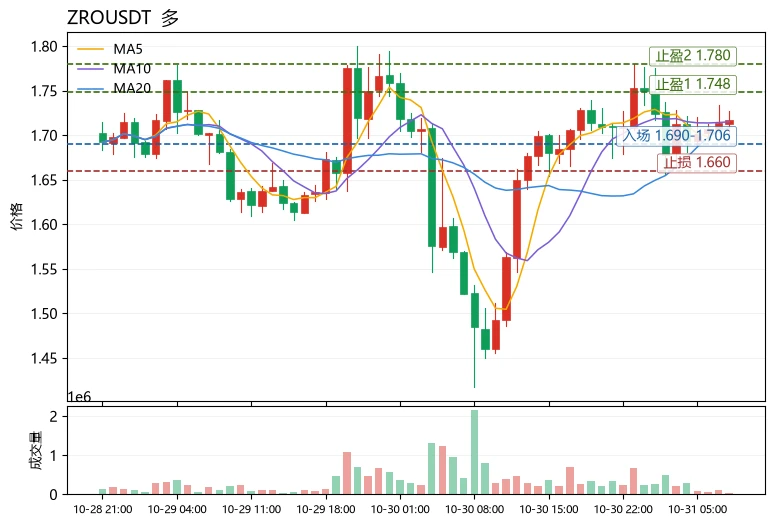
Does a moving-average golden cross always signal a healthy trend? Not necessarily—$ZRO is a textbook example right now.
$ZRO surged 19.24% in 24 hours to 1.717, but MA5 (1.7066) is still slightly below MA20 (1.7083), and the moving averages have yet to form a bullish alignment; RSI is just 54.9, in the neutral-to-weak zone; and the MACD histogram is negative (-0.0006759), so momentum is unconfirmed. This shows the price was lifted by a single impulse move, while the trend structure has yet to recover. A reusable approach to assessing trend health: first check the moving-average alignment (MA
post-image
ZRO-2.59%
SOPH-3.83%
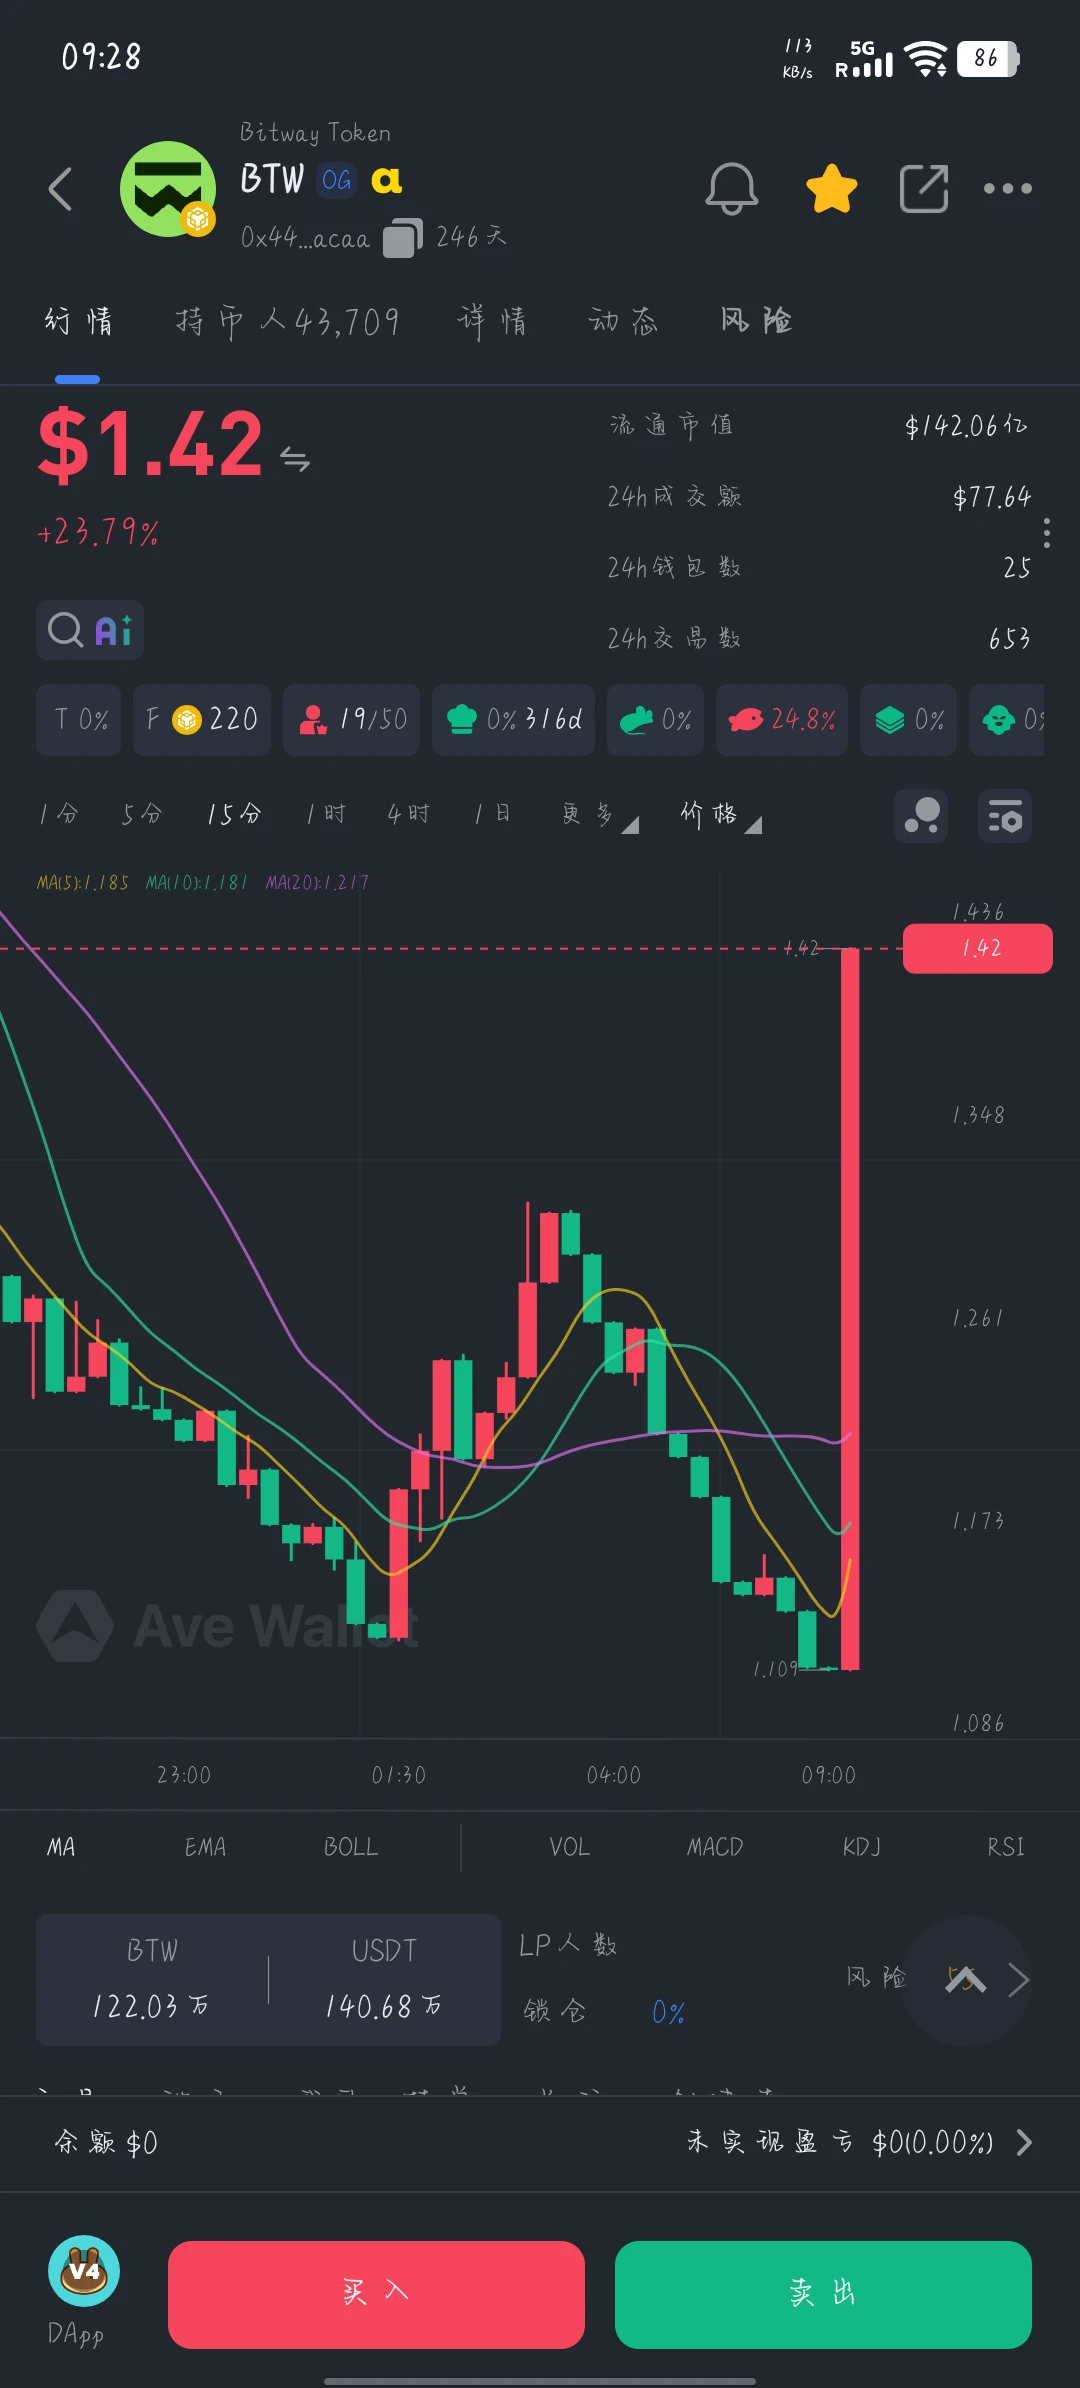
$BTW What is this supposed to mean? Spot has pumped hard, and this one isn't going up? Are these coins from two different worlds?????
post-image
BTW-7.42%
[NEWSTREAMER] market update
live-cover
LIVE1,270
  • 1
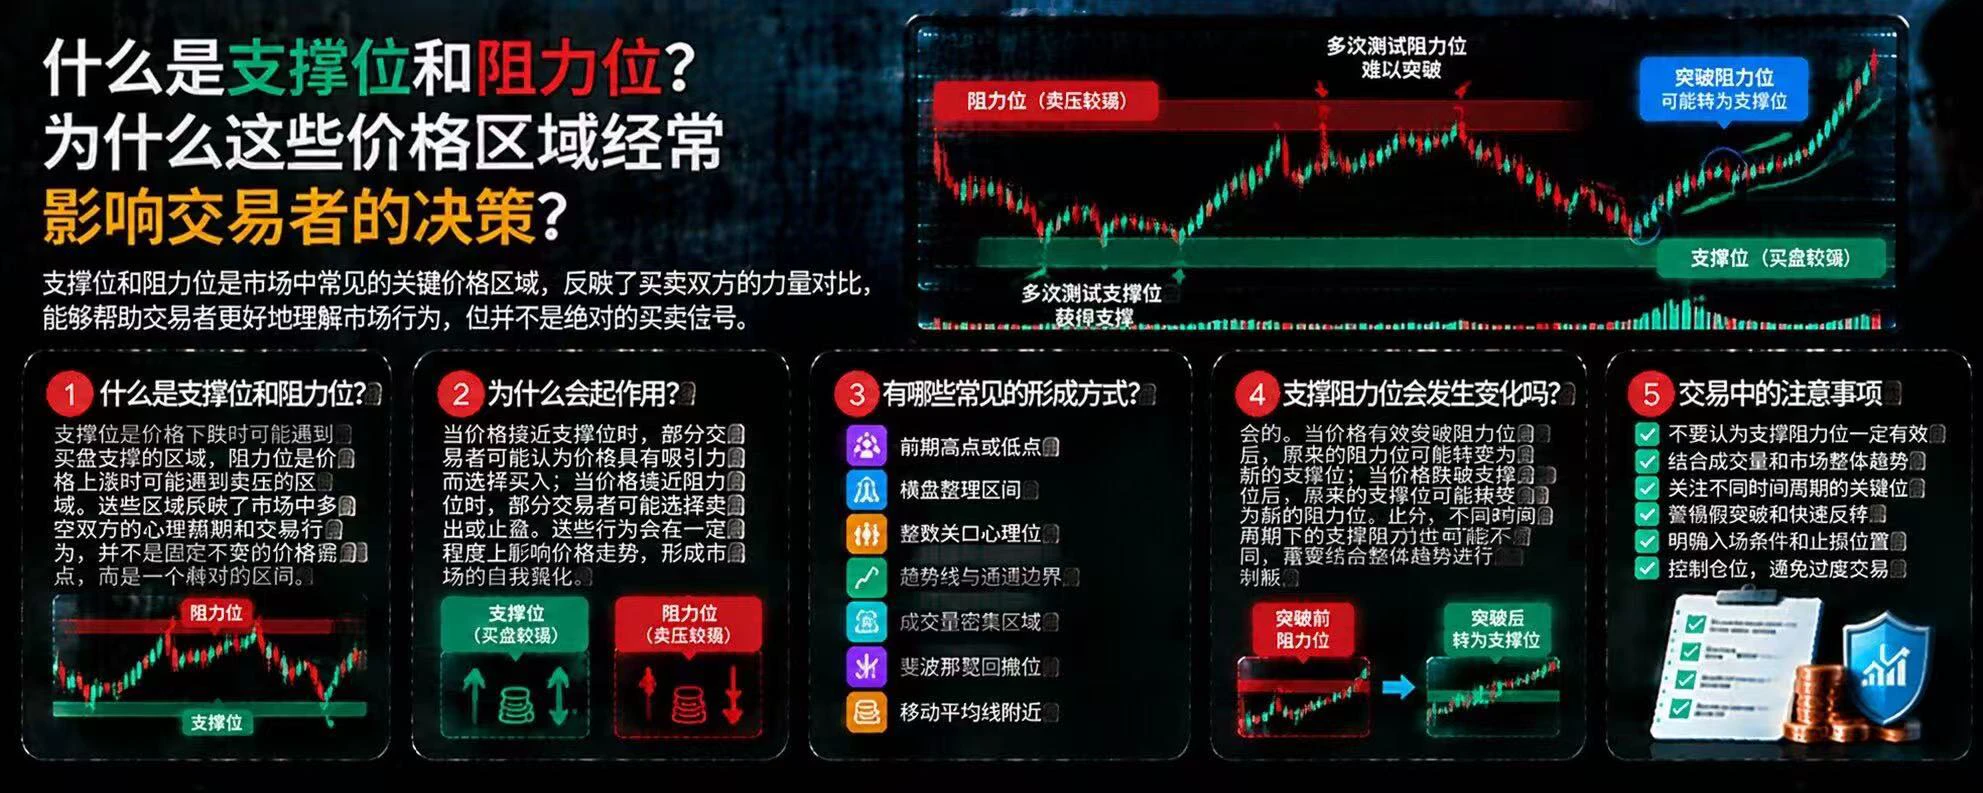
What Are Support and Resistance Levels? Why Do These Price Zones Often Influence Traders’ Decisions?
In crypto markets, prices do not fluctuate randomly. Certain zones repeatedly see buying or selling pressure, causing prices to temporarily stop falling or rising, or even reverse. These zones are commonly known as support and resistance levels, but they are not absolutely reliable price boundaries.
First, what is a support level?
A support level is a zone where strong buying may emerge as prices fall. When the price approaches this zone, some traders may consider it attractive and increase buy
post-image
Why Can Prices Continue to Fall Even When MACD Shows Bullish Divergence?
In the crypto market, MACD bullish divergence is often seen as a potential reversal signal, but many traders find that prices may continue to fall even after bullish divergence appears. This is because weakening momentum does not mean the downtrend is over.
First, what is MACD bullish divergence?
When prices keep making new lows while the MACD indicator’s lows gradually rise, bullish divergence may be forming. This means downward momentum may be weakening, but it does not prove that buyers have taken control.
Second, why
post-image
#HYPE
On-chain Detective | An entity transferred 912k HYPE to FalconX, expecting to make $8.03 million in profit
On October 31, EmberCN monitoring showed that about 2 hours ago, an entity address consolidated and transferred 912,383 HYPE (worth approximately $82.09 million) to institutional trading platform FalconX.
This HYPE was accumulated 1 to 2 months ago through Coinbase Prime and FalconX at an average cost of about $81. The current transfer price is about $90, with an expected profit of approximately $8.03 million.
HYPE+0.24%
Young man, don’t look down on humble beginnings; shallow waters can’t hold back a dragon.
I had just closed my weary eyes when my phone rang.
They were debt collection calls and messages, the people I care about pushing me forward, and the part of me that refuses to give up.
So I must not let up. But a good night’s sleep and a clear mind are what give me the strength to press on. #Gate廣場萬聖節
#每周来晒
$BTC ‌$ETH ‌$ZEC ‌
BTC-0.65%
ETH-1.23%
ZEC+1.29%
  • 10
Just my everyday life.
Don't be too envious.
post-image
#WCTCS9 #ShareWeekly
My positions for the weekend
Current technical data indicates that Bitcoin is under short-term selling pressure, with daily and weekly signals currently in conflict. I advise against chasing a recovery move until resistance levels are reclaimed.
Support 1 $76,200–$76,600 Initial support level
Support 2 $74,900–$75,200 Secondary support level
Support 3 $71,900–$73,700 Deeper decline zone
Resistance 1 $78,200–$78,600 First hurdle for a recovery
Resistance 2 $79,500–$80,000 Key resistance level
Resistance 3 $80,700–$82,000 Zone for a stronger breakout
Potential BTC trading
BTC-0.67%
XAUUSD-3.63%
AVGO-2.36%
NVDA-4.16%
MU-5.28%
  • 6
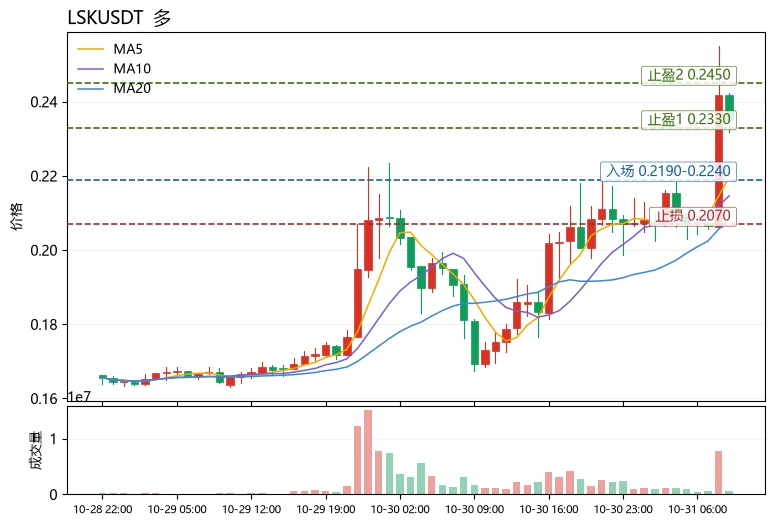
$LSK $LSK is currently at 0.2352. The upper Bollinger Band at 0.2333 has been breached, putting the price in a short-term overbought zone; MA5 at 0.2196 and MA20 at 0.2081 provide two levels of pullback support. The 24h range is approximately 37%, with volatility elevated, making the risk/reward for chasing longs unattractive.
Indicators show RSI at 69.7, nearing the 70 overbought threshold. The MACD histogram at +0.002167 remains bullish but is nearing the end of its acceleration phase. The funding rate is negative at -0.2225%, indicating shorts are paying and squeeze momentum remains, but als
post-image
LSK-5.32%
PARTI-1.06%
DOGE-0.22%
Major coins have split into two camps. BTC is still seesawing at low levels, with short-term price action somewhat under pressure; ETH, SOL, BCH, and XRP, however, are quietly recovering. This isn’t a broad-based warming, but a classic case of structural divergence—capital is rotating only into select areas. The sustainability of a rebound amid declining volume is questionable. Curious to hear how everyone is approaching this: wait for Bitcoin to stabilize before entering, or first look for relatively strong assets to trade in the rotation?
Market observations are for discussion and sharing on
post-image
BTC-0.67%
ETH-1.26%
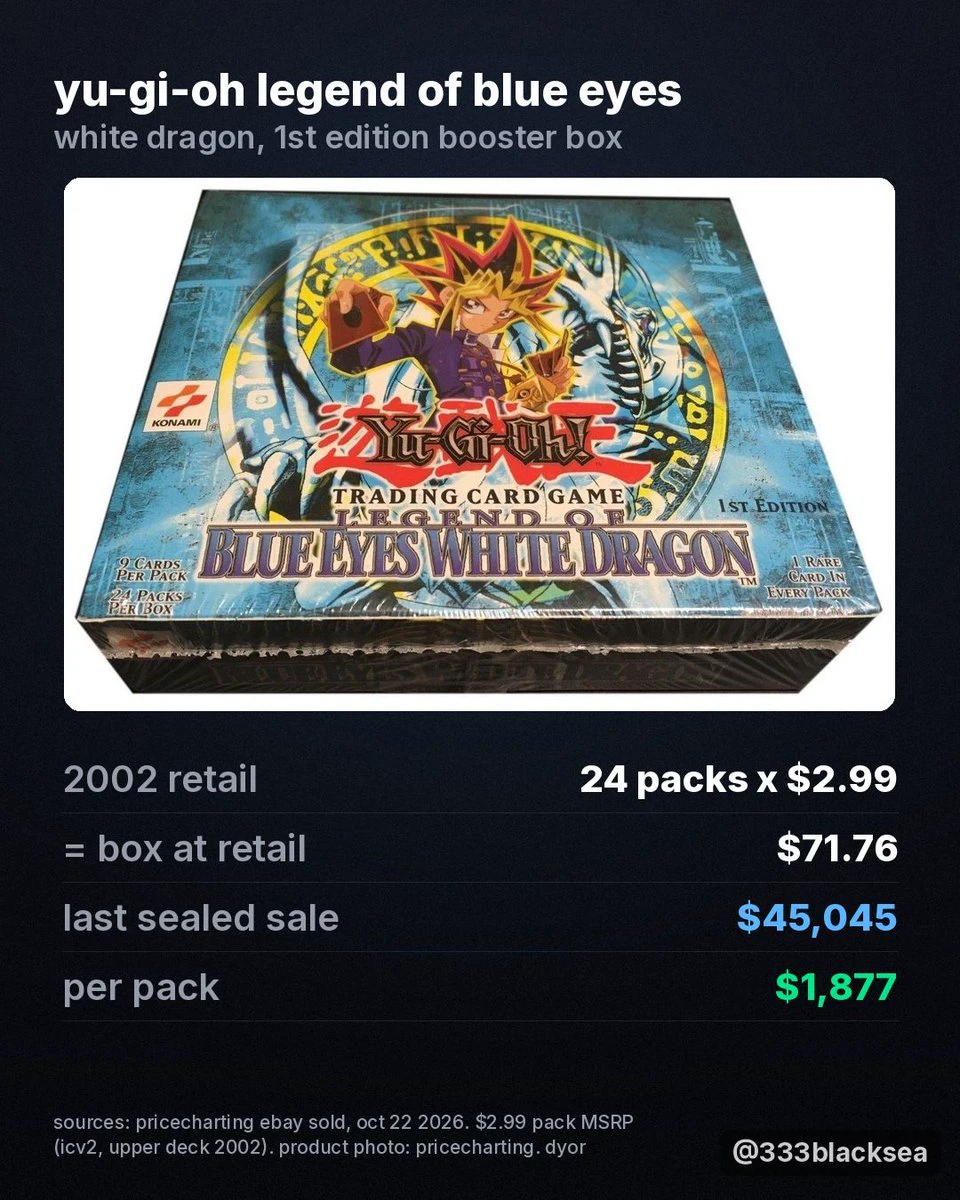
Yu-Gi-Oh Legend of Blue Eyes White Dragon, 1st Edition booster box.
2002 retail: 24 packs at $2.99.
Last sealed one sold for $45,045.
That's $1,877 a pack.
Would you open it?
post-image
Load More

Join 40 M users in our growing community

⚡️ Join 40 M users in the crypto craze discussion

💬 Engage with your favorite top creators

👍 See what interests you

Trending Topics

BTC大跌

195.25k Views39.52k Discussing

$BTC briefly fell below $77,000 and remains under pressure around the $77K zone, with its 24-hour decline still above 4%. With risk appetite weakening and Fed uncertainty rising, where is the next key support after losing $80K?

IntelBeatsEarningsButStockPlunges

13.91k Views737 Discussing

StrategySTRCNears100ParValue

17.57k Views4.03k Discussing

View More