

Share your thoughts
placeholder
Article
Everyone is sleeping on $LINK /USDT while the daily trend screams bullish and the 1h ATR hints at a massive move.

$LINK /USDT - LONG

Trade Plan:
Entry: 12.726 – 12.830
SL: 12.282
TP1: 13.150
TP2: 13.398
TP3: 13.770

Why this setup?
Why now? The 1D trend is firmly bullish, the 15m RSI sits at 41.78 showing room to run, and the 1h ATR of 0.206653 signals an explosive impulse is building. With the 1h price anchored at 12.778 inside the entry zone between 12.726 and 12.830, the setup targets TP1 at 13.150 and TP2 at 13.398, but the trade invalidates hard if the 1h price breaks below 11.785. T
LINK-2.35%
PROLOGUE This short position was opened quite casually. The average entry price is 0.011465, and the price has only dipped a tiny bit so far, moving very slowly. The position is very small, and the leverage is not high either—just testing the waters.
Small-cap tokens like this can surge fiercely and drop quickly, but they are even more frustrating when they grind sideways. After entering the position, it barely moved for half a day, and staring at the chart was making me sleepy.
I didn't think too much of it. I just saw that it started moving sideways after a rally, with volume also shrinking,
PROLOGUE+59.24%
hot Topics updates
live-cover
LIVE55
Everyone is about to find out what happens when SYMBOL breaks 88.061.

$HYPE /USDT - LONG

Trade Plan:
Entry: 85.245 – 85.679
SL: 83.383
TP1: 87.021
TP2: 88.061
TP3: 89.620

Why this setup?
Why now? The daily trend is bullish, setting the stage for continuation higher. The 1h price sitting at 85.462 aligns perfectly with the entry_ref, giving us a precise spot to initiate. The 15m RSI at 48.31 shows room to run without being overbought, while the 1h ATR of 0.866321 confirms enough volatility to reach TP1 at 87.021 and push toward TP2 at 88.061. The invalidation level at 83.595 is the line i
HYPE-2.87%
can't have nice things these days
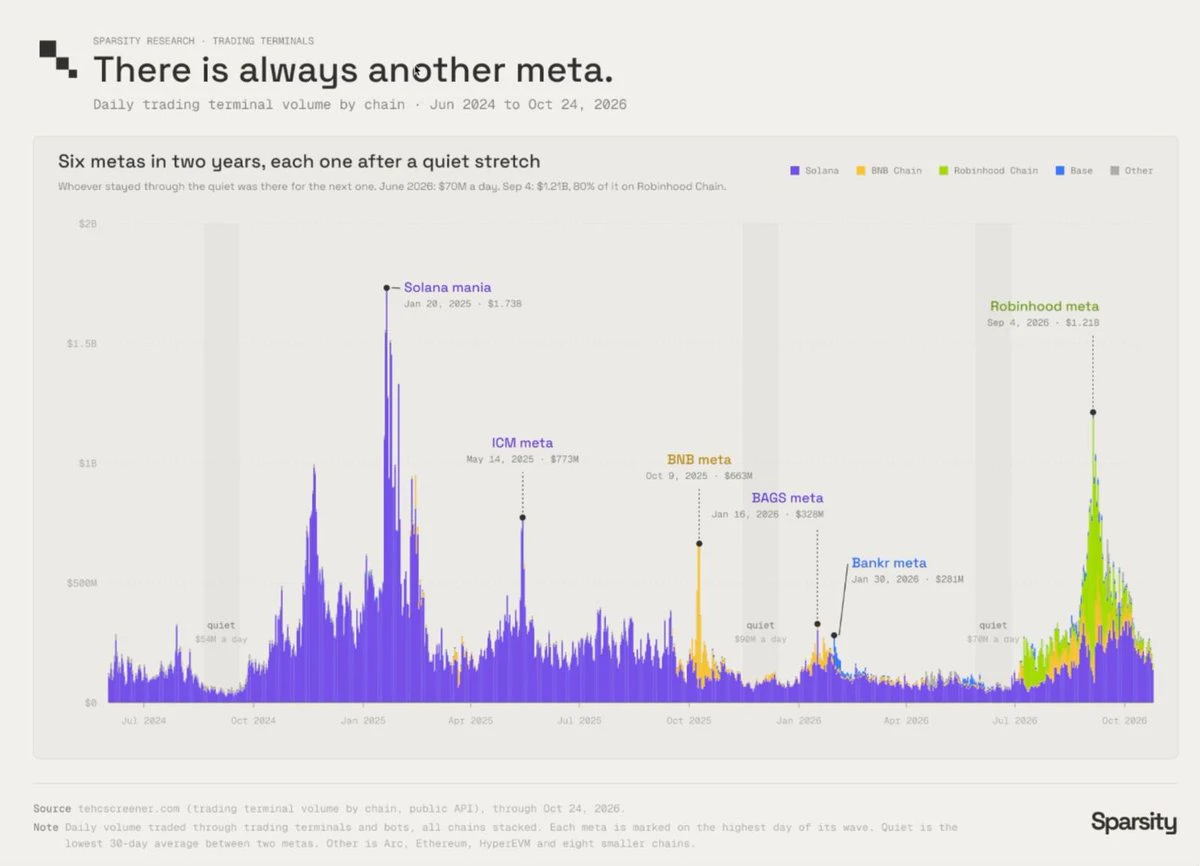
robinhood trenches taking over runescape accumulating every fucking hat on the market squeezing the price so they’re unobtainable.
the hat in game is literally called robinhood.
reddit going wild.
shit ton of speculation.
funniest fucking lore ive ever witnessed.
its going to be all over mainstream and your timelines within a matter of days, and its still sub 10m.
you’ve been warned.
post-image
I originally wanted to cut my losses and call it a day, but it turned around on its own and handed the meat back. A few days ago, staring at that bearish candle before bed, I really did feel like throwing in the towel. When I checked the chart this morning, the pullback to 610.90 hadn’t broken down at all—I realized I had almost sold at the bottom. $BNB surged to 739.45, +1492.99%, growing effortlessly.

To be honest, holding this trade hasn’t been comfortable; the back-and-forth swings were enough to make anyone lose their temper. But as long as the chart hasn’t broken down, I won’t scare m
post-image
BNB-1.77%
SNDK+0.35%
DOGE+0.22%
$ETH just closed above the 200W ma.
Good signal.
Bullish continuation could send $ETH to $3,000.
post-image
ETH-0.57%
This was purely the market being in a good mood—it casually tossed out some gold coins, and one just happened to hit me on the head💰
Seriously, after $SNXX pulled back from 12.700, that candlestick was exceptionally clean. While everyone was still watching from the sidelines, it had already reclaimed the key level. I said it while watching the chart: once it holds, stop questioning the direction.
Later, SNXX slowly ground up to 18.278, securing +865.44%. Friends who caught the rhythm should be treating themselves to a chicken leg right now🍗
Taking profits requires discipline: take profit on
post-image
SNXX+0.59%
SOL-1.91%
BNB-1.77%
While I was away using the restroom, I came back to find the candlestick chart had already wiped out my losses for me.
After lunch, I saw $MAGMA had returned to around 0.17163. It had bounced off that level several times without breaking through, and each key low was higher than the last, so I placed a long order. By the time I came back, the current price had reached 0.24465, with unrealized gains of +841.19%—the wait was worth it.
I took profit on 80% first and moved the stop-loss on the remaining 20% above the entry price. If it keeps charging, I’ll hold it; if it comes back, I won’t give t
post-image
MAGMA-4.27%
SNDK+0.35%
BTC-0.86%
Everyone watching SYMBOL long is about to get blindsided.

$SUI /USDT - SHORT

Trade Plan:
Entry: 0.8238 – 0.8310
SL: 0.8618
TP1: 0.8016
TP2: 0.7844
TP3: 0.7586

Why this setup?
Why now? The 1h price is sitting at 0.8274, right inside a tight entry zone of 0.8238 to 0.8310, which signals a clean spot to initiate a short. The 15m RSI reading of 57.06 shows the asset is neither overbought nor oversold, giving us room for a directional move rather than a random spike. The 1h ATR of 0.014325 confirms that volatility is compressed, meaning a breakout is overdue and likely to be sharp. With the d
post-image
SUI+2.15%
Is the daily range about to snap and send $ETH /USDT straight down?

$ETH /USDT - SHORT

Trade Plan:
Entry: 2490.03 – 2497.75
SL: 2530.98
TP1: 2466.08
TP2: 2447.53
TP3: 2419.72

Why this setup?


Debate:
Are we hitting 2447.53 or getting trapped at 2477.71?

⚠️ Personal market analysis only. NFA — manage risk and DYOR.
Educational content, not investment advice or a recommendation to buy, sell, deposit, or withdraw any asset. No paid promotion or referral/affiliate links.
ETH-0.60%
🚨 JUST IN: ripple:native futures activity surges to a six-month high as price volatility picks up.
Layout for Bitcoin, Ethereum, and Dogecoin
live-cover
LIVE1,451
A few days ago, I nervously removed the stop-loss. Looking at it today, it seems to have saved this short position.

When the market plunged intraday, $AAOI struggled to rebound, with clear resistance overhead, so I opened a short around 152.22. When I opened the chart this morning, the current price was already down to 109.68, with floating profit at +1344.89%. The sleepless nights paid off, and I got the rhythm right.

I’ve secured the bulk of the profit first: 80% closed, with the remaining 20% moved to breakeven protection. If the sell-off continues, let the profits run; if it rebounds,
post-image
AAOI+2.49%
LAB-2.08%
ADA+0.05%
$$IOST 40% gain hasn't caught up? Is it still worth chasing at the 0.0010 price level? When I was watching the market last night, it surged straight through from 0.0007, with $120 million in trading volume—not something retail traders could generate. This volume-driven rally is most likely major players rotating positions, but the 0.0010 round-number level happens to be a dense area of underwater positions from earlier, so if it fails to break through in the short term, it could become a meat grinder.
Scenario analysis: If it holds above 0.0011 over the next 4 hours, it could replicate the 30%
IOST+35.43%
I didn’t chase $UNI when it surged during the day. A long-term trendline was directly overhead, making it difficult to place a stop-loss properly if I entered. I waited for it to pull back and reclaim the level before entering a long in line with the lower-timeframe structure.
After entry, it consolidated for a while. I didn’t rush to trade back and forth. Once the price moved a certain distance away from my entry zone, I first closed 80% to lock in profits on the core position, leaving the remaining 20% to follow the trend.
After the breakout candle appeared, I took the +1045.55% position pro
post-image
UNI-2.38%
BTC-0.86%
LAB-2.08%
$FF broke through a few days ago, but I didn’t chase the move directly and only entered after waiting for a pullback confirmation. The core logic at the time was that, after breaking above a key level on heavy volume, price did not quickly fall back below it. Once that level was confirmed, there was an open area above. I placed a limit order to enter long, and the market moved relatively smoothly after entry, without any major pullback.

I took partial profits after the rally reached the first target, with roughly 70% of the position locked in at around +643.7%. For the remaining orders, I mo
post-image
FF+0.31%
SOL-1.91%
XRP-1.74%
With this price action, I don’t even need to think—the account is dancing on its own.
$ICP surged from 2.964 to 3.045, putting +131.7% in the bag. Don’t ask—if you do, the answer is that the market showed me some respect, not that I have three heads and six arms.
During the repeated intraday swings, many people were shaken out, but I stared at that lower shadow for a long time. It kept holding firm on every pullback, and every low-volume drop was caught by buyers. Nobody wanted to dump at this level. So I only said one thing at the time: Hold on, don’t scare yourself out.

I’ve now taken pro
post-image
ICP+14.12%
SNDK+0.35%
ETH-0.60%
Load More

Join 40 M users in our growing community

⚡️ Join 40 M users in the crypto craze discussion

💬 Engage with your favorite top creators

👍 See what interests you

View More