



#SK海力士财报不佳盘后下跌 Hynix’s earnings miss expectations — what’s truly “killed” isn’t performance, but valuation
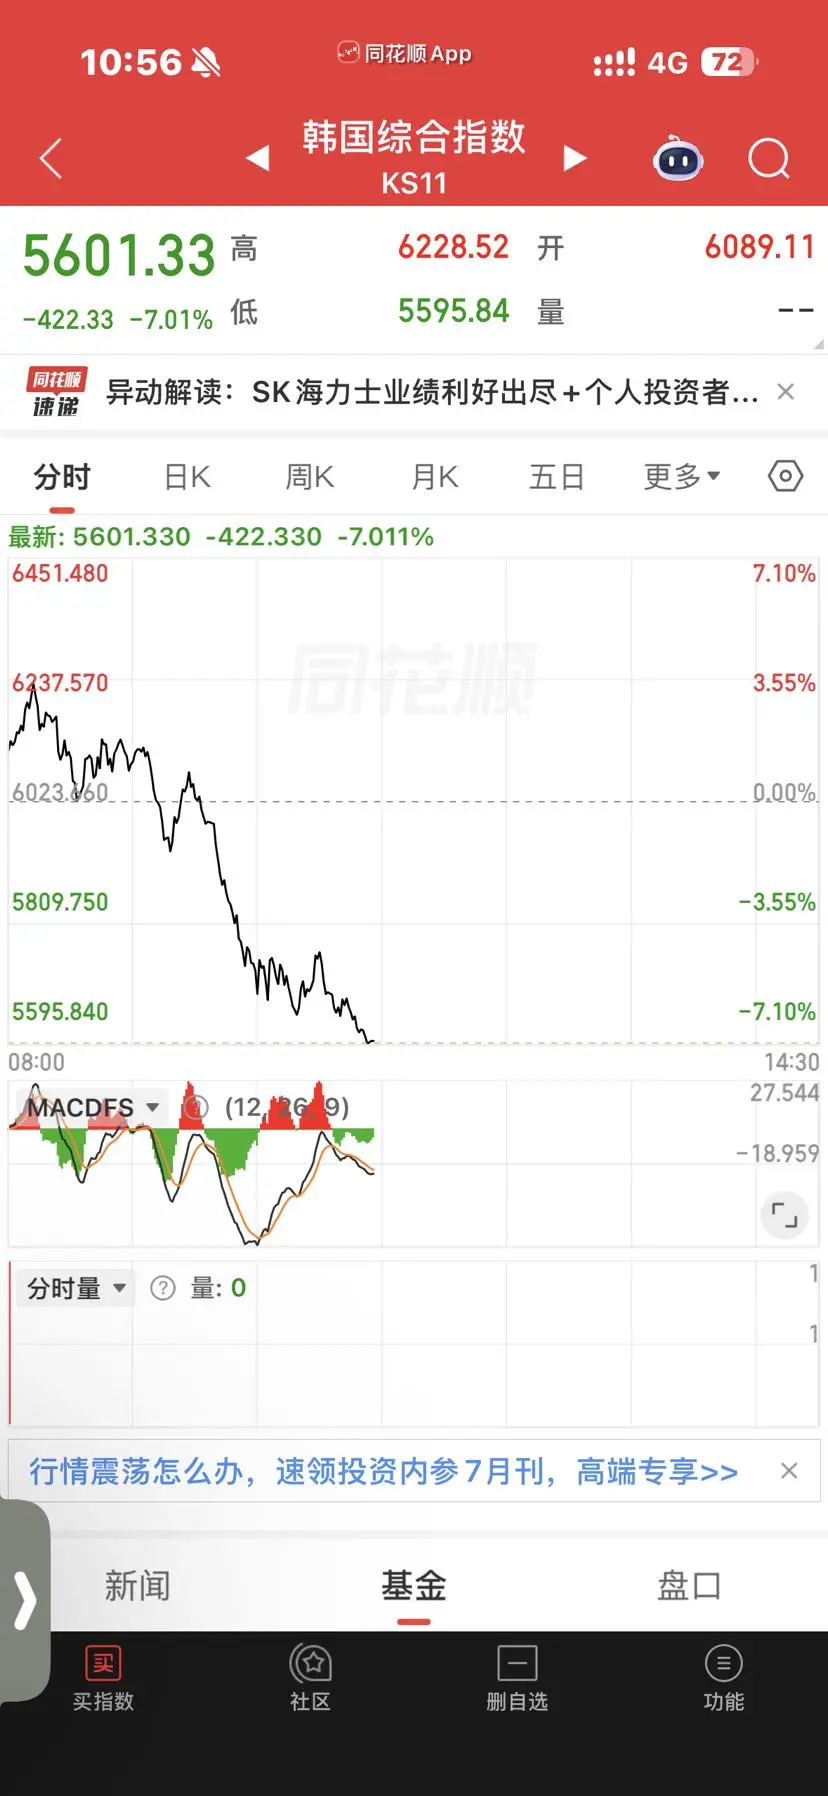
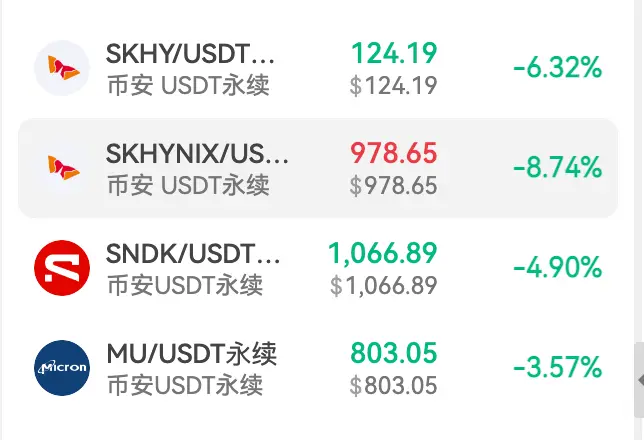
After SK Hynix released its earnings report, the market voted directly with its feet. Both revenue and operating profit fell below market expectations, causing Hynix to drop by more than 6% at one point after hours. Memory-related stocks such as Micron, SanDisk, and Western Digital all fell in unison, dragging down the entire semiconductor sector.
Is the AI trade over? Can Hynix still be bought? Why did the market react so strongly?
Many people find it strange: Hynix’s earning ability is clearly still strong, so why did the stock price fall so sharply?
There’s only one reason: the market was disappointed not with the results, but with the expectations.
Over the past year, AI-driven HBM demand has exploded, and Hynix became one of the world’s biggest beneficiaries. The stock price climbed steadily as the market continuously raised its profit expectations. So this time, it’s not that Hynix earned less—it’s that it didn’t earn as much as the market had hoped.
For growth stocks with high valuations, anything that doesn’t beat expectations is a negative.
Is the valuation still expensive now?
If we look two weeks ago, Hynix’s valuation was indeed on the high side. But over the past two weeks, Hynix has already gone through a round of clear valuation correction. The stock has pulled back significantly, and the market has already priced in a substantial amount of risk in advance. In other words: two weeks ago it was high growth + high valuation; now it looks more like high growth + valuation returning to a reasonable level. That means Hynix is no longer as expensive as before.
Has the bad news already been fully priced in?
It has been priced in for the most part, but it hasn’t completely ended.
The negative factors that have already been realized include: the earnings report coming in below market expectations; the valuation of the AI memory segment being re-priced; and short-term capital concentrating and exiting the trade. But what truly determines the next phase isn’t this earnings report—it’s the entire AI industry chain.
If the performance of companies like NVIDIA, Micron, and TSMC remains strong, and global tech giants continue to increase AI capital expenditures, the market is likely to think Hynix is merely an “adjustment” in valuation after earlier high expectations. Conversely, if more and more AI leaders start coming in below expectations, the market’s concern won’t be about just one company—it will shift to the entire AI industry chain entering a stage of downward revisions to profit expectations.
Is it suitable to bottom-fish now?
You can pay attention, but don’t rush into going all-in.
If you’re looking at AI development trends over the next one to three years, Hynix’s core competitive strengths haven’t changed. The real change is the market’s valuation. But because market sentiment is still weak, the stock may still be volatile in the short term—so it’s more suitable to build a position in batches rather than taking a single heavy position.
Previously, the market was trading the “AI story.” Now it’s starting to trade “AI earnings.”
So this selloff targets valuation more than logic. If the long-term AI trend doesn’t change, then every deep emotional-driven adjustment could be accumulating opportunities for the next leg of the rally. $SKHY
After SK Hynix released its earnings report, the market voted directly with its feet. Both revenue and operating profit fell below market expectations, causing Hynix to drop by more than 6% at one point after hours. Memory-related stocks such as Micron, SanDisk, and Western Digital all fell in unison, dragging down the entire semiconductor sector.
Is the AI trade over? Can Hynix still be bought? Why did the market react so strongly?
Many people find it strange: Hynix’s earning ability is clearly still strong, so why did the stock price fall so sharply?
There’s only one reason: the market was disappointed not with the results, but with the expectations.
Over the past year, AI-driven HBM demand has exploded, and Hynix became one of the world’s biggest beneficiaries. The stock price climbed steadily as the market continuously raised its profit expectations. So this time, it’s not that Hynix earned less—it’s that it didn’t earn as much as the market had hoped.
For growth stocks with high valuations, anything that doesn’t beat expectations is a negative.
Is the valuation still expensive now?
If we look two weeks ago, Hynix’s valuation was indeed on the high side. But over the past two weeks, Hynix has already gone through a round of clear valuation correction. The stock has pulled back significantly, and the market has already priced in a substantial amount of risk in advance. In other words: two weeks ago it was high growth + high valuation; now it looks more like high growth + valuation returning to a reasonable level. That means Hynix is no longer as expensive as before.
Has the bad news already been fully priced in?
It has been priced in for the most part, but it hasn’t completely ended.
The negative factors that have already been realized include: the earnings report coming in below market expectations; the valuation of the AI memory segment being re-priced; and short-term capital concentrating and exiting the trade. But what truly determines the next phase isn’t this earnings report—it’s the entire AI industry chain.
If the performance of companies like NVIDIA, Micron, and TSMC remains strong, and global tech giants continue to increase AI capital expenditures, the market is likely to think Hynix is merely an “adjustment” in valuation after earlier high expectations. Conversely, if more and more AI leaders start coming in below expectations, the market’s concern won’t be about just one company—it will shift to the entire AI industry chain entering a stage of downward revisions to profit expectations.
Is it suitable to bottom-fish now?
You can pay attention, but don’t rush into going all-in.
If you’re looking at AI development trends over the next one to three years, Hynix’s core competitive strengths haven’t changed. The real change is the market’s valuation. But because market sentiment is still weak, the stock may still be volatile in the short term—so it’s more suitable to build a position in batches rather than taking a single heavy position.
Previously, the market was trading the “AI story.” Now it’s starting to trade “AI earnings.”
So this selloff targets valuation more than logic. If the long-term AI trend doesn’t change, then every deep emotional-driven adjustment could be accumulating opportunities for the next leg of the rally. $SKHY