
Share your thoughts
placeholder
Article
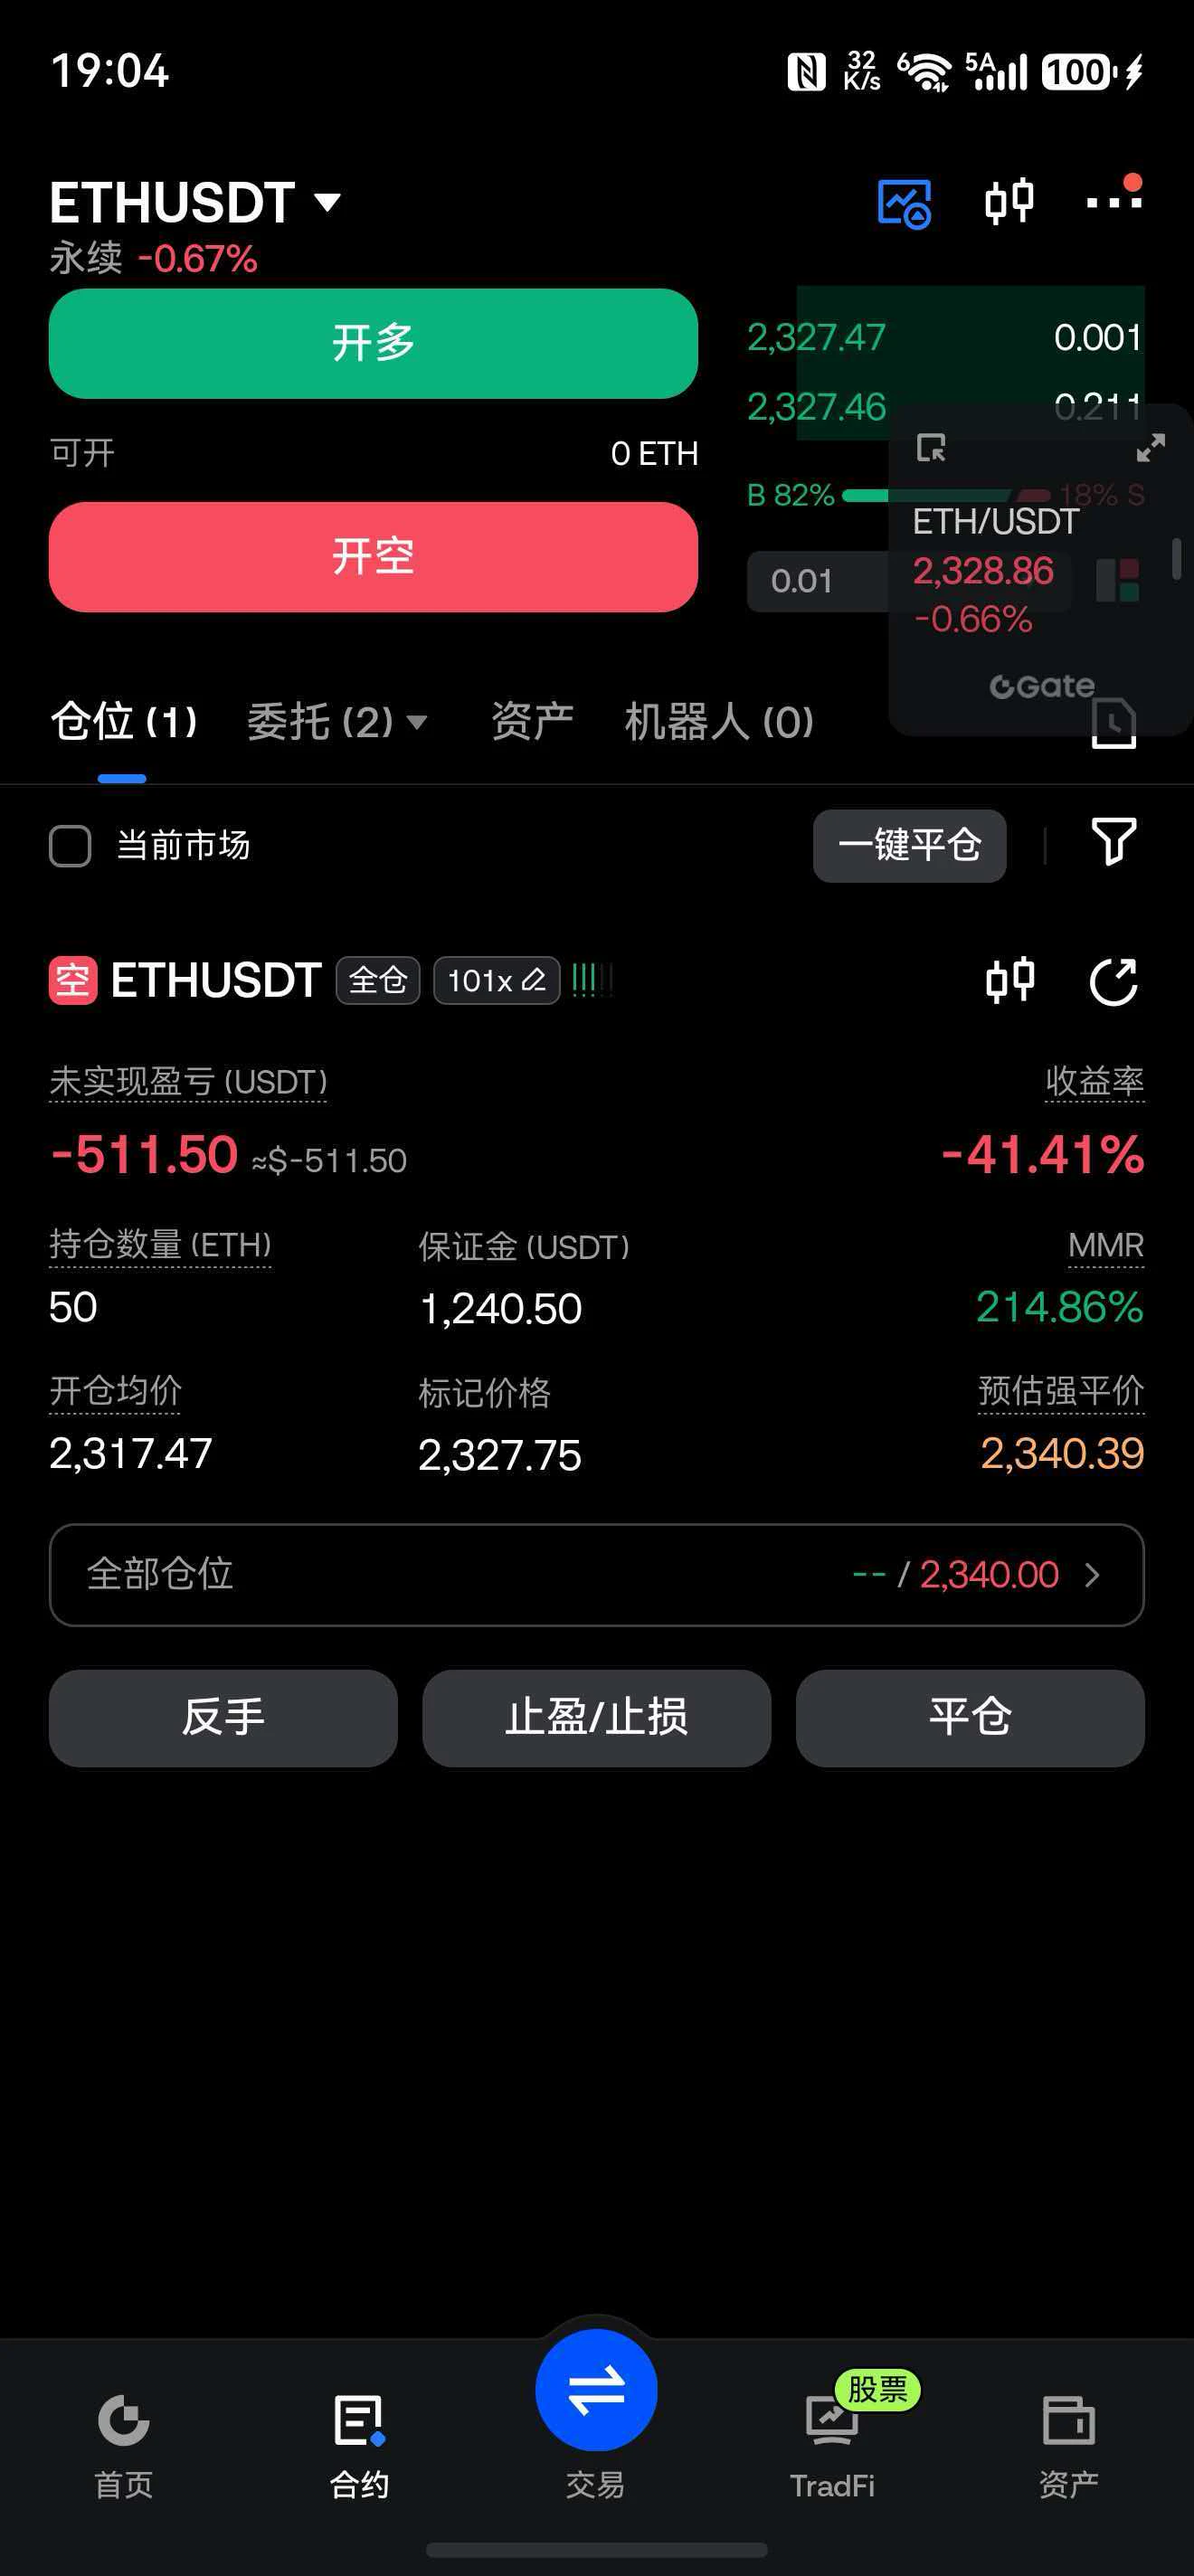
No vision, can't hold on—the profit on this move was paper-thin, but I absolutely loved it. After lunch, when I checked the charts, $HYPE /HYPE was putting on another fake pump. I took a glance at the sell orders, and they were stacked thick; the buying support was nowhere near enough. This kind of rise is just an opportunity to become exit liquidity. The price was right at 83.942, so I entered with a short bias, not expecting it to fall much. But then it slid straight to 80.542 in the afternoon, giving me an unrealized profit of +288.32%. It wasn't a huge haul, but this bite of profit felt inc
post-image
HYPE-0.49%
ADA-1.58%
BTC-0.04%
Why is everyone ignoring the HYPE setup that just printed a 95% confidence long?

$HYPE /USDT - LONG

Trade Plan:
Entry: 80.473 – 81.121
SL: 77.686
TP1: 83.130
TP2: 84.686
TP3: 87.019

Why this setup?


Debate:
Are we cleanly pushing toward TP2 at 84.686 or is 82.135 about to trap the longs?

⚠️ Personal market analysis only. NFA — manage risk and DYOR.
Educational content, not investment advice or a recommendation to buy, sell, deposit, or withdraw any asset. No paid promotion or referral/affiliate links.
HYPE-0.49%
🚨 JUST IN: Citi now expects Fed Chair Kevin Warsh and the Federal Reserve to raise interest rates next week.
Nobody is talking about this SYMBOL setup hiding in plain sight.

$BTC /USDT - LONG

Trade Plan:
Entry: 77136.20 – 77454.96
SL: 75765.55
TP1: 78443.10
TP2: 79208.11
TP3: 80355.63

Why this setup?
Why now? The daily trend is firmly bullish, setting the stage for a continuation move. The 1h ATR of 637.51 tells us volatility is expanding just enough to fuel a leg higher without blowing the entry zone wide open. With the 15m RSI sitting at 45.55, we are getting a pullback entry right at 77295.58, which aligns perfectly with the higher-timeframe trend. The first target is 78443.10, and a push to
BTC-0.04%
【$RAYSOL Signal】The 4H bullish structure remains intact, while a long position is being set up below the 1H middle band on the pullback
$RAYSOL The 1H Bollinger middle band at 1.6039 is capping the rebound, while volume across the latest three 1H candles has contracted to 3.3 million, with an order book bid/ask depth ratio of 0.70 and a thicker sell wall. The 4H MACD histogram at 0.0168 has started narrowing, while the 1H histogram at -0.0123 has turned negative and is expanding. The funding rate is 0.0050%, and OI is flat. The 4H RSI at 66.59 still has room before overbought, while the 1H RSI
post-image
BTC-0.05%
ETH+2.41%
SOL+1.98%
Nobody is talking about this $SKHY /USDT setup, but the numbers are screaming.

$SKHY /USDT - SHORT

Trade Plan:
Entry: 189.21 – 190.35
SL: 195.27
TP1: 185.66
TP2: 182.92
TP3: 178.80

Why this setup?
Why now? The 1h price sits at 189.78, right inside a tight entry zone between 189.21 and 190.35, giving us a precise short trigger. The 15m RSI reads 46.08, showing bearish momentum without being oversold, which means room to fall. The 1h ATR of 2.286499 confirms enough daily volatility to reach our first target at 185.66 and extend down to 182.92. The daily trend is range-bound, so we fade the
SKHY+0.79%
On this $BNB trade, I took profit near the target instead of chasing the final acceleration. Volume has clearly contracted, lowering the probability of another push higher; the biggest risk was watching unrealized gains go through another roller coaster ride.

Looking back at the entry logic: The price pulled back to the platform near 701.00, and the four-hour candle closed with a long lower wick, making the shift between bulls and bears fairly clear. I entered with a 30% position to test the waters and held after it stabilized.

During the rally, I originally planned to sell 70% first, but
post-image
BNB+1.20%
DOGE-0.08%
ZEC+2.14%
Everyone's sleeping on this SHORT setup while SYMBOL sits trapped in a range.

$LTC /USDT - SHORT

Trade Plan:
Entry: 53.43 – 53.75
SL: 55.12
TP1: 52.45
TP2: 51.68
TP3: 50.54

Why this setup?


Debate:
Are we getting a clean move to TP2 or will the range trap the shorts first?

⚠️ Personal market analysis only. NFA — manage risk and DYOR.
Educational content, not investment advice or a recommendation to buy, sell, deposit, or withdraw any asset. No paid promotion or referral/affiliate links.
LTC+1.24%
9.12 Today's Silk Road and Analysis
Yesterday at 20:30, affected by the CPI data, BTC and ETH suddenly plunged with sharp downside wicks, while U.S. Treasury yields rapidly surged. The market raised the probability of a Fed rate hike to nearly 90%; afterward, as the funds digested the sentiment, the market quickly recovered most of the losses, resulting in intense volatility that first dumped and then rallied. The market is tending toward stability over the weekend; trade in moderation to secure stable Lirun.
BTC $BTC
Trading advice: Go long on a pullback
Entry range: 768-770
Stop-loss defens
post-image
BTC-0.04%
ETH+2.47%
Most traders will ignore this setup while SYMBOL quietly stacks gains.

$SOL /USDT - LONG

Trade Plan:
Entry: 101.83 – 102.49
SL: 98.99
TP1: 104.53
TP2: 106.12
TP3: 108.49

Why this setup?
Why now? The daily trend is bullish and the 4h bias is LONG with 95% confidence, which means the higher-timeframe structure is already aligned for upside. The 1h ATR of 1.319205 shows that volatility is steady enough to fuel a clean move rather than a chop. The 15m RSI at 50.11 indicates the short-term momentum is neutral to slightly bullish, leaving room for acceleration without being overextended. With
SOL+2.00%
I just hit refresh, and it shot up, like I had scared it.

When the screen was glowing green, everyone else was running. $TAG faced obvious overhead resistance, with sell orders stacked layer upon layer. I said to wait for a rebound before adding.

Entered at 0.0010303, now at 0.0006729, +683.78%. The timing was right, and this bite of meat tastes great.

Take profits first: close 80%, and move the remaining 20% to the entry price for protection. Don’t get greedy for the last bite.

Hold as long as the trend remains intact; run if it breaks down. Don’t fall in love with the market. This i
post-image
TAG+12.32%
SNDK-3.43%
LAB+79.22%
Everyone chasing the bounce while DOGE quietly sets up for another drop.

$DOGE /USDT - SHORT

Trade Plan:
Entry: 0.08426 – 0.08484
SL: 0.08730
TP1: 0.08249
TP2: 0.08111
TP3: 0.07904

Why this setup?
Why now? The 1h price sits at 0.08455 inside a tight range, and the 15m RSI reading of 47.86 shows balanced but slightly bearish momentum that favors sellers. The 1h ATR of 0.001147 tells us volatility is compressed, so a break from the entry zone between 0.08426 and 0.08484 could accelerate fast. With the daily trend stuck in a range, the first target sits at 0.08249 and the second lies at 0.0
DOGE-0.08%
Which #Memecoin Will Dominat in 2026 🤔💯
$PENGU

$WKC
$DOG
$PONKE
$BARSIK
$TROLL
What I'm Missing ?
post-image
MEME+1.50%
PENGU-3.55%
WKC-5.71%
PONKE+7.01%
BARSIK-3.14%
This move doesn’t even require me to think—the account is dancing on its own.

When I checked the charts after lunch, I found $BTW still grinding around 0.377246. There were more bearish candles, but it simply couldn’t break lower. That wasn’t weakness; it looked more like funds quietly entering and changing hands. The chart hadn’t broken down, and buying pressure was strengthening. I wouldn’t misread this kind of bottoming structure, so I opened a long position as planned. Then a single candlestick pushed it to 0.4996, securing +321.93%—feels great, brothers 💪

Don’t get greedy with your
post-image
BTW+0.42%
ETH+2.47%
BTC-0.04%
today live markets informations
live-cover
LIVE436
What is your top #Altcoin pick right now ⁉️
And which #Memecoin are you betting on next 🚀
👇👇👇
post-image
MEME+1.50%
MEMECOIN-9.53%
Why is everyone ignoring the short setup forming on SKHYNIX right now?

$SKHYNIX /USDT - SHORT

Trade Plan:
Entry: 1362.21 – 1369.21
SL: 1399.35
TP1: 1340.48
TP2: 1323.66
TP3: 1298.43

Why this setup?
Why now? The daily trend is range-bound, which means the market is coiling for a directional move and the 1h ATR of 14.016604 signals that the next burst of volatility could be substantial. The 15m RSI sitting at 48.31 shows the asset is not overbought, so a short entry at the 1h price of 1365.71 is valid. The target zones are TP1 at 1340.48 and TP2 at 1323.66, offering a clear risk-reward pat
SKHYNIX+1.63%
$BTC Signal】1H middle band under pressure; short-sell accumulation zone
$BTC Order book buy orders have piled up to 5.59x, while the price is stuck at 77400, grinding sideways. The 4H MACD histogram at 0.87 has just turned positive, while the 1H histogram at -12.6 is deepening in the opposite direction, with momentum across the two timeframes pulling against each other.
The 1H RSI at 48.77 remains below the midpoint, while the 4H RSI at 43.17 is weaker. The Bollinger middle band at 77871 is capping the upside, while the 4H lower band at 76347 remains exposed below. The funding rate is 0.0013%
post-image
BTC-0.04%
$GIGGLE rebounded to around 37.21 but faced continued pressure and failed to hold, so I added a second short position. Since it cannot break the previous high, I’ll treat it as a key level for now, with rebound shorts remaining the primary strategy.

After entry, the price consolidated for a while and even briefly spiked upward. I did not rush to close the position because the short-term moving averages were still pressing downward. As long as there was no solid candle close above the entry range, I treated the spike as a shakeout.

After breaking below the lower boundary of the range, the m
post-image
GIGGLE+0.32%
BTC-0.04%
SNDK-3.43%
Load More

Join 40 M users in our growing community

⚡️ Join 40 M users in the crypto craze discussion

💬 Engage with your favorite top creators

👍 See what interests you

View More