Share your thoughts
placeholder
Article
$ZAMA Current price 0.08343, 24h +11.29%, trading volume 50.0M USDT, funding rate +0.0050%, Fear & Greed Index 71 (Greed). The price has moved above MA5 (0.08287) but remains capped by MA20 (0.0831535); RSI 55.5 is neutral to bullish, the MACD histogram at -0.000905 remains negative, the Bollinger range is 0.077758–0.088549, and the amplitude over 30 candles is as high as 39.02%. The data is clear: this is a funding-driven rebound, but the bulls have not yet completed their takeover of the moving-average structure.
On the funding side, the positive rate indicates that perpetual-contract longs
post-image
ZAMA+11.99%
EPIC+8.14%
FET-7.32%
$ONG – Buyers are quietly regaining control 📈
Buy $ONGEntry: 0.087 – 0.088Stop Loss (SL): 0.080Take Profit (TP): 0.093 - 0.099 - 0.11After the latest weakness, ONG is still holding its ground, with demand beginning to emerge near the current support zone. The price action is gradually becoming more constructive, and sustained buying could allow this bottoming pattern to develop into a stronger upward continuation. Disclaimer: "This is only my personal opinion, does not constitute investment advice, and is not intended for the Vietnamese people."
post-image
ONG+12.64%
An L2 chain collected $4.5 million in fees in one day, while paying Ethereum $398 for settlement.
Bitquery data shows that Robinhood Chain charged users approximately $4.5 million on September 3, while the total cost of publishing data to Ethereum and submitting proofs during the same period was approximately $398. Data availability was provided by Ethereum.
Costs being compressed to this level shows that the value of this chain mainly accrues to its own cashier, rather than the settlement layer. The other side must also be understood clearly: cheap settlement often comes with concentrated arb
post-image
ETH-2.38%
The weather is gradually getting cooler, so it’s time to say goodbye to miniskirts!
post-image
  • 5
Insiders are quietly pressing short on $DOGE /USDT while the crowd chases pumps.

$DOGE /USDT - SHORT

Trade Plan:
Entry: 0.08471 – 0.08519
SL: 0.08726
TP1: 0.08322
TP2: 0.08207
TP3: 0.08034

Why this setup?
Why now? The 4h trend is range-bound, giving short sellers a defined arena, the 15m RSI sits at 34.29 signaling room for further downside, and the 1h ATR of 0.000961 confirms enough volatility to reach targets. The entry zone between 0.08471 and 0.08519 aligns with the 1h price of 0.08496, placing TP1 at 0.08322 and TP2 at 0.08207 within a realistic move. This sets the invalidation leve
DOGE-2.93%
Everyone is about to wake up to $ENA /USDT while the smart money already booked their entries.

$ENA /USDT - LONG

Trade Plan:
Entry: 0.20585 – 0.20943
SL: 0.19046
TP1: 0.22053
TP2: 0.22912
TP3: 0.24200

Why this setup?
Why now? The daily trend is bullish and the 4h setup is armed with 95 confidence, so the market structure is clearly tilting upward. The 1h ATR of 0.007159 tells us volatility is compressed enough for a sharp expansion once the move starts. The 15m RSI at 68.28 shows momentum is strong but not yet overextended, leaving room for another leg up. Entry sits at 0.20764, targetin
ENA+4.64%

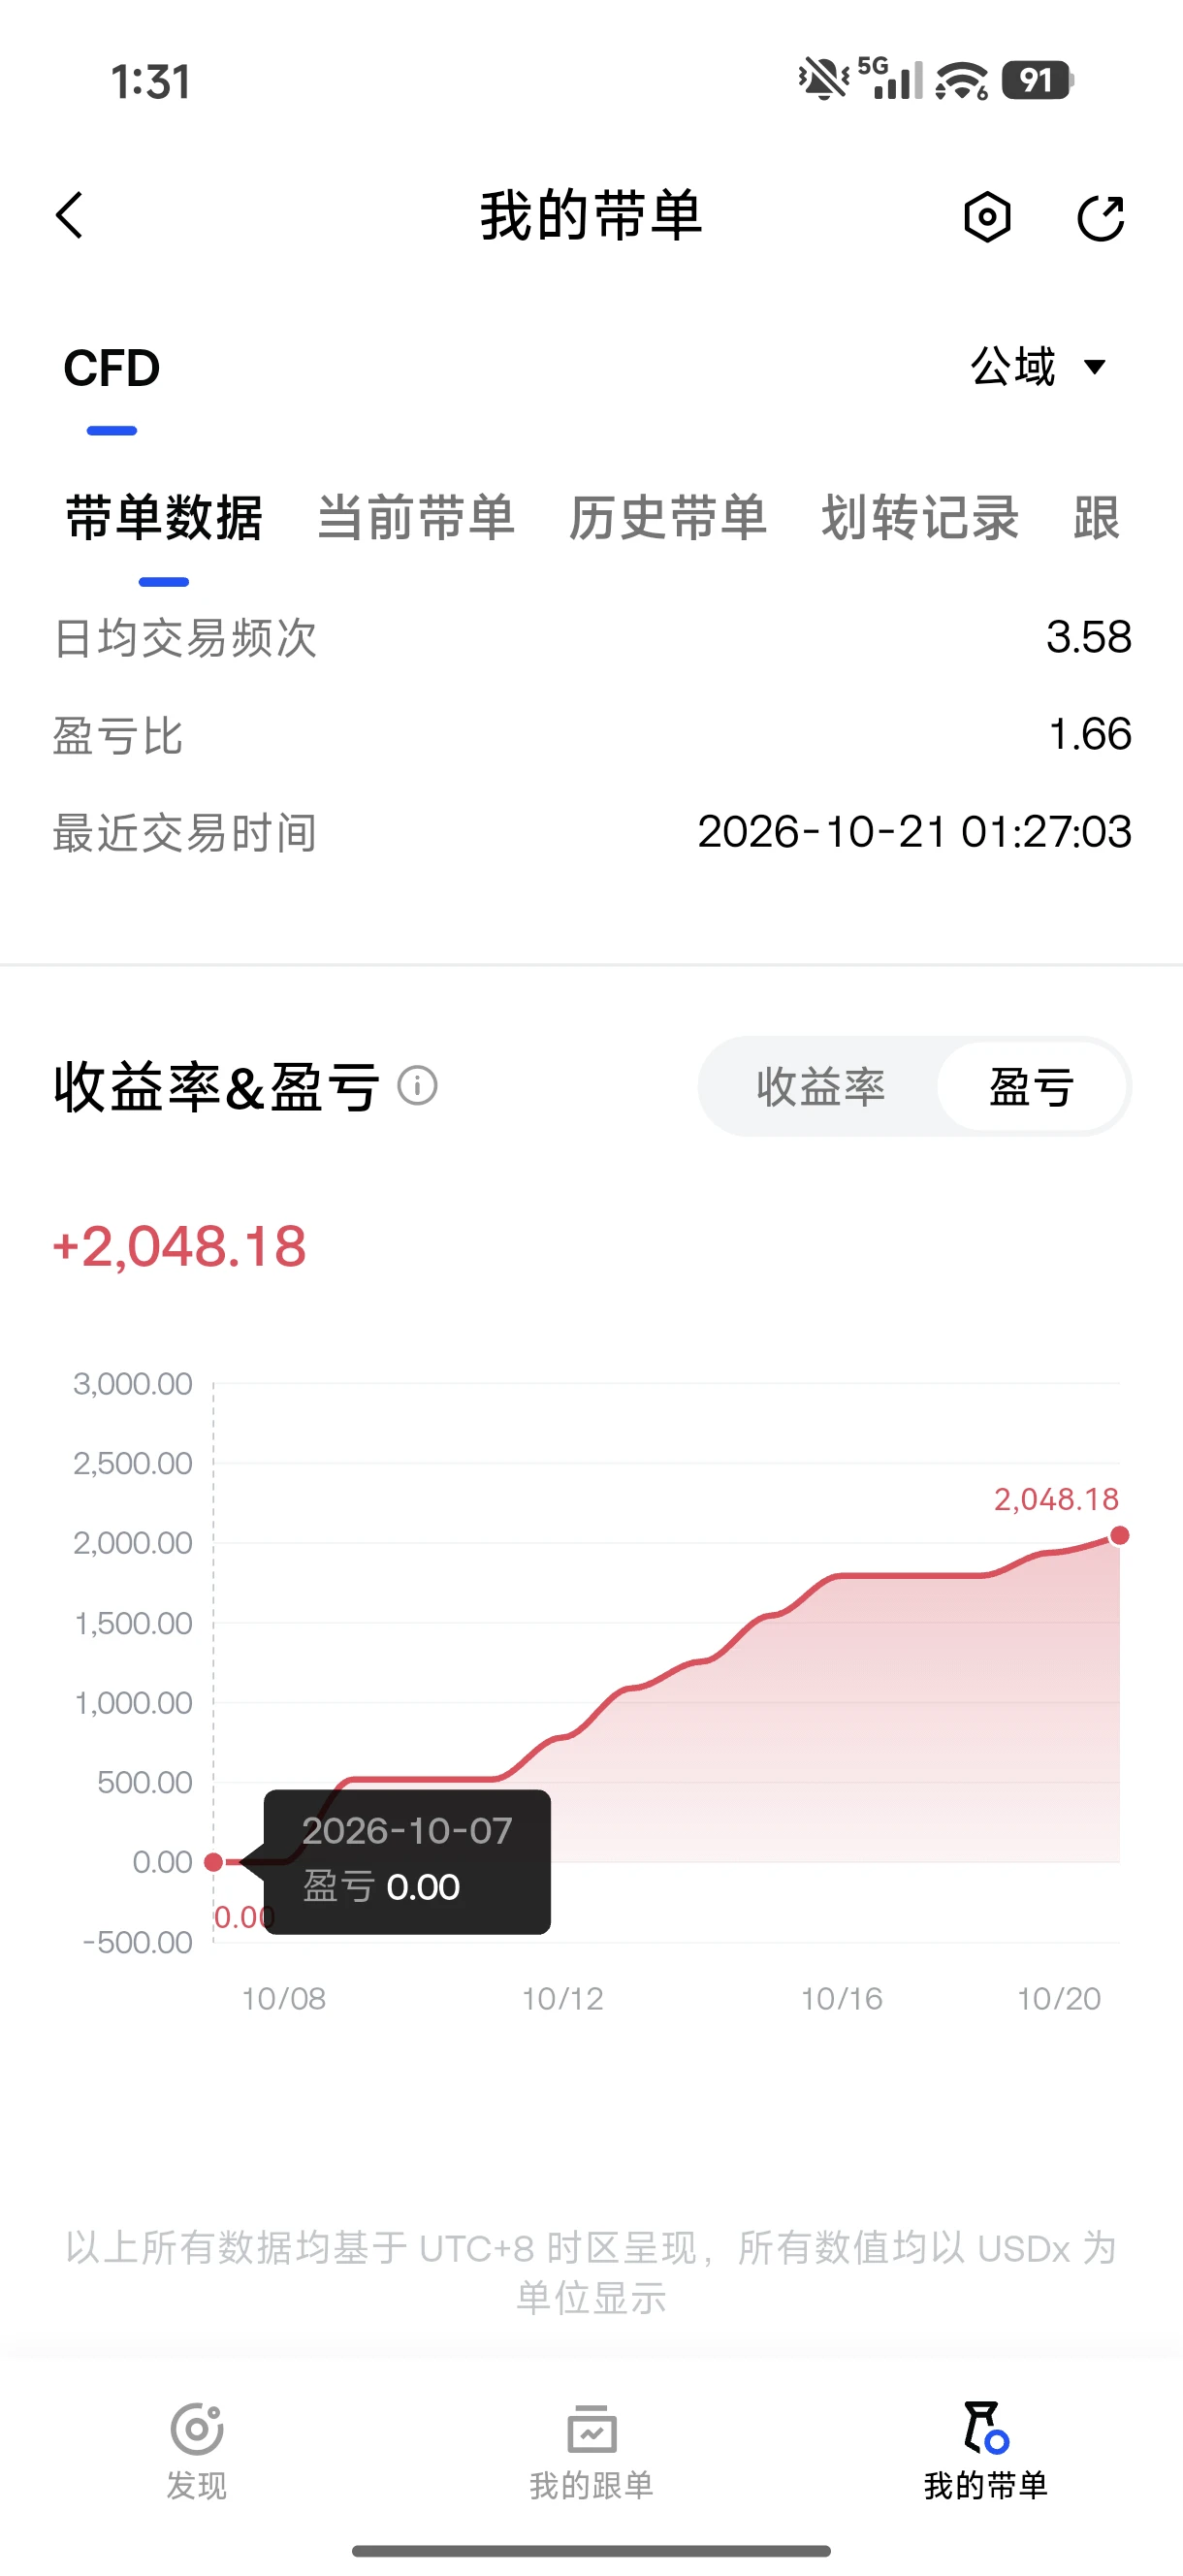

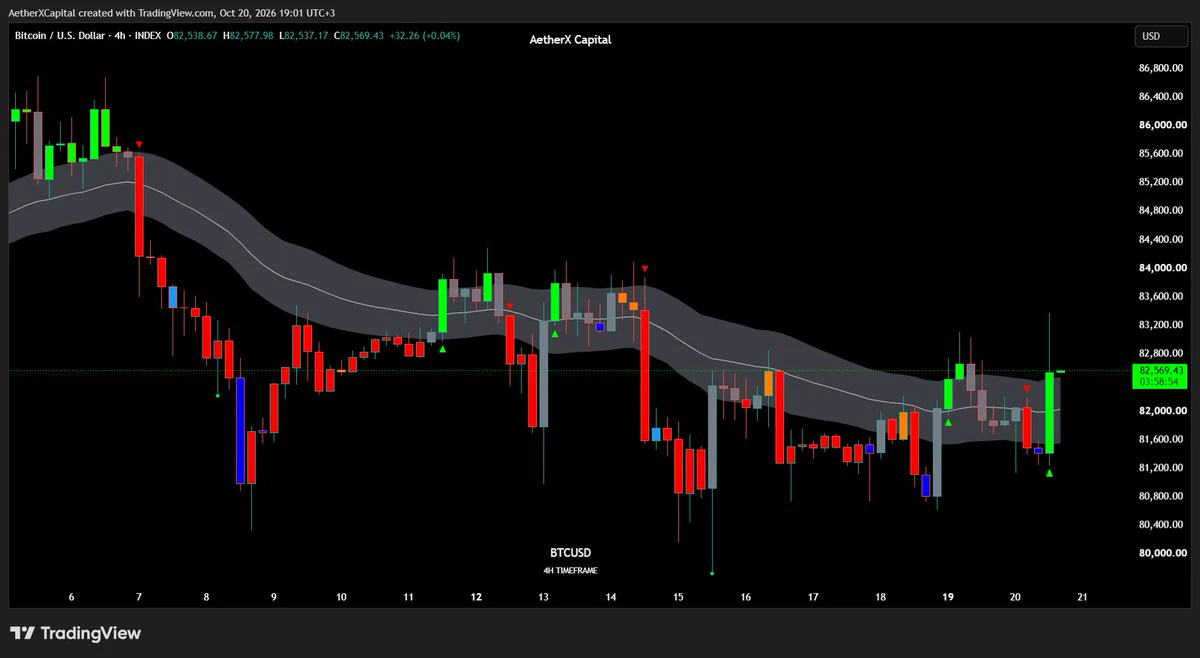
Another round of choppy consolidation! At this level, I would choose to continue shorting! I told you before, this is a cyclical issue—the distance from the high to the low has only been 9 months!
You can look at BTC’s April-interval candlesticks and weekly chart; around 82,000, trading volume was directly cut in half.
There is still one final major drop ahead! So I won’t go with the flow and chase longs! I don’t think the time has come yet! I’ll choose to trust the bears to make one more push and go straight in!
Short-term target: 78500! Long-term target: 75800! #MSTR领涨纳指100 #BTC重回80K $BTC
BTC-1.05%
  • 3
3/7/30-day exchange secondary-market token inflow and outflow data is now available
This time, the number of tokens displayed for each period has been increased from 20 to 40, giving everyone more comprehensive data,
The fourth image shows tokens newly issued over the past 7 days; just avoid the ones you know are newly issued
$AVAX I’ve broken even. Did anyone manage to buy my bottom?
post-image
AVAX+9.05%
🚀 $龙虾 /USDT Technical Breakdown: Macro Expansion vs. Local Consolidation – Is $0.286 Next?
📊 Market Overview & Performance
Trading Pair: 龙虾/USDT (Spot 6x)
Current Trading Level:
~$0.2315 – $0.2336
24h Change:
+12.8% to +13.7%
24h High / Low:
$0.236280 / $0.202710
24h Trading Volume:
~30.95M 龙虾 ($7.02M USDT Turnover)
📈 Multi-Timeframe Technical Breakdown
1. Daily (1D) View – Dominant Macro Rally
Macro Trend: 龙虾 has executed a massive parabolic run, expanding from the base level
CryptoSquard
🦞 Lobster/USDT (龙虾) Market Breakdown: Riding the Momentum Wave! 🚀
The Chinese Meme sector is heating up, and Lobster (龙虾) is currently catching major waves across multiple timeframes on Gate.io! With a stellar 28.50%+ surge and heavy trading volume pouring in, let's break down the technical outlook to see where this asset is heading next.
📊 Key Market Statistics (Perp & Spot)
Last Price: $0.1759
24h Change: +28.69% 🟢
24h High / Low: $0.1842 / $0.1347
24h Volume (Lobster): 132.68M
Turnover (USDT): 23.34M
📈 Technical Chart Analysis
1-Hour Chart Momentum:
After consolidating near support, Lobster bounced aggressively. Moving averages (MA5, MA10, and MA30) show a bullish alignment, with the short-term averages trending steeply upwards.
The MACD histogram indicates sustained buying pressure following a recent 15-minute spike of over 8%.
4-Hour & Daily Breakout Structure:
Zooming out reveals an impressive macro recovery from its lows near $0.036 and $0.013. The daily chart displays a powerful impulse wave breaking past previous resistance zones, aiming toward a retest of the local high at $0.19428.
💡 Trader's Outlook & Strategy
Support Zones to Watch:
Keep an eye on the $0.156 - $0.164 range (aligned with short-term MA lines) for any healthy retracements.
Resistance Targets:
The immediate psychological and technical hurdle sits at $0.184 (24h high) followed by a push toward the $0.194 breakout level.
Risk Management:
High-momentum meme coins experience sharp volatility. Always manage your position size and set strict stop-losses to protect profits.
Are you holding Lobster in your portfolio, or waiting for a dip to jump in? Let's discuss your targets below! 💬
#GateMeme #Lobster #龙虾
#GateSquareMidAutumnReunion
$龙虾 ‌ ‌
repost-content-media
龙虾+8.83%
  • 7
  • 1
GM if I would delete my profile and start off fresh without a face, would you recognize me by my voice and content?
post-image
Guess the name of this beautiful company
#NFA
post-image
At an ATM in Mexico, a “cash withdrawal insurance” option popped up: for 33 pesos, you can get coverage for cash stolen within 3 hours.
I have mixed feelings—I’ve never seen such a thoughtful service anywhere else in the world.
post-image
People across the internet have just started searching for STRK; it has surged 60% in a week, with volume at 4.6x the monthly average
$STRK is trending on CoinGecko’s hot searches, up 60% in a week—RSI 76.7 indicates overbought conditions! I’m not chasing here; there’s only one play: buy the dip.

Current price: 0.04463, 24h +3.8%—the hot-search ranking is a result of the rise, not a reason for it.

Bullish logic: real volume (24h trading volume of 22.06 million, 4.66x the monthly average); leverage is not crowded (funding rate 0.005%, neutral; OI of 328 million tokens, up just 1.75%); st
STRK+4.40%
The call is $100k.
The work is surviving $83k.90% trade the headline.
10% trade the wall. Which side prints?
BTC and ETH Face Fresh Monthly Momentum, Could Trading Volumes Support Further Gains?
live-cover
LIVE683
$AKE
Who could have known that buying at the absolute bottom could bring gains of several hundredfold, nearly 1,000x?
Tenfold and hundredfold coins appear almost every month.
How many people actually held on?
Almost no one. Altcoin manipulation is severe.
Yet the market is fair after all……
post-image
AKE+61.49%
#MSTR领涨纳指100 #Gate广场中秋团圆局 MSTR leads the Nasdaq 100: How long can this rally last?

The essence of this rally is “a leveraged amplifier of Bitcoin’s rebound + premium recovery,” not the restart of a new financing flywheel. So how long it lasts depends first on Bitcoin’s direction, and second on three MSTR-specific signals. Based on current signals, it can follow Bitcoin higher for a while, but this is a highly volatile rebound and should not be treated as the start of a trend.

Why it is rising (three drivers)
1. Bitcoin’s rebound is the master switch: On September 18, BTC rebounded from $7
BTC-1.05%
  • 2
  • 1
Load More

Join 40 M users in our growing community

⚡️ Join 40 M users in the crypto craze discussion

💬 Engage with your favorite top creators

👍 See what interests you

Trending Topics

MSTRTopsNasdaq100

73.6k Views2.81k Discussing

Strategy (MSTR) has gained about 48% over the past month, making it the best-performing stock in the Nasdaq 100, while Bitcoin rose roughly 12% over the same period. The company holds 845,050 BTC with a cumulative cost basis of about $63.73B. MSTR is not a pure Bitcoin proxy — its price swings can be more extreme. Can this rally last?

Gate Tops 24H Net Inflows Among Exchanges

26.29k Views3.67k Discussing

BTCRetakes80K

56.36k Views60.2k Discussing

View More