Square
Following
Hot
News
Profile
Share your thoughts
placeholder
Article
🚨 BTCSOS just picked up a new signal
Source: Trader Gauls Direction: $ZEC Long entry: 1210 Stop-loss: 1175 Target: 1408
I’m just relaying the signal. Whether to follow it and how large a position to take is up to you. The stop-loss is there to protect you—don’t manually delete it later and leave only the take-profit.
Come to think of it, I relayed a $ENA trade from Trader Gauls just 2 days ago (10-26), and now the channel is off again. Shared as a personal record, not investment advice. #DTCC Securities Tokenization Service officially launches
ZEC+1.16%
ENA+8.04%
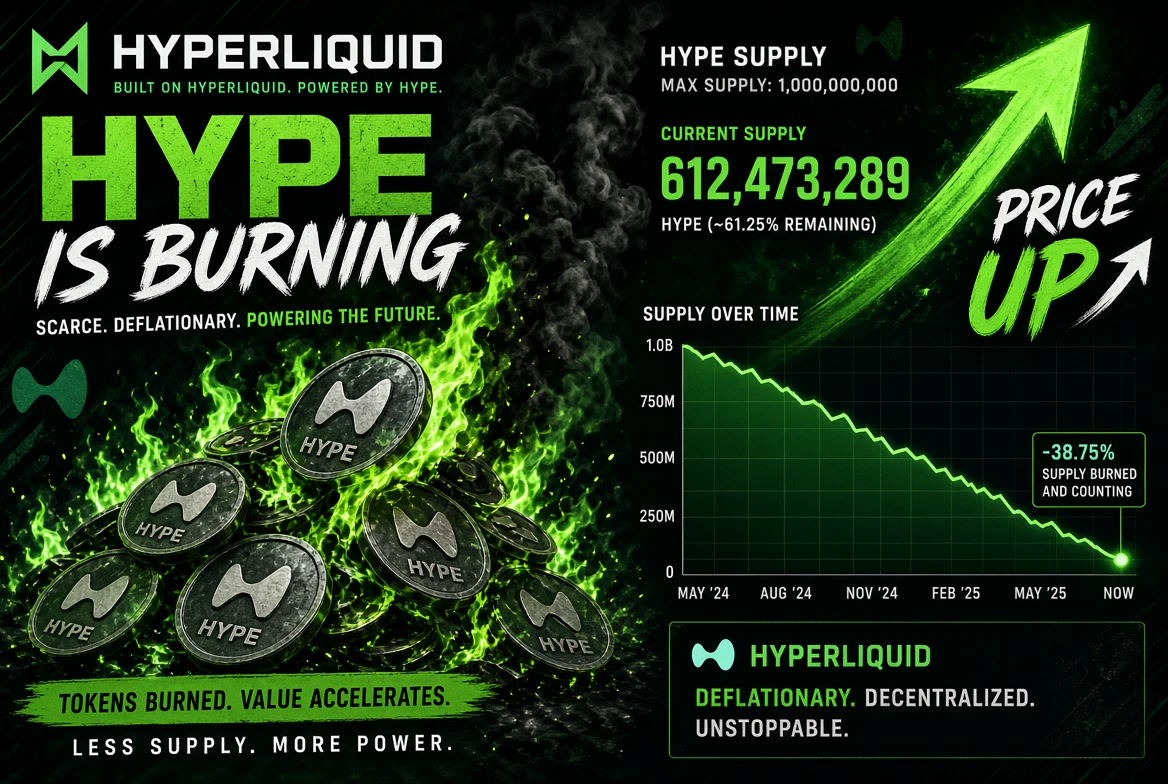
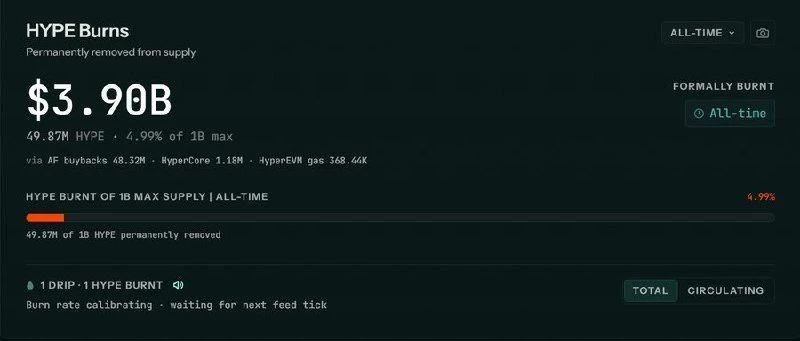
Hyperliquid Burns Nearly 5% of Supply $HYPE
Hyperliquid burned 49.87 million HYPE! 🔥
Worth around $3.89 billion — nearly 5% of the max supply. Daily burns continue from trading fees. Tokenomics are becoming increasingly deflationary.
Bullish for HYPE long term? 💎
#Hyperliquid #HYPE #TokenBurn #DeFi #Crypto
post-image
HYPE+0.24%
Trenches
BNCB
B
bade
b
BNCB
0x49...ec3f
Market Cap
$.
Change
.
24h Vol
$.
Holders
.
TTWO
T
bade
b
TTWO
TTWo...FbKo
Market Cap
$.
Change
.
24h Vol
$.
Holders
.
STONK
S
bade
b
STONK
6GmA...UNgx
Market Cap
$.
Change
.
24h Vol
$.
Holders
.
ZIG
Z
bade
b
ZIG
0x8c...1145
Market Cap
$.
Change
.
24h Vol
$.
Holders
.
XDP
X
bade
b
XDP
0x07...91d0
Market Cap
$.
Change
.
24h Vol
$.
Holders
.
Midline Intel Bro | $ETH Daily Briefing: Institutional positioning accelerates, but short-term trading intensifies
Today’s $ETH news flow is interesting—the big institutions are accelerating their groundwork, but short-term signals at the capital level are conflicting.
First, the bullish case: Google’s MPC custody solution is slated for launch in 2027, Fidelity’s ETF saw $18.8 million in net inflows in a single day, JPMorgan’s JPM Coin is officially live on Ethereum, and Ripple’s RLUSD supply has surpassed $2.6 billion. With the Midnight privacy partnership also taking shape, ecosystem devel
post-image
ETH-1.26%
BTC-0.67%
SOL-0.77%
Happy Republic Day on October 29.
“The Republic is the guarantee of a strong future guided by the light of freedom, reason, science, and unity.”
post-image
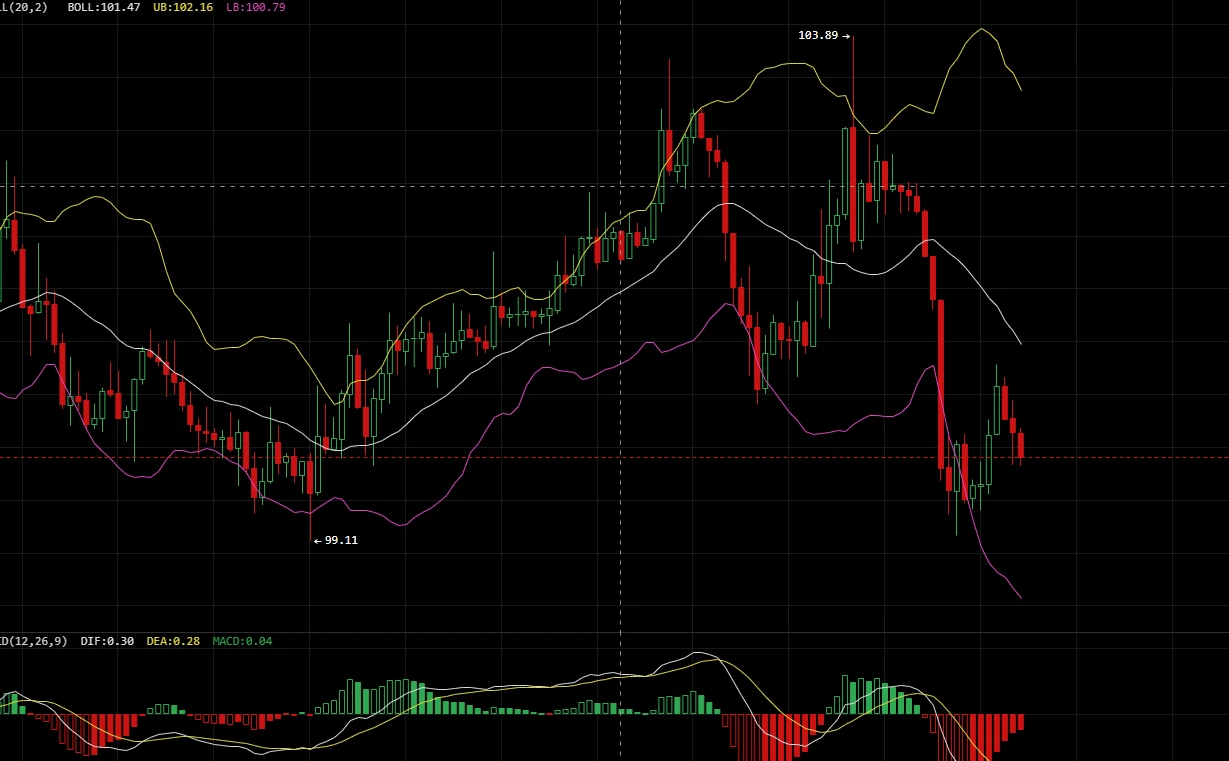
10.29 SOL Trading Strategy
  The SOL 30-minute chart is in a phase of testing lower levels after pulling back from a recent high. After dropping quickly from a high of 103.89, the price is trading near the lower Bollinger Band. The MACD remains in a bearish cross below the zero line, with selling momentum still building, so the short-term trend is generally bearish. The price is now gradually approaching the key support zone formed by the previous low of 99.11 and the lower Bollinger Band at 98.64. Consider going long in this support zone to capture a technical rebound after the price becomes
post-image
SOL-0.74%
ETHs updates
live-cover
LIVE1,991
$57.97 million flows into Gate! Funds are starting to rush in—will trading activity take off too?
A set of data caught my eye recently: Gate saw net inflows of about $57.97 million over the past 24 hours, ranking second among global CEXs. That figure is certainly worth watching. After all, in the crypto market, fund flows are like a line outside a restaurant: a longer queue suggests people are starting to pay attention, but it doesn’t mean everyone who goes in will order a full feast. 😂
My take is that sustained inflows could indeed inject more liquidity into the market. If the new funds star
GT-2.24%
  • 22
$EVAA $EVAA BOOM🤑🤑 It’s starting to crash straight into the ground. Damn, it made another wild move; the orders you guys were still holding from earlier tonight have now filled at TP1$IDOL $AIN
post-image
EVAA-0.49%
IDOL-6.71%
AIN+3.85%
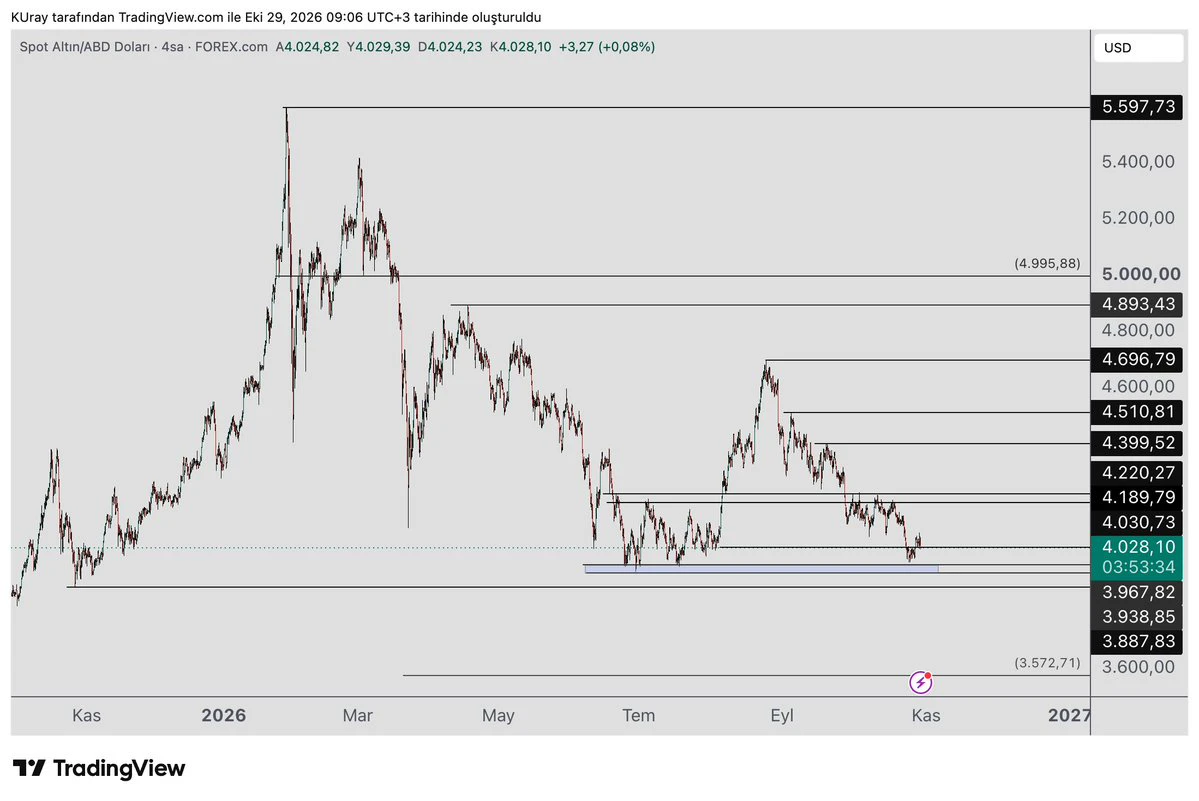
#xauusd #Altın No change to the levels we are tracking.
If the decline continues, the blue box (4030-3938), where buyers have strengthened, is expected to act as support.
On the upside, we will track the 4220 level. If price cannot make a daily close above it, the rise will be considered a reaction rally within the last downward wave. The blue box below may then be tested.
Holding support at the blue box keeps the possibility of a rise alive.
If price closes above resistance in the 4220 area, we can track the resistance levels at 4399 - 4510 - 4696 - 4893 - 4995 - 5597.
post-image
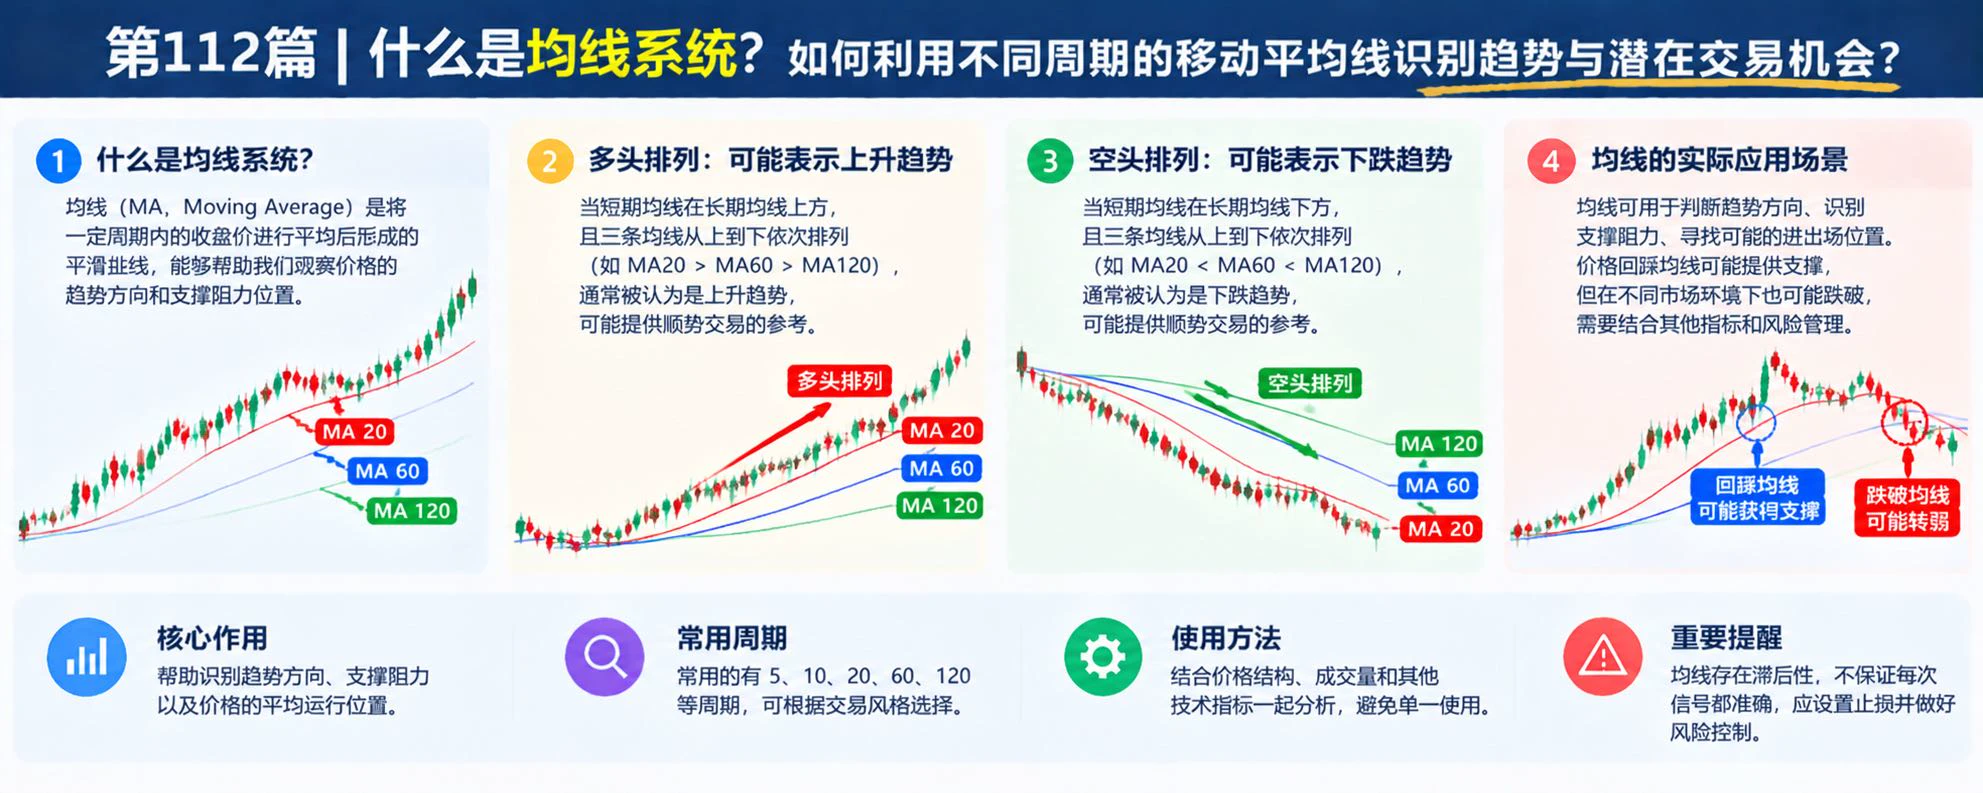
What Is a Moving Average System? How Can Moving Averages Across Different Periods Be Used to Identify Trends and Potential Trading Opportunities?
In cryptocurrency trading, BTC’s short-term volatility often makes it difficult to determine the overall direction. Moving averages (MAs) smooth price data over a period of time, helping traders observe trends, identify potential support and resistance, and avoid overreacting to short-term noise.
First, what is a moving average system?
A moving average is the average closing price over a given period. Common periods include MA5, MA20, MA60, and MA120
post-image
BTC-0.67%
$INIT That upper wick is the signal to watch most closely in this 17% rally.
The current price is 0.2092. It surged to a 24-hour high of 0.2578 before getting slammed back down, with a low of 0.1723 and trading volume of $197 million. The volume is real, but the candlestick left an upper wick spanning nearly 24%, showing heavy selling pressure above 0.25. Breaking down the technicals: the rally from the 0.1723 low to 0.2578 was a textbook high-volume breakout, but the price failed to hold above the breakout level. The pullback to around 0.21 is part of the retest and confirmation phase. The ke
INIT-2.53%
What Is a Trailing Stop? How Can You Protect Existing Profits While Leaving as Much Room as Possible for the Trend to Continue?
In crypto trading, after prices rise, many traders face a dilemma: closing the position now could mean missing further gains, while continuing to hold means risking a sudden reversal. A trailing stop is a way to dynamically adjust an exit level, aiming to gradually protect existing profits when the market moves in your favor while avoiding exiting too early.
First, what is a trailing stop?
A trailing stop means adjusting the stop-loss level based on price movements or
post-image
$BEAT ’s data looks off—down 13.21% in 24 hours, but trading volume hit 54.3M and the turnover rate went through the roof. The price plunged from 0.1099 to 0.0746, then bounced back to 0.0858. This isn’t a normal pullback; someone is aggressively trading hands at this level.
First, the unusual part: a 13% drop isn’t outrageous, but the volume is. A trading volume of 54.3M relative to this market cap means tokens are changing hands rapidly. The price wicked down precisely to 0.0746, then quickly recovered, leaving a long lower wick—a classic shakeout wick or liquidation wick.
There are three pos
BEAT-1.19%
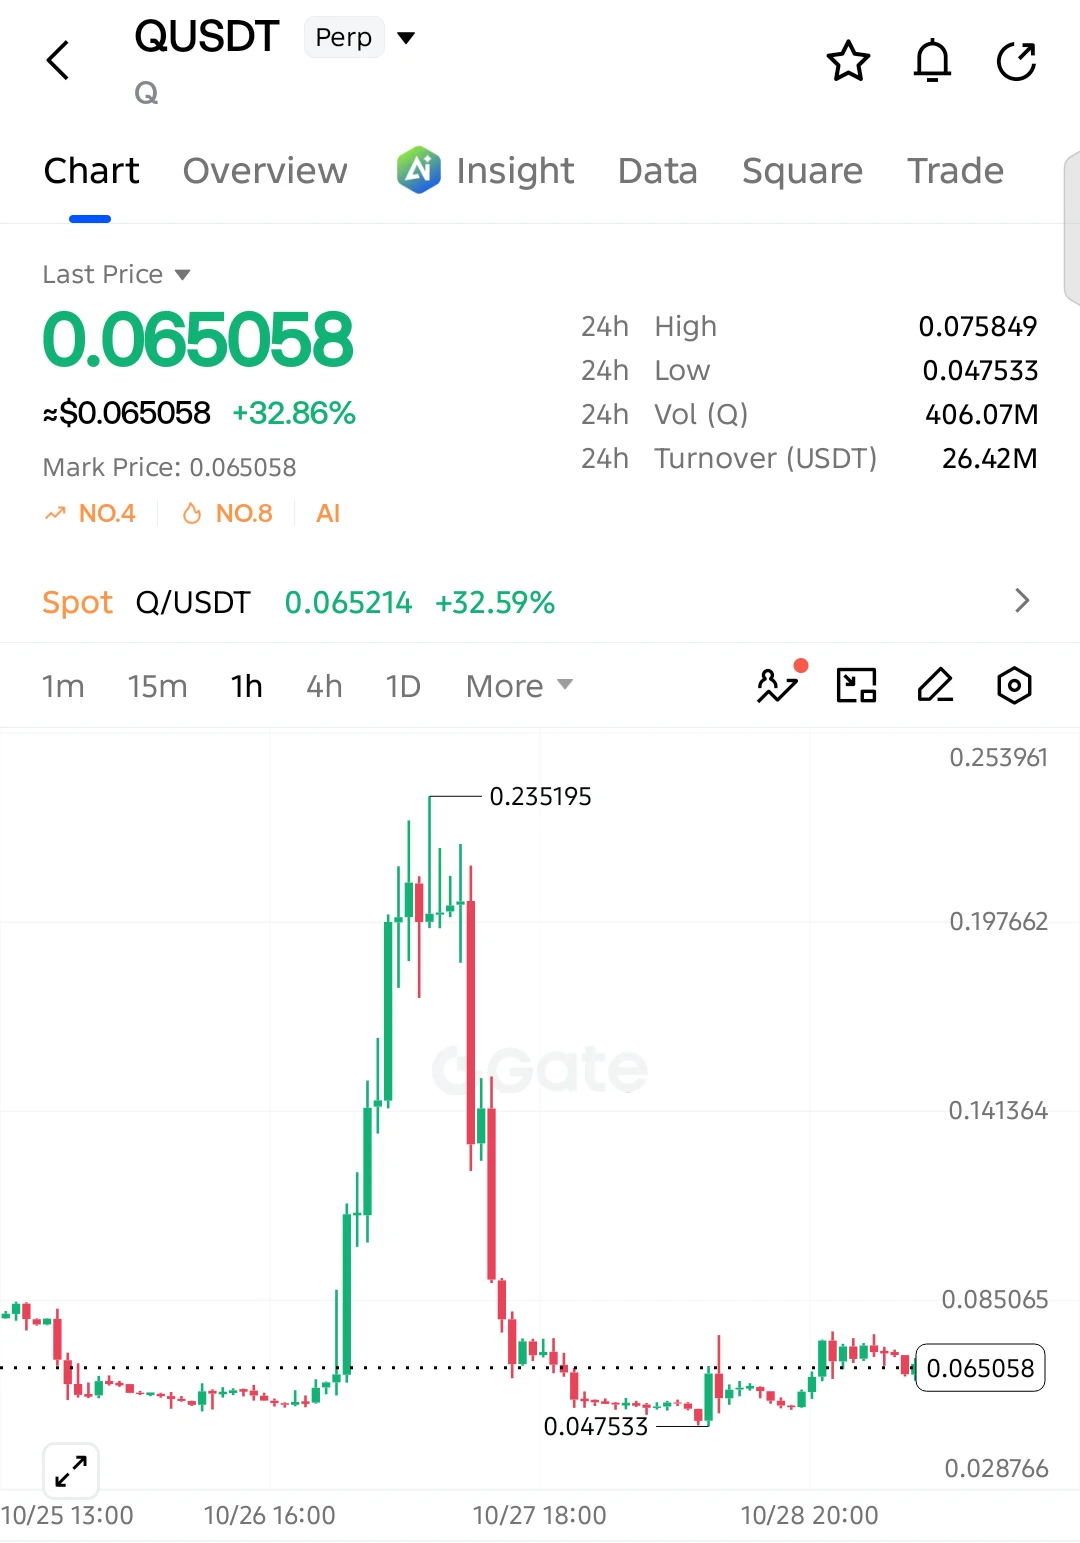
$Q SHORT SETUP — 0.050 NEXT?
$Q is struggling to recover after a massive rejection from 0.235195. The 1H chart shows price consolidating near 0.0650, with buyers failing to establish a strong breakout. A breakdown below 0.0630 could trigger another bearish move.
Entry: 0.0650–0.0670
SL: 0.0725
TP1: 0.0610
TP2: 0.0570
TP3: 0.0520
Final Target: 0.0475
The short setup remains conditional on sellers defending 0.0700 and price breaking below 0.0630. A sustained recovery above 0.0725 would invalidate this bearish outlook.
post-image
Q-28.72%
  • 2
[New Streamer] Marlet Prediction
live-cover
LIVE1,975
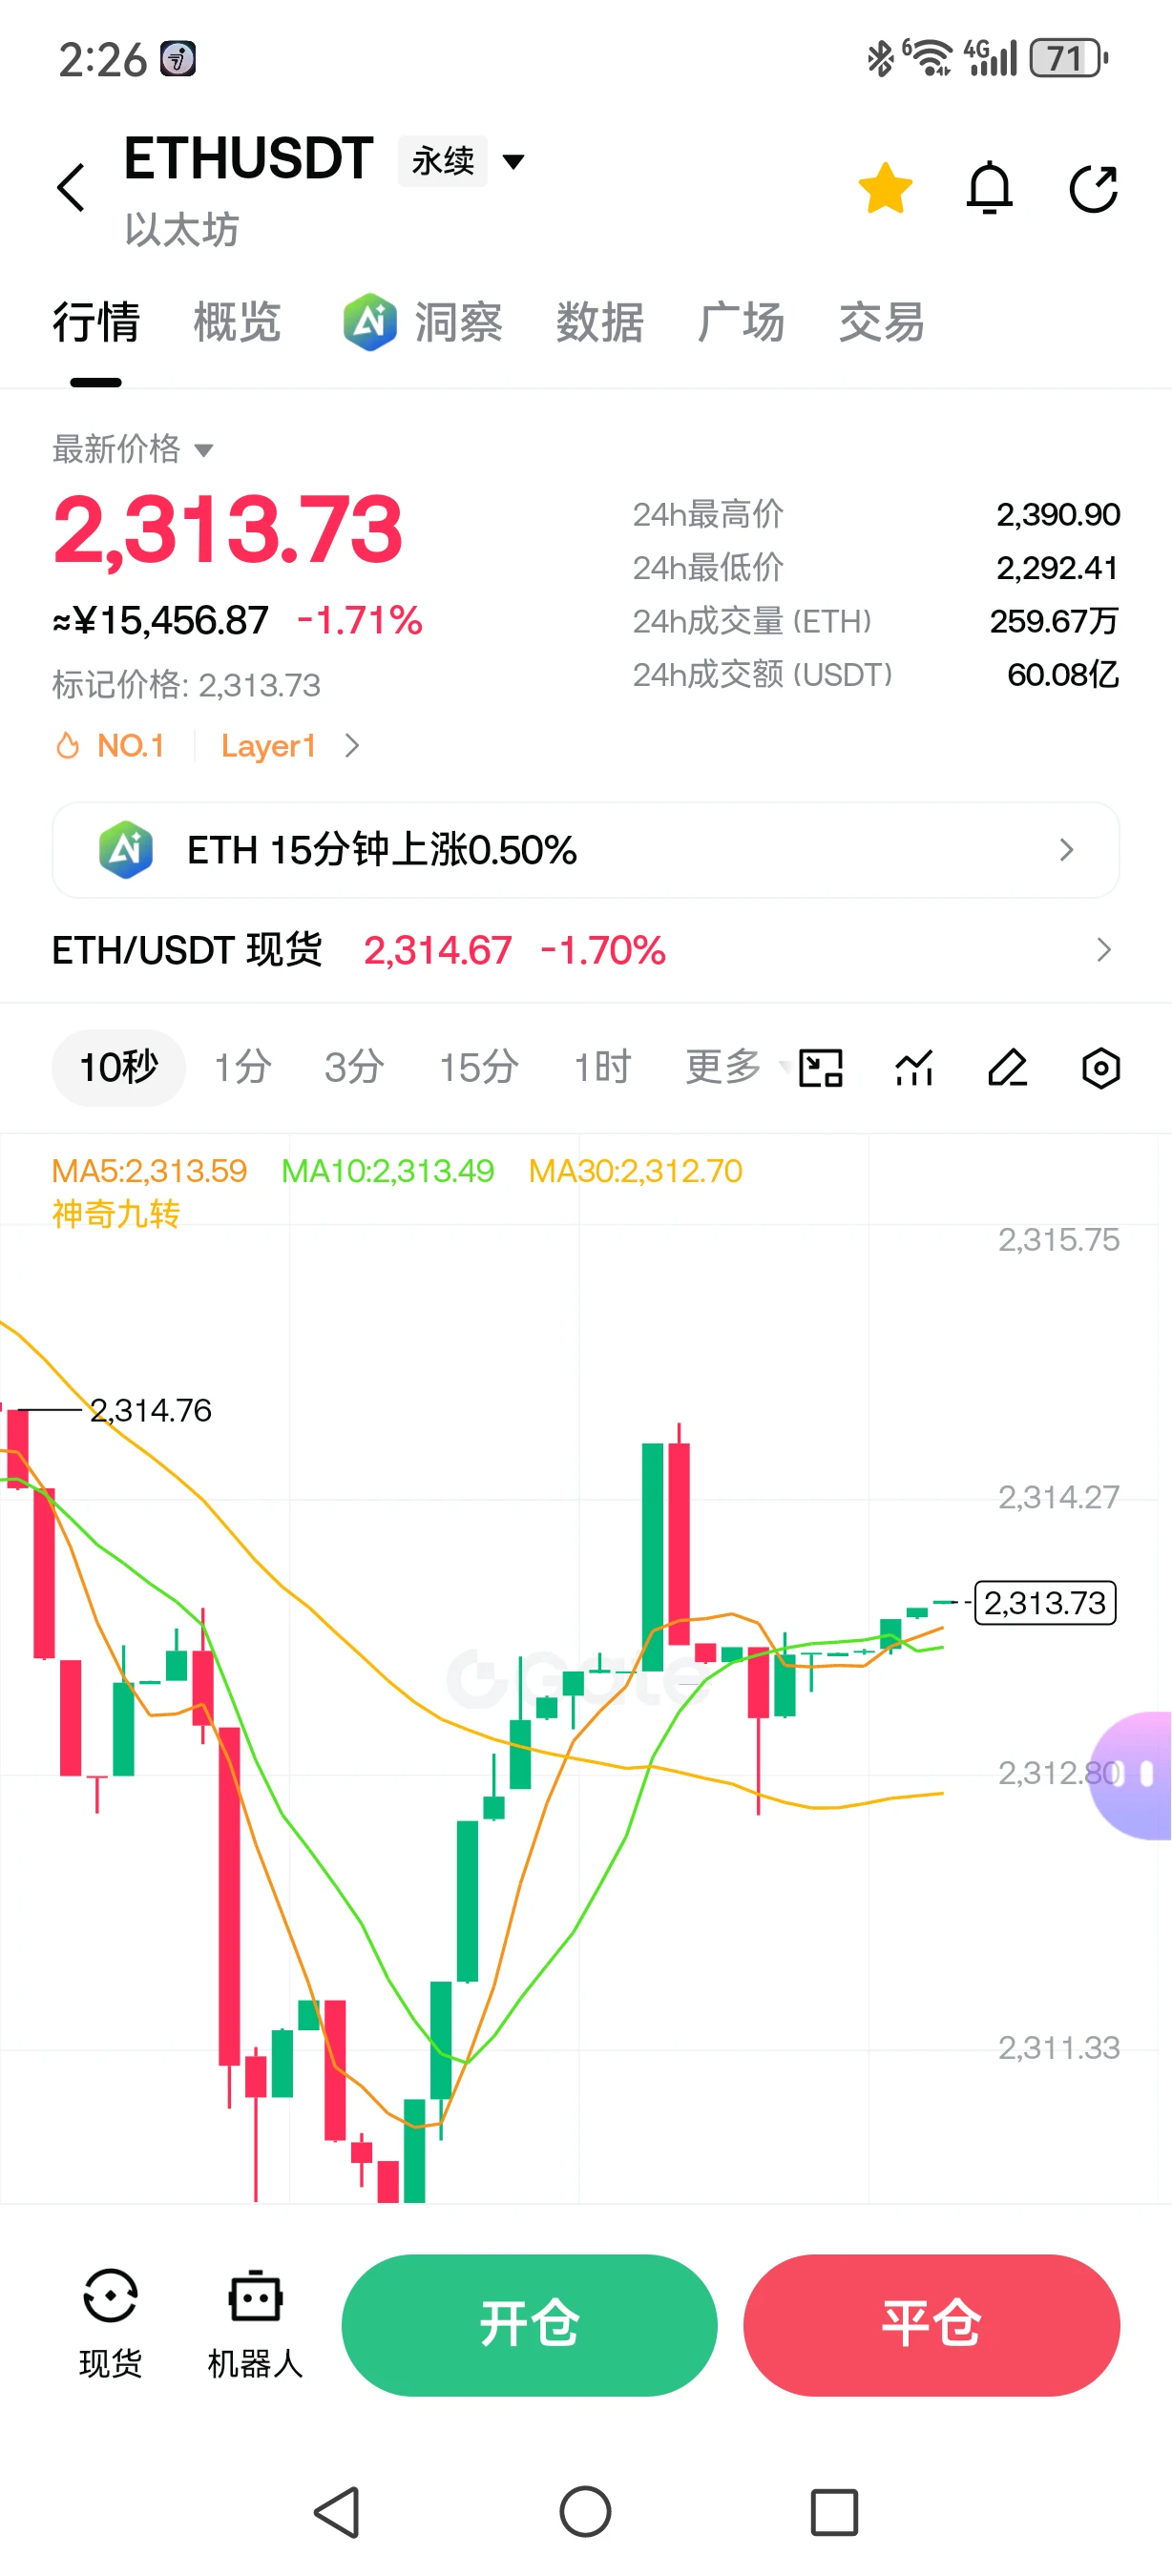
$ETH Go long around 2310, take profit at 2340–2380, and set a stop loss at 2295. Follow me for precise strategies shared daily. I share trading strategies every night at 8:30—let’s go straight for the gains.
post-image
ETH-1.26%
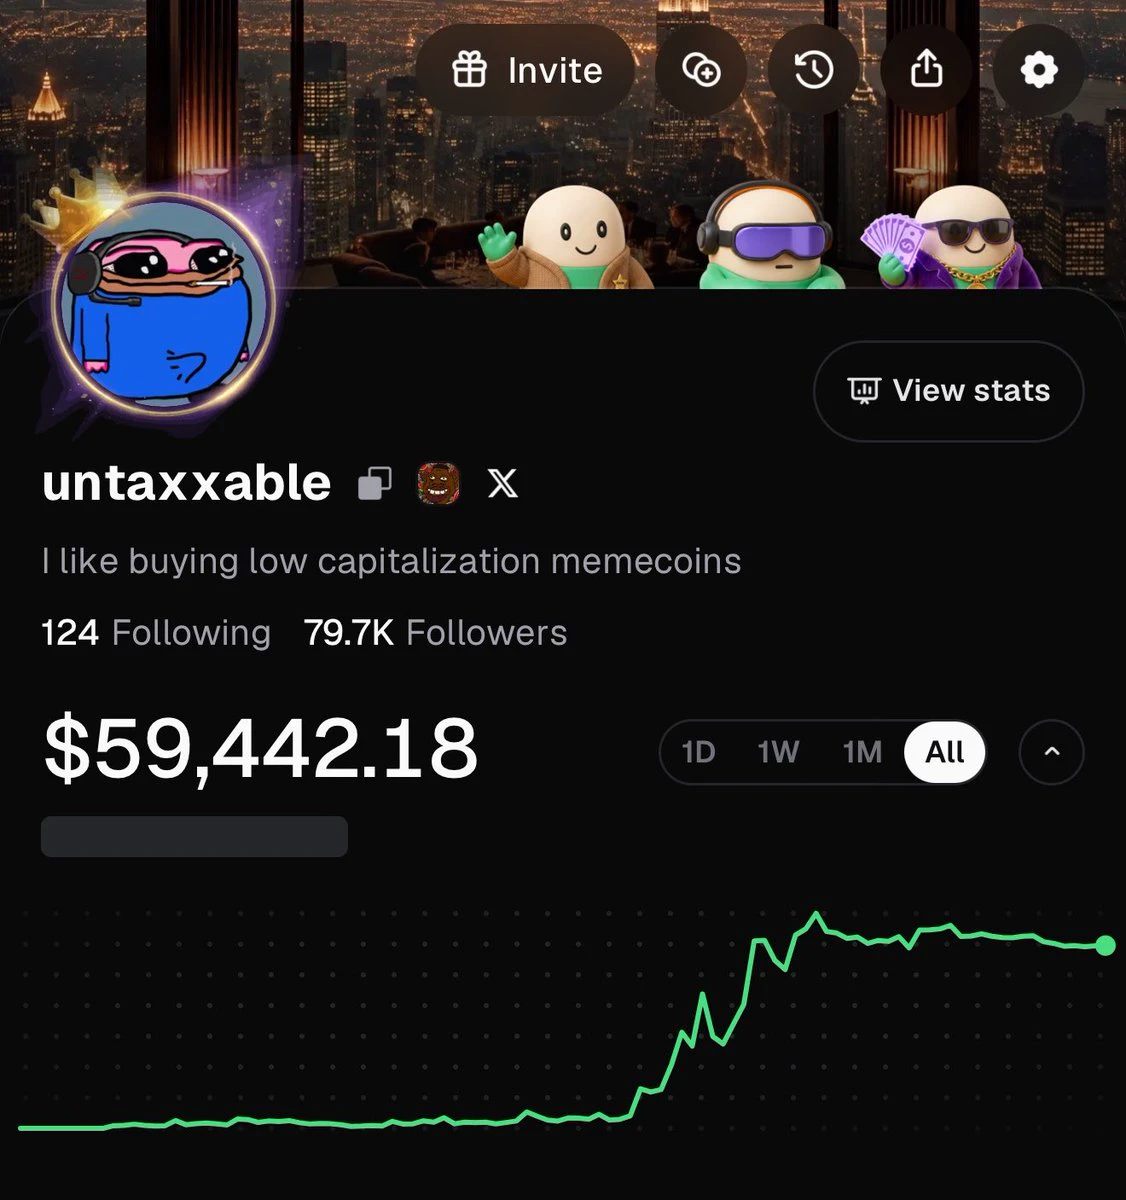
Cant wait to hit 100,000 followers on the Pumpfun mobile application.
post-image
🚨 HYPERLIQUID BURNS $3.89B IN $HYPE !
• 49.87M $HYPE burned — 4.99% of max supply
• $1.59M burned in the last 24 hours
• Daily protocol fees hit $1.69M
• Total protocol revenue surpasses $1.38B
Massive burns & strong revenue for @HyperliquidX!
post-image
HYPE+0.24%
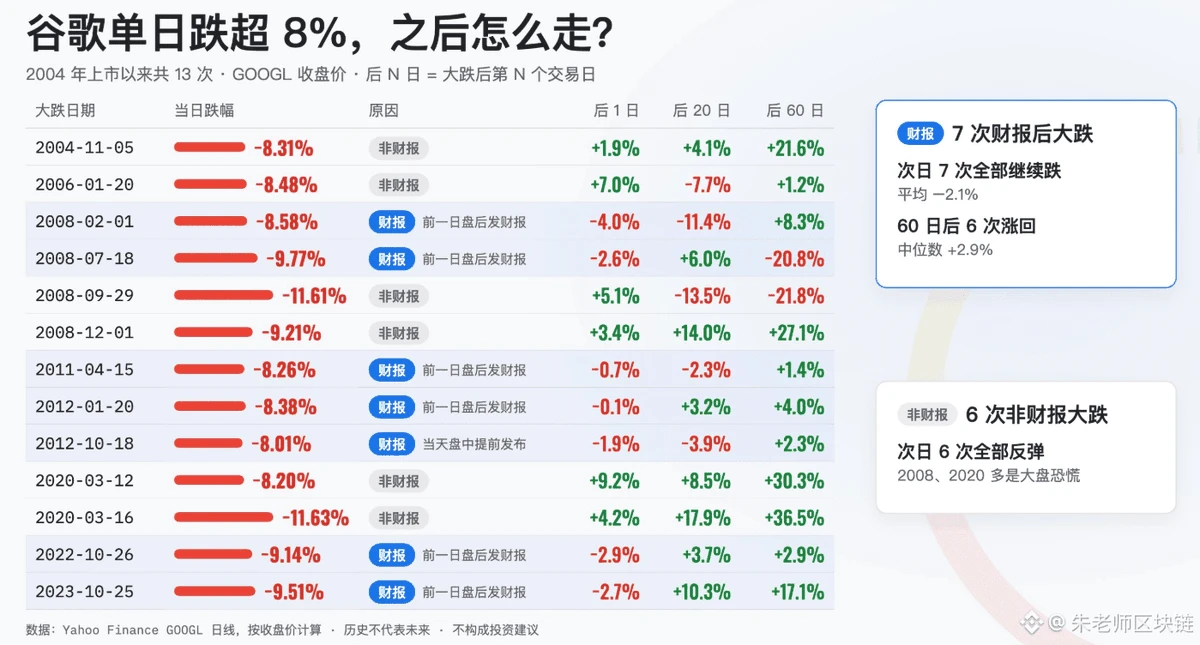
They say that when Google drops more than 8% after an earnings report, it tends to keep falling the next day, but drops on non-earnings days tend to rebound!
post-image
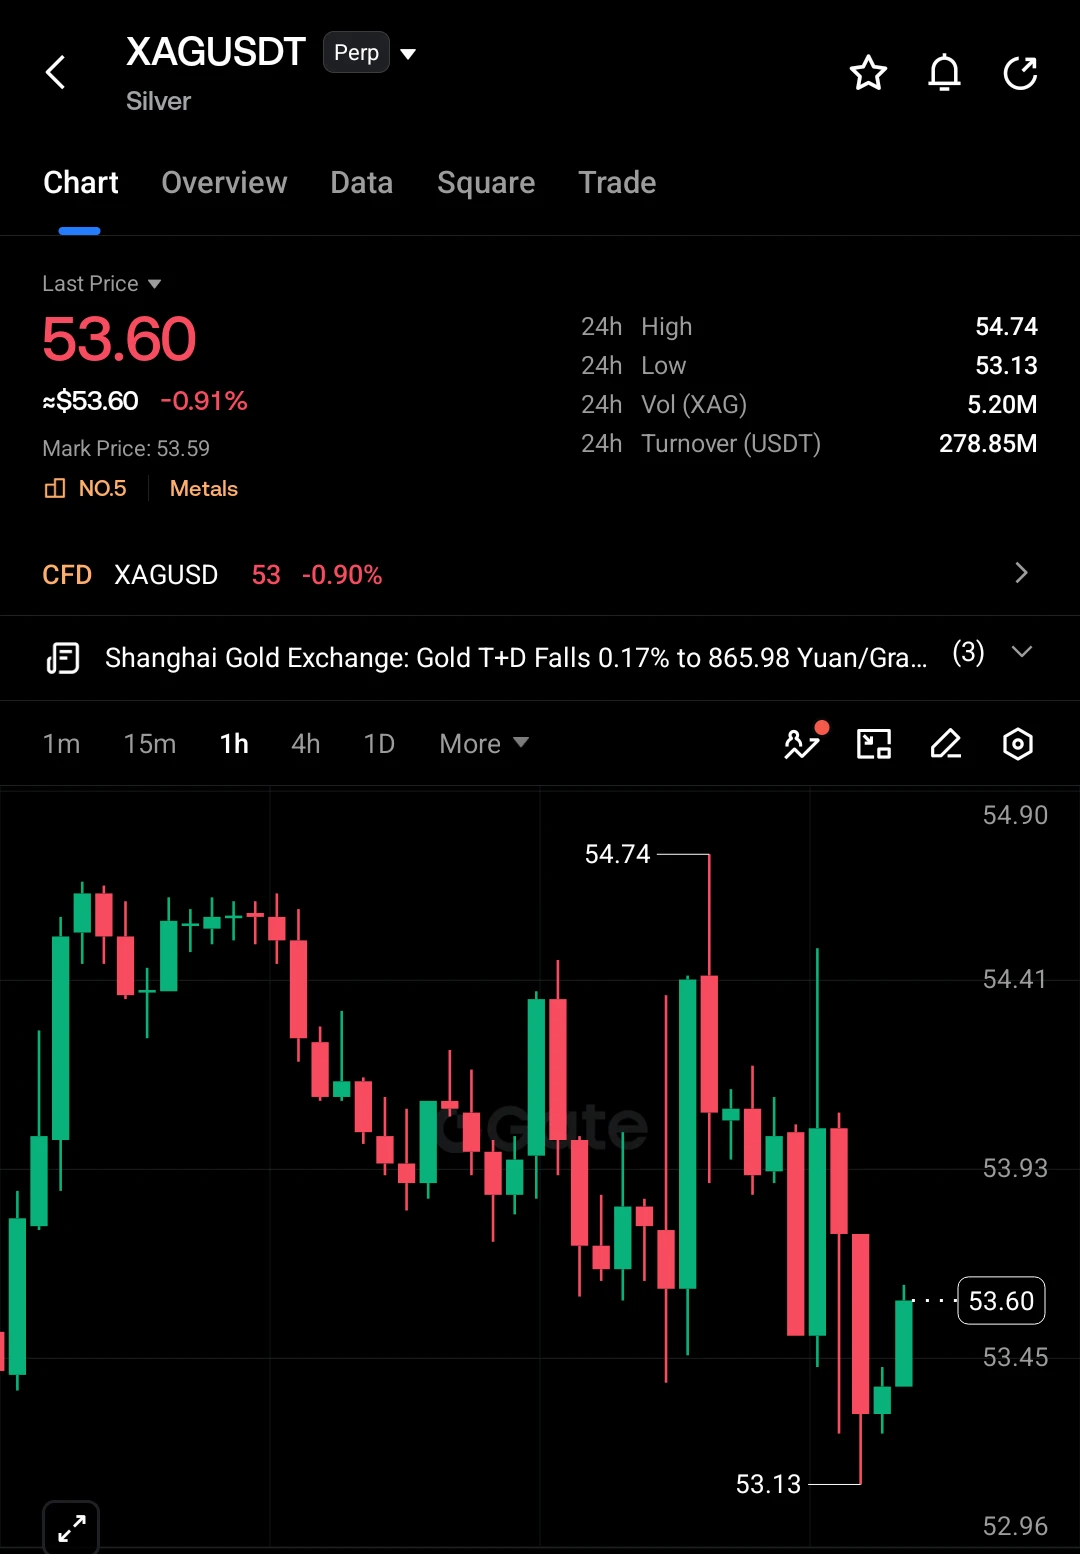
$XAG / USDT Perp | Silver: Big Volatility Alert
Silver is on the move and the chart is not quiet
If you are watching the 1h timeframe you already know the swings are sharp
Last Price is $53.60, down -0.91% in the last 24h, with Mark Price at $53.59
24h High sits at $54.74 and 24h Low at $53.13
24h Volume is 5.20M XAG, or $278.85M in USDT
Price pushed up early with strong green candles before sellers stepped in and dragged it lower in a steady slide
Buyers stepped back in and pushed for a fresh run, hitting a high of $54.74 where sellers hit back hard
A sharp red candle crashed price down fast,
post-image
XAG+0.47%
Load More

Join 40 M users in our growing community

⚡️ Join 40 M users in the crypto craze discussion

💬 Engage with your favorite top creators

👍 See what interests you

Trending Topics

FedKeepsRatesSteady

41.11k Views1.77k Discussing

The Fed will announce its rate decision on October 28 at 18:00 (UTC), followed by a press conference at 18:30 (UTC). Markets widely expect rates to remain unchanged, with attention turning to future policy signals. Could this decision break crypto out of its trading range? What signals are you watching?

Gate24HNetInflowsRankTop2

1.03k Views874 Discussing

GoogleCloudSurges103%ButStockFalls

996 Views522 Discussing

View More