




Square
Following
Hot
News
Notifications
Profile
Share your thoughts
placeholder
Article
#每周来晒 #美国10月CPI即将公布
The October 2026 U.S. Consumer Price Index (CPI) release is the most important near-term macroeconomic catalyst for global financial markets, as it could reshape expectations for the Federal Open Market Committee’s December 8–9 policy decision.

Investors are watching whether headline inflation rises around the expected 0.3% month over month and whether core CPI remains near 0.2%–0.3%. The September report showed headline CPI rising 0.6% month over month and 3.7% year over year, while core CPI increased 0.3% monthly and 2.6% annually. One unusual detail matters this mon
No wonder everyone tries to snag a spot in the front row at concerts.
The view really is different.
Trenches
PIEVERSE
P
bade
b
PIEVERSE
0x0e...25a9
Market Cap
$.
Change
.
24h Vol
$.
Holders
.
牛逼
牛
bade
b
牛逼
0x96...7777
Market Cap
$.
Change
.
24h Vol
$.
Holders
.
STONK
S
bade
b
STONK
6GmA...UNgx
Market Cap
$.
Change
.
24h Vol
$.
Holders
.
ON
O
bade
b
ON
0x0e...1d48
Market Cap
$.
Change
.
24h Vol
$.
Holders
.
FLOAT
F
bade
b
FLOAT
Bv1a...BMmr
Market Cap
$.
Change
.
24h Vol
$.
Holders
.
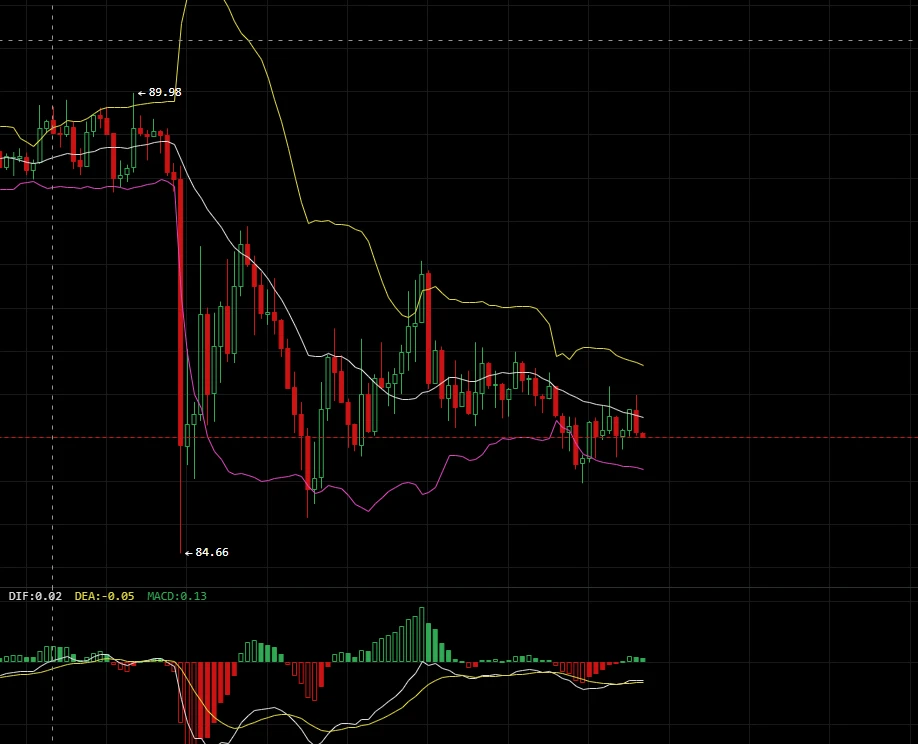
11.10 SOL Trading Plan

SOL is currently in an oversold, choppy recovery phase. The price is trading below the Bollinger midline, but the broader downtrend has yet to reverse, so this is best viewed as a short-term rebound. Key support levels are the lower Bollinger Band at 85.66 and the key defensive support at the previous low of 84.66, before this decline. Key resistance levels are the Bollinger midline at 86.27, the upper Bollinger Band zone of 86.88–87.10, the previous rebound high near 88, and the 89.00–89.50 intermediate consolidation zone during the decline.

Entry zone: Consider going
post-image
SOL-0.74%
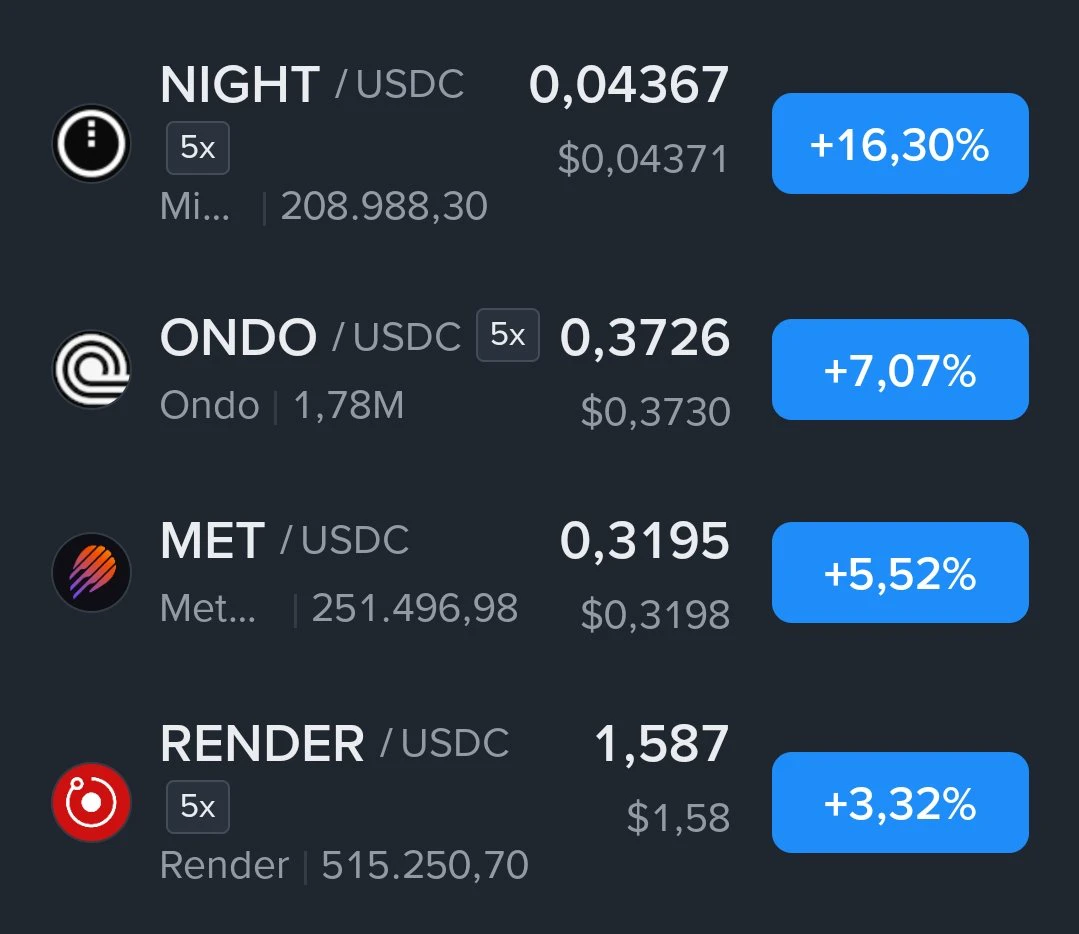
$NIGHT $ondo $met
#EXO_KASE #Riyadh_now
post-image
NIGHT-3.10%
ONDO-0.29%
MET-0.33%
BTC | ETH | Gold | Crude Oil
live-cover
LIVE3,474
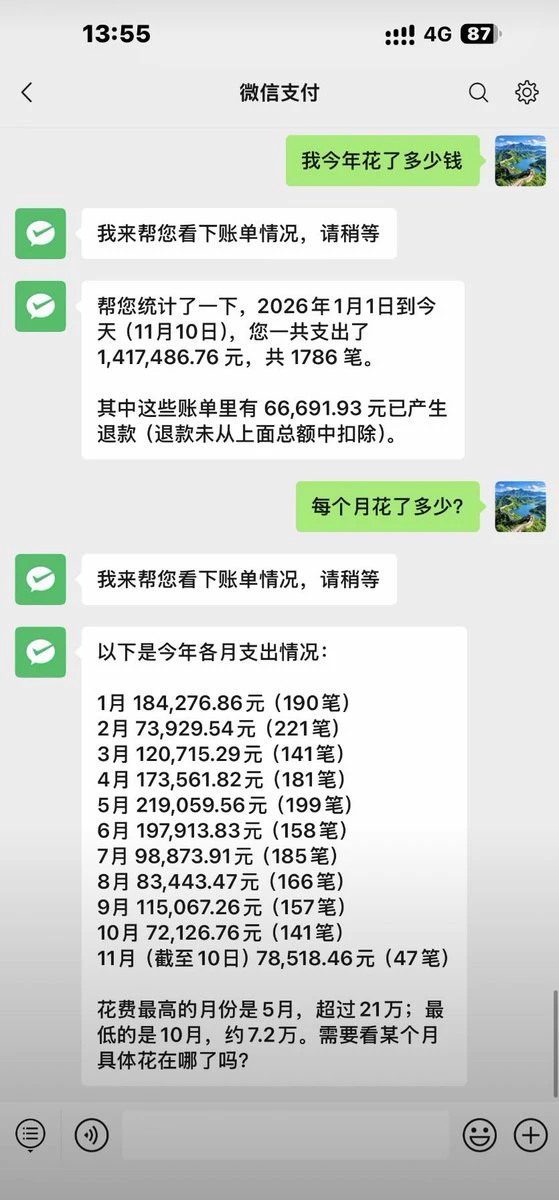
Starting today, I’m tightening my belt
I’ll only eat Pinhao Fan
Goddammit, seriously
How did I spend so much just on food
post-image
I'm trading on Gate, a top-tier exchange with a 13-year track record. Come join me and dive into the hottest events right now! https://www.gate.com/campaigns/6766?ref=VLARBF1YAG&ref_type=132
post-image
🔹ETH Keeps Attracting Staking Despite Falling Prices! With the staking ratio continuing to climb, a
live-cover
LIVE2,104
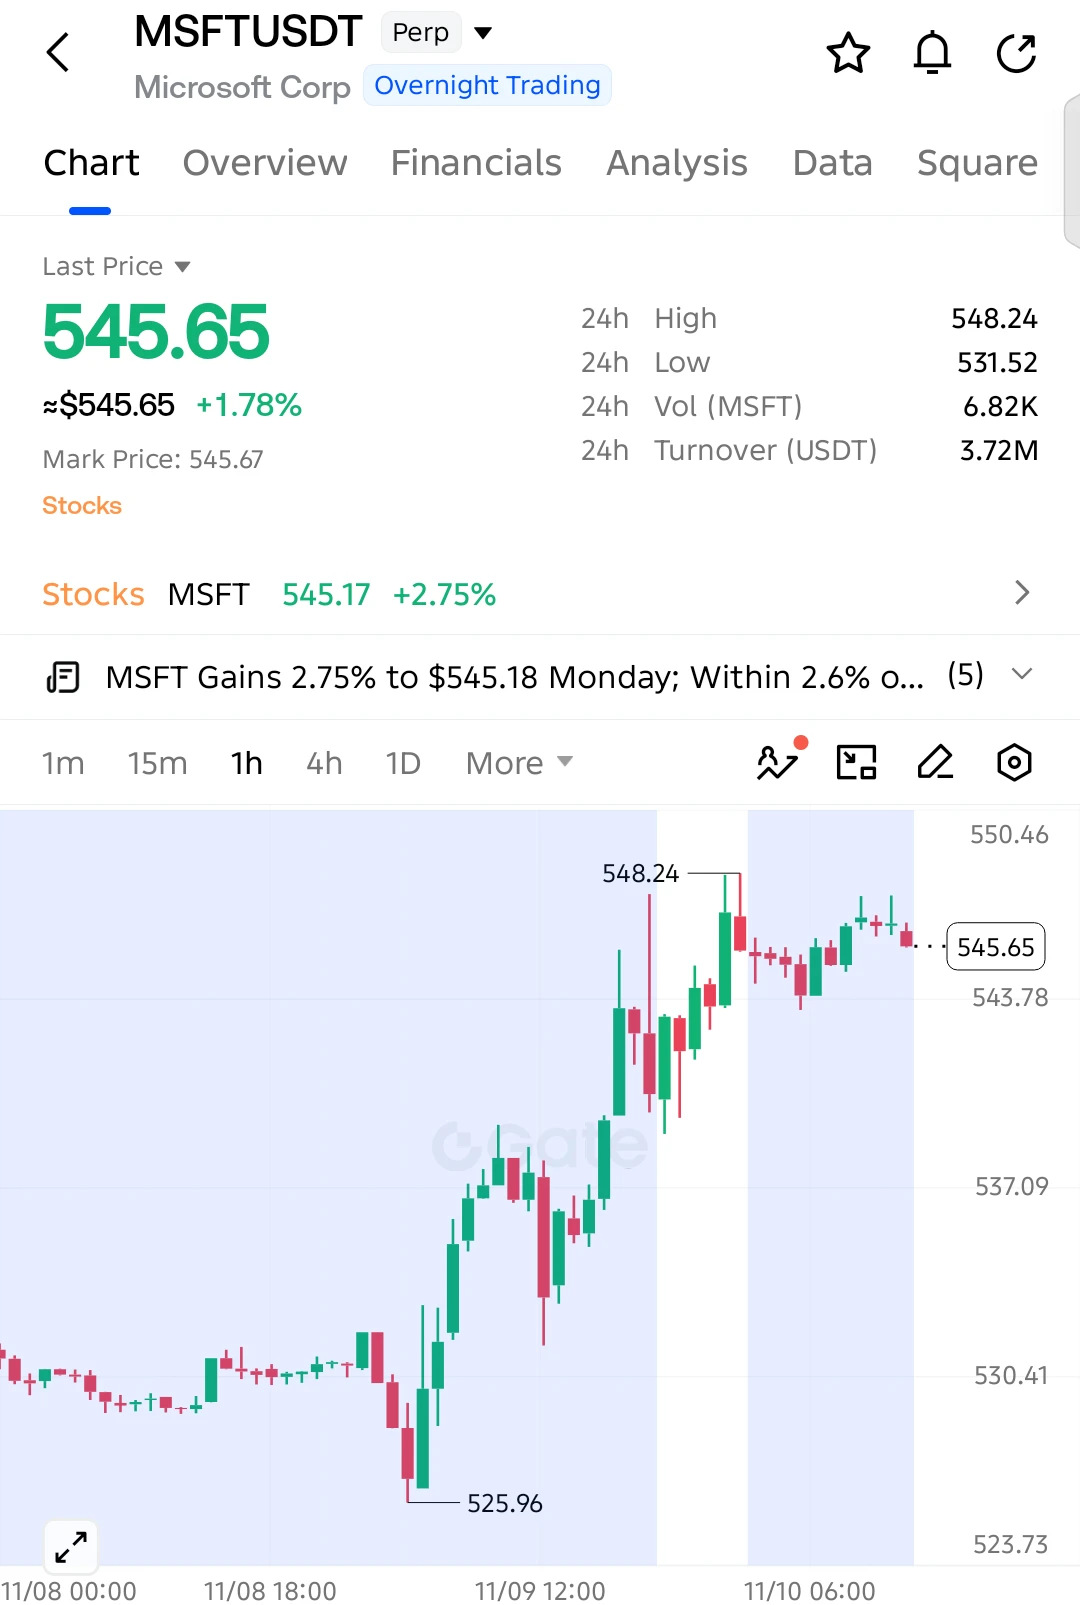
$MSFT LONG SETUP — BULLS EYEING ANOTHER BREAKOUT!

$MSFT is showing strong bullish momentum after recovering from 525.96. Buyers are holding price near the recent high of 548.24, keeping the next upside move in focus!

Entry: 545.65
SL: 542.80

TP1: 548.24
TP2: 551.50
TP3: 555.00
Final Target: 560.00

The strong recovery has pushed $MSFT into a higher trading range, with buyers defending the 543–544 support area. A clean breakout above 548.24 could attract fresh buying pressure and open the way toward 555 and beyond.

Invalidation: Sustained breakdown below 542.80.

$MSFT bulls remain in contr
post-image
MSFT+0.59%
A 5% jump does not, by itself, constitute a trend.

The sharp rise in the KOSPI, which exceeded 5%, was driven primarily by Samsung and SK Hynix. From the perspective of an individual investor, I do not view this move as the beginning of a trend.

Data flows originating from the U.S. and various geopolitical developments remain unclear. In the current climate, it is wiser to maintain a cautious approach and wait for the markets to settle. On days like these, the costliest mistake one can make is to increase one’s position out of fear of missing out on a single day’s rally. While this surge off
post-image
South Korean semiconductor stocks stage a major comeback; these are the areas I’m most bullish on!

If the past AI rally was driven by computing chips, the next competition is likely to be a contest across the entire infrastructure supply chain.
The strong rebound in the South Korean stock market today has brought Samsung Electronics and SK Hynix back into focus, and put HBM, advanced packaging, and semiconductor equipment back on investors’ radar.
Why do I think the AI industry chain still has opportunities?
Because the development of AI applications requires steadily increasing computing pow
$BTC This price action looks a lot like the market before past escalations in Middle East tensions—not in terms of price, but in that numb feeling of “the news hasn’t landed yet, so the market is pretending nothing’s happening.” For example, around the escalation of the Iran-Israel conflict in April 2024, BTC first traded sideways near $70,000, while trading volume during the Asian session dropped noticeably. Once the news broke, it quickly pulled back to around $61,000, then recovered as sentiment settled. The early stages of the Israel-Hamas conflict in October 2023 were similar: prices drop
post-image
BTC-0.67%
BZ-1.18%
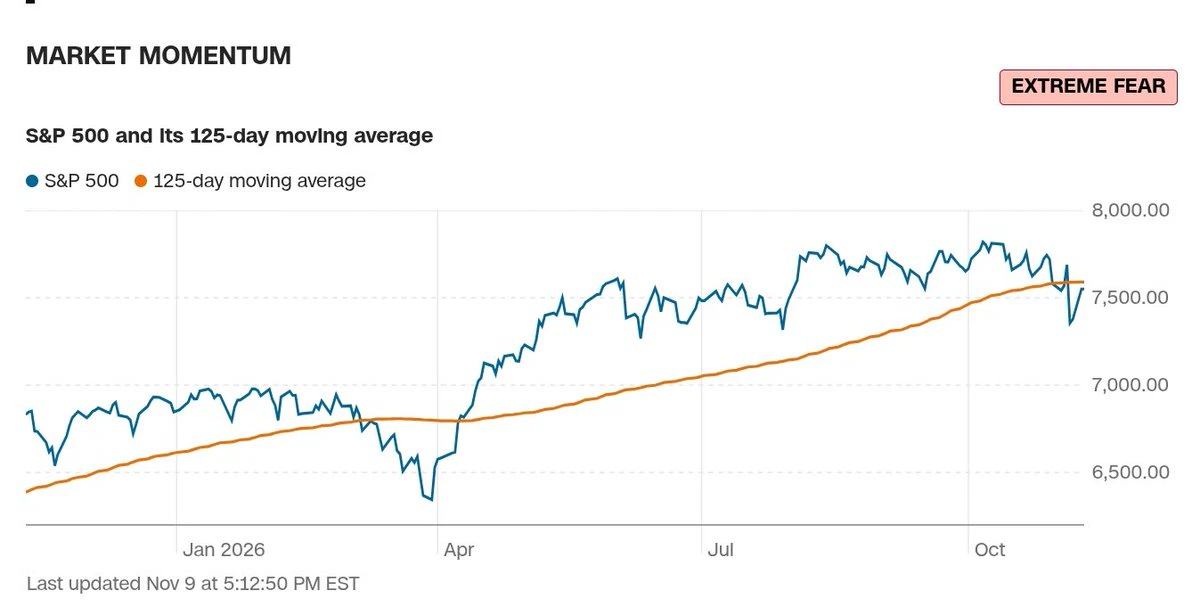
The S&P 500 just ran back into its 125-day moving average, and sentiment
reads EXTREME FEAR!
📈 April low ~6,350 → ~7,800 peak
📉 October dip to ~7,350
🔄 Bounce to ~7,550, right at the rising 125-day MA (~7,590)
That line has held as support since April. Bulls call this a classic trend retest.
Bears say a clean break would be the first real crack in the uptrend.
With $BTC losing its weekly key levels, I'm sure we'll see more correction for the entire market, soon. ✍️
post-image
SPX500+0.19%
US500+0.05%
BTC-0.67%
#标普500创7个月最大涨幅 𝗕𝗿𝗼𝗮𝗱 𝗥𝗲𝗰𝗼𝘃𝗲𝗿𝘆 𝗼𝗿 𝗦𝗵𝗮𝗿𝗽 𝗕𝗼𝘂𝗻𝗰𝗲? 𝗥𝗲𝗮𝗱𝗶𝗻𝗴 𝘁𝗵𝗲 𝗦&𝗣 𝟱𝟬𝟬'𝘀 𝗕𝗲𝘀𝘁 𝗗𝗮𝘆 𝗶𝗻 𝗦𝗲𝘃𝗲𝗻 𝗠𝗼𝗻𝘁𝗵𝘀

𝗧𝗵𝗲 𝗩𝗲𝗿𝗱𝗶𝗰𝘁 𝗙𝗶𝗿𝘀𝘁

The evidence says the rally was broad, but the recovery is not complete. On Monday, November 9, the S&P 500 rose 2.35% to 7,549.94, gaining 173.08 points in its best session since April 8, when it rose 2.51%. All 11 sectors rose, the Dow added 2.15% to 52,389.75 (+1,104.02 points), the Nasdaq Composite gained 2.74% to 25,253.14 (+673.71) and the Russell 2000 climbed 3.15% to 2,840.81. That day was bigger t
post-image
SPYX+0.01%
SPX500+0.19%
US2000+0.18%
INDEX+0.00%
COHR+16.73%
  • 1
With the same sorrow and longing every year...
#10Kasım #November10
post-image
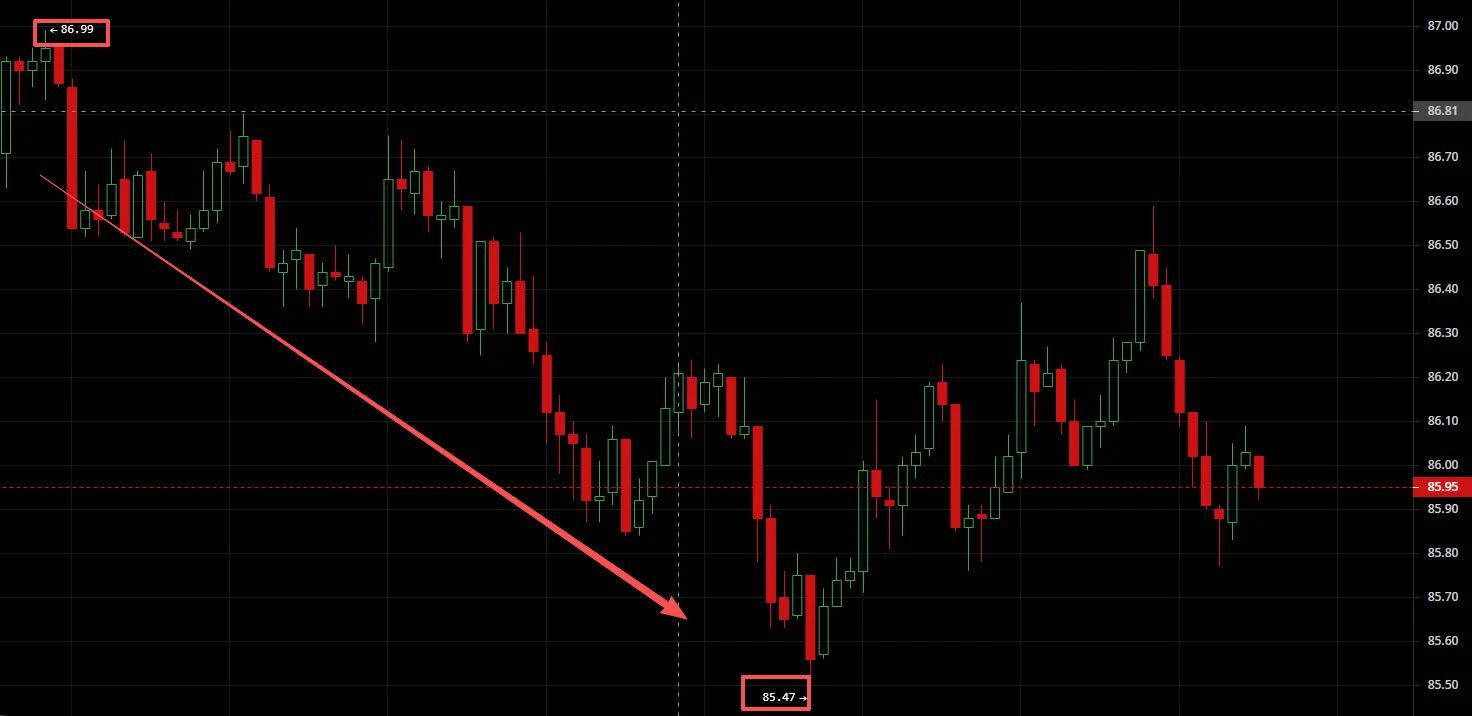
$SOL Solana trade idea played out
We anticipated a short in the 86.5–88.5 resistance zone on a rebound. Price surged to 86.99, met resistance, and moved lower, reaching near the first target of 85.5. The weak market unfolded as expected. #AVAX利好短时上涨6.4%
post-image
YaoYao
$SOL Yaoyao | 11.10 SOL outlook
Entry: Short on a rebound near 86.5-88.5
Stop-loss zone: Above 89
Levels to watch: 85.5-84.5
The hourly rebound high of 88.2 formed effective resistance. The second rebound failed to break the previous high, forming a lower high—a typical weak rebound;
Price has already fallen below the consolidation range around 86.5, with consecutive bearish candles moving lower and the center of consolidation continuing to shift down as bearish momentum plays out;
The rebound is a corrective move after the decline, not a reversal. Price is likely to face renewed resistance and pull back when it reaches the nearest resistance zone.#70%山寨币跌破200日均线
SOL-0.74%
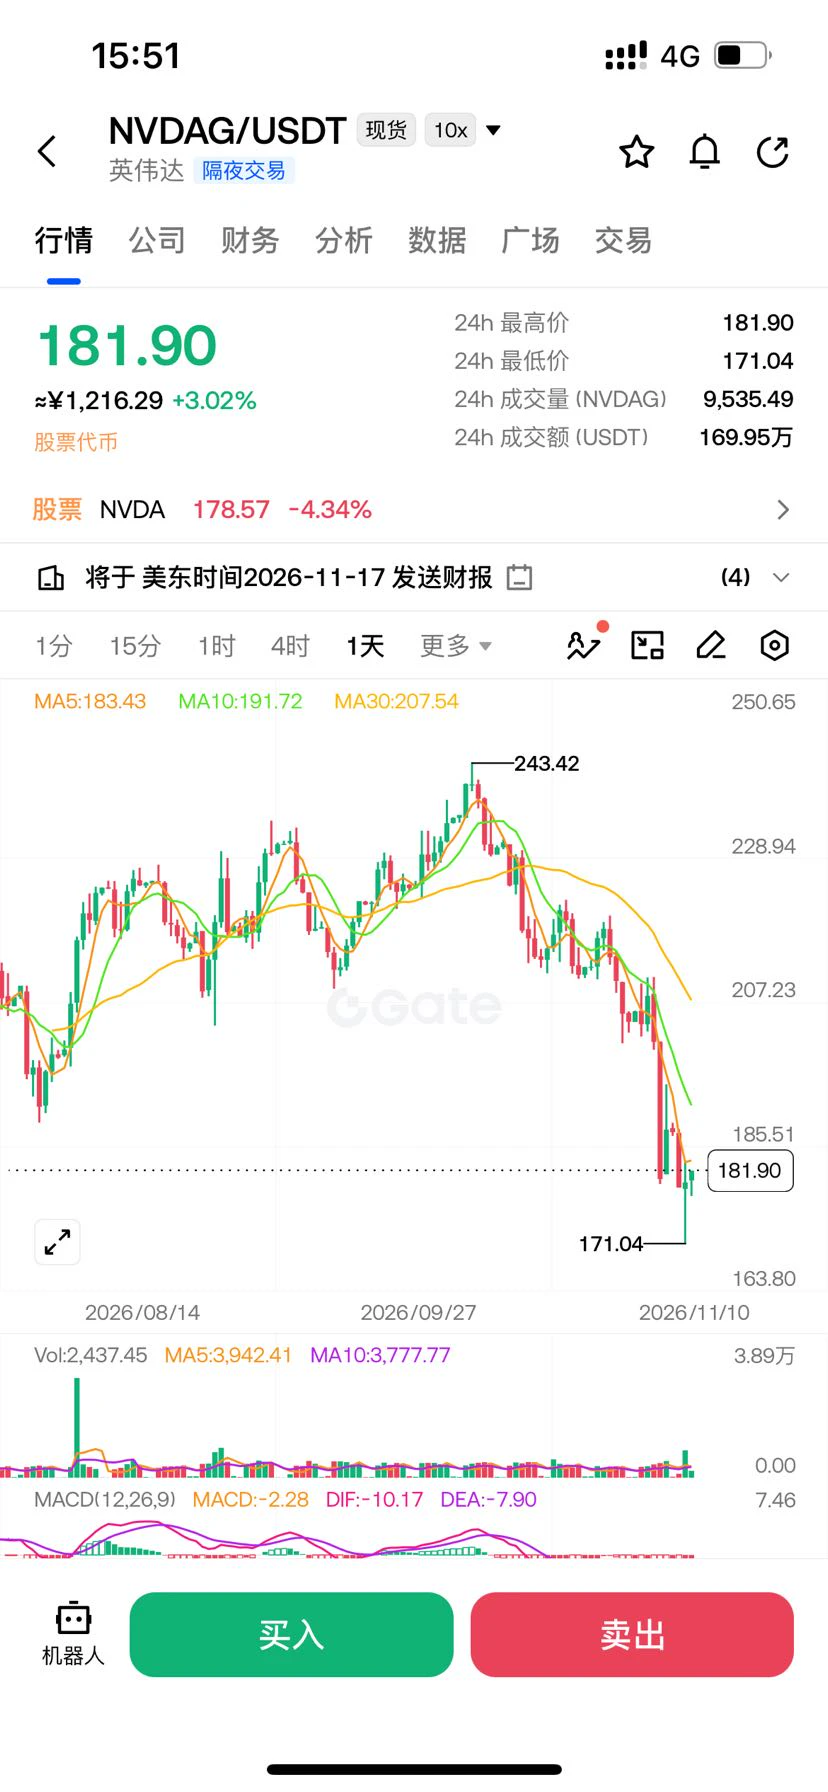
$NVDA This coin is being driven by a major piece of gossip today—Huang's private life was dug up, Trump stepped in to smooth things over and tossed out “ignorance is no crime,” bringing Nvidia into it along the way. It’s a wild story, but traders only care about one thing: who’s going to foot the bill.

The real issue isn’t the gossip; it’s interest rates and liquidity. The AI trade runs on liquidity, and when the taps tighten, even the best story has to be paid for in installments. Tonight’s data hurdle hasn’t been cleared yet; anyone betting on a direction is buying lottery tickets early, a
post-image
NVDA-0.35%
NVDAG-0.24%
What Is Notional Position Size? Why Shouldn’t You Look Only at How Much Margin You Put Up When Calculating Risk?

In crypto futures trading, some traders see that they have put up only 500 USDT in margin and assume they are taking on little risk. But if that margin backs a futures position worth several thousand USDT, even a slight price move can cause significant profit or loss fluctuations. That’s why it’s important to understand notional position size.

First, what is notional position size?

Notional position size refers to the notional value of a futures position. For a linear USDT-margin
post-image
BTC-0.65%
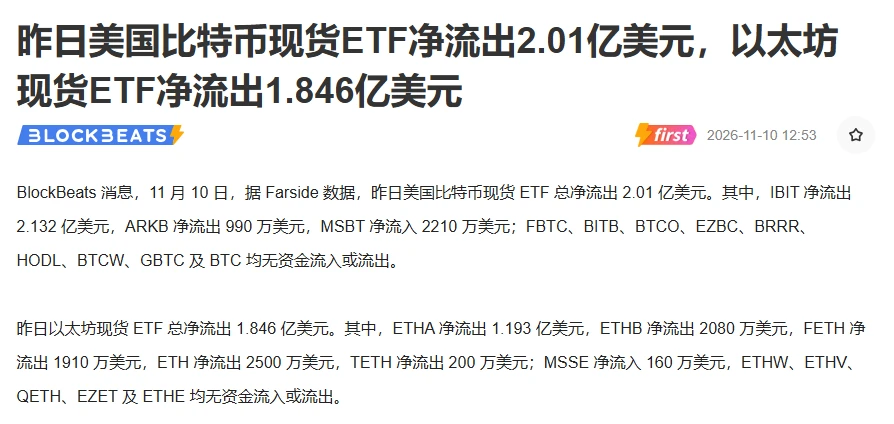
$201 million + $184.6 million: Two ETFs are “draining” simultaneously; this isn’t rotation, it’s retreat.

November 10 data: $BTC spot ETFs saw net outflows of $201 million, while $ETH spot ETFs saw net outflows of $184.6 million. BlackRock’s IBIT alone saw $213.2 million flow out, while the situation is even more striking for ETH—weekly outflows have continued for six consecutive weeks, with $1.08 billion flowing out in October alone, a record for the year.

The market is confirming this too: BTC is repeatedly trading around $75k, with $74,400 as a key defense level; ETH has fallen to aroun
post-image
BTC-0.67%
ETH-1.26%
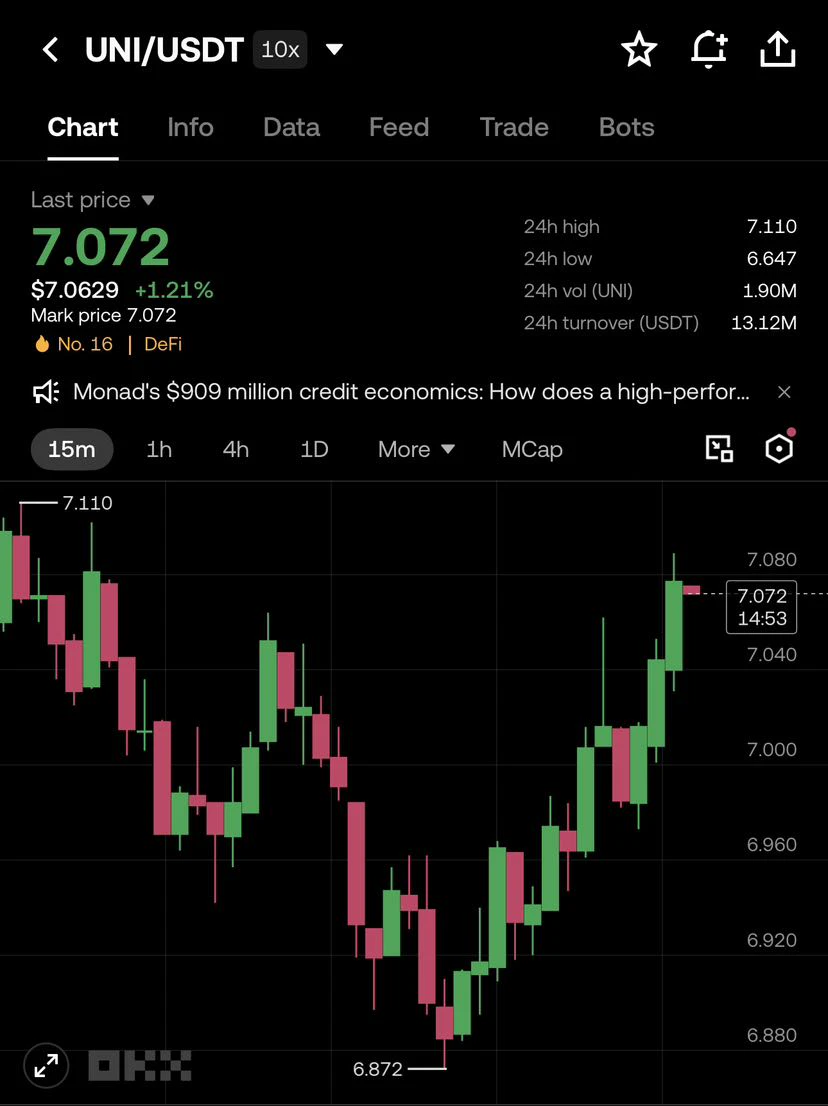
$UNI consolidating near the $7.07 level on the 15-minute chart showing a strong recovery bounce from the intraday low of $6.64.

Price action has carved out a solid higher-low structure after sweeping support down near $6.87 currently testing immediate overhead supply close to the 24-hour high of $7.11.

Volume indicators show expansion on the impulsive green candles ypointing to active buyer participation.#USIranTalksShowNewProgress #AnthropicLaunchesNasdaqIPORoadshow
post-image
UNI+3.05%
Load More

Join 40 M users in our growing community

⚡️ Join 40 M users in the crypto craze discussion

💬 Engage with your favorite top creators

👍 See what interests you

Trending Topics

USCPIDataIncoming

51.68k Views2.25k Discussing

The U.S. October CPI report will be released on November 10 at 8:30 a.m. ET. September CPI came in at 3.7% year over year, and markets will be watching closely for signs that inflation is cooling, especially in core CPI. A softer-than-expected reading could strengthen rate-cut expectations, while hotter inflation may pressure risk assets through higher Treasury yields and a stronger dollar. How do you think this CPI print will move $BTC, U.S. stocks and gold?

USIranTalksShowNewProgress

7.75k Views1.28k Discussing

KoreanStocksJumpOver5%

4.22k Views4.88k Discussing

View More