Square
Following
Hot
News
Notifications
Profile
Share your thoughts
placeholder
Article
The Nightmare of Every Trader!
post-image
  • 2
The Musk-themed puppy token Puppies emerged within one minute of Musk’s “l love you puppies” tweet. Its contract address ends in 6eb2, it is listed on more than a dozen exchanges, and communities in over 50 countries are actively building. Worth accumulating at the bottom.
Trenches
ZIG
Z
bade
b
ZIG
0x8c...1145
Market Cap
$.
Change
.
24h Vol
$.
Holders
.
BTC
B
bade
b
BTC
C5xp...pump
Market Cap
$.
Change
.
24h Vol
$.
Holders
.
STONK
S
bade
b
STONK
6GmA...UNgx
Market Cap
$.
Change
.
24h Vol
$.
Holders
.
José
J
bade
b
José
87CQ...1UJT
Market Cap
$.
Change
.
24h Vol
$.
Holders
.
IDOL
I
bade
b
IDOL
0x3b...ab07
Market Cap
$.
Change
.
24h Vol
$.
Holders
.
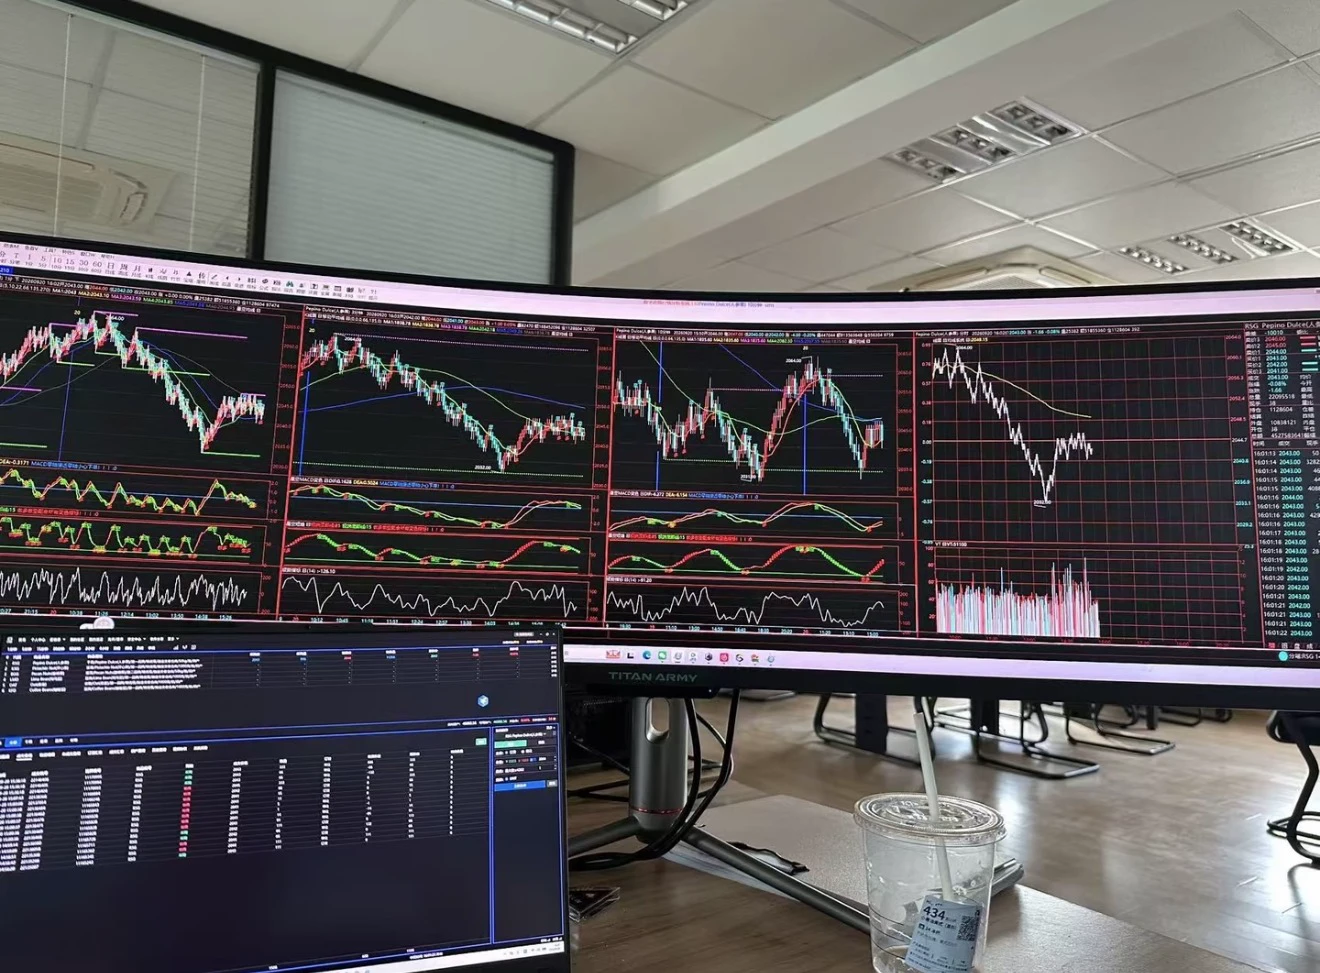
The right way to read naked candlesticks: from big to small, from stillness to movement.

Step one: Set the “map” first; don’t rush to look at candlestick patterns. Open the weekly chart and ask just one question: Are we at the mountaintop, halfway up, or in the valley? Sideways after a continuous decline → valley; look for long signals. Accelerating after a continuous rise → mountaintop; look only for short signals or stay out. In the middle → blank map; not trading is the best trade.

Step two: Find the “battlefield” on the daily chart. Draw two lines between a clear high and low (support/re
post-image
BTC-0.65%
Crypto Trade Now
live-cover
LIVE113
DANGCEM
We hit a new ATH of ₦1,490/share and got a nice rejection. Right now, what I’m seeing looks like profit-taking.
What do I see on the chart? I’m watching two regions.
₦1,154.80–₦1,192.20/share. This is the first zone I’m watching. If it holds, I see it as a decent region to start building a position.
₦1,000/share. If the first zone fails to hold, the next bus stop I’m watching is the ₦1,000 psychological level. If we get there and the bulls defend it, that’s where I’ll bring out the bazookas.
Both zones look beautiful to me. After the run DANGCEM just had, I want to see where the buyers
post-image
  • 1
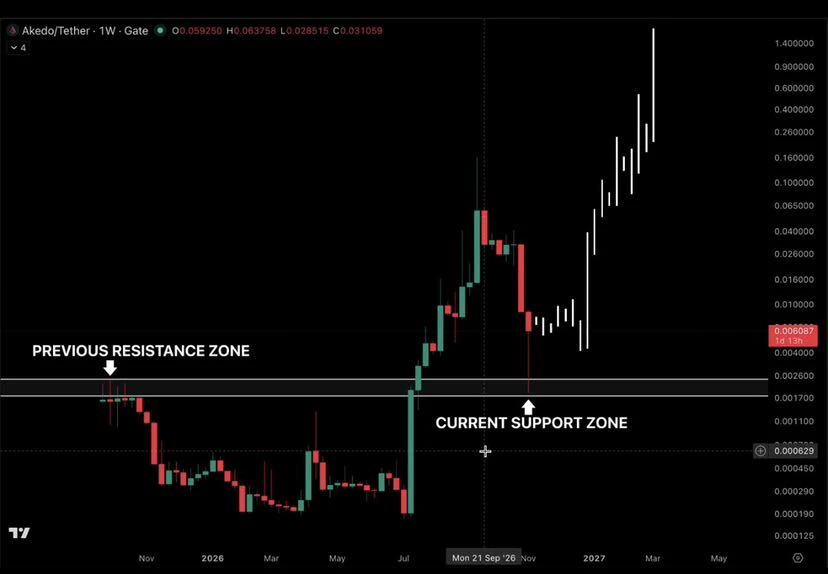
$AKE went from sitting in the basement to making a serious move

Now it's testing the same zone that previously capped its upside

This is where the chart gets interesting

Either the breakout gets validated, or the market reminds everyone that not every green candle deserves a victory lap

Waiting for some green candles here
post-image
AKE+6.07%
A bull market unfolds in three stages in chronological order, and the people fooling you are different at each stage. Stage 1: Recovery (the longest and most grueling). Prices move sideways near the lows for 3-6 months, with volatility narrowing until it drives you crazy. Every time the price rebounds to the same level, it gets slammed back down, forming a “ceiling.” Bad news comes out and prices no longer plunge—negative news losing its impact is the first real signal. On-chain: long-term holders start accumulating, and exchange balances slowly decline. This stage has no rush of excitement. M
post-image
BTC-0.65%
ETH-1.23%
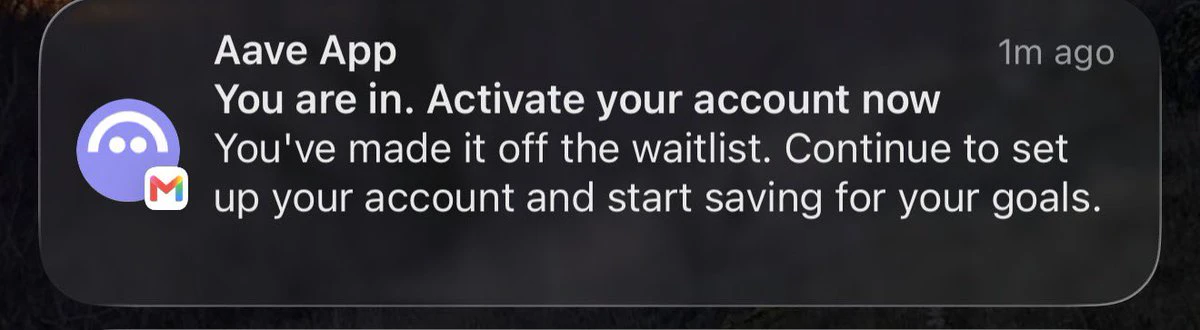
almost forgot I signed up for this, they put me on waitlist for 8 months
already found better alternatives too
how can they expect people to wait 8 months to use their app?
post-image
SOL | Short 🔴 | Bearish | 15m24h: -0.68% | Volume: 470.3M USDT Short rationale: Price below EMA200; EMA20/50/200 are bearishly aligned; RSI14 is 43.0; MACD histogram is negative; ADX14 is 18.3; volume is 0.60 times the 20-candle average; trend pullback/continuation. Entry: 89.5 Stop loss: 89.9345 Take-profit 1: 88.9569 | Take-profit 2: 88.6311 | Take-profit 3: 88.1966 Entry for reference only; do not chase the price. The strategy is invalidated if the stop-loss level is hit. Technical analysis strategy only; not financial advice. $SOL
post-image
SOL-0.77%
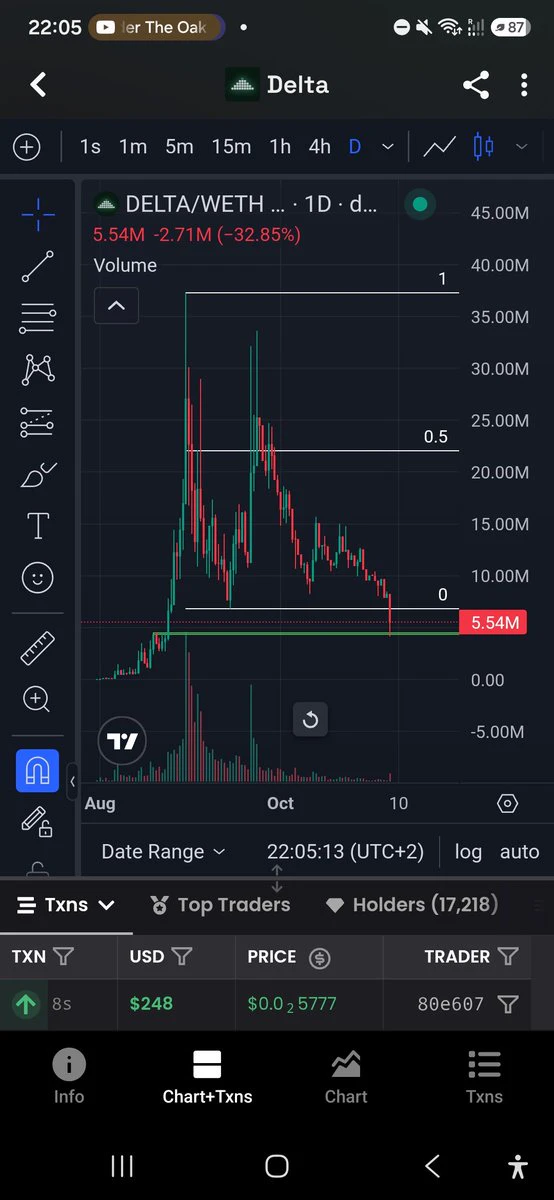
Bought $DELTA @deltaliquidity here on the capitulation/FUD
post-image
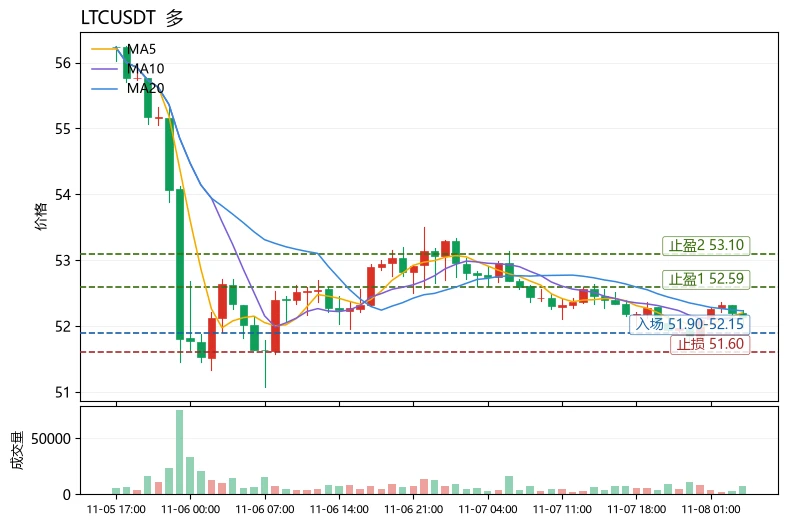
$LTC Current price: 52.14. The first resistance above is the Bollinger upper band at 52.59, and support below is the Bollinger lower band at 51.87. These two levels are where bulls and bears are currently locked in a short-term battle. Why give the price levels before explaining the logic? Because the first step in reading a chart is always to establish your bearings, not to predict.

Using LTC as an example, here's a reusable way to assess trend health: moving averages show direction, MACD shows momentum, and RSI shows positioning. A healthy trend requires all three to align. Currently, MA5=5
post-image
LTC-0.09%
PEPE+0.97%
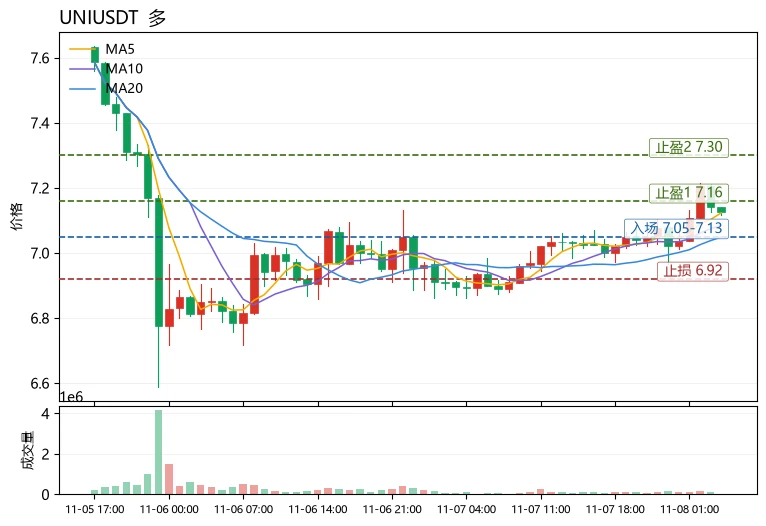
Bro, go long on $UNI and $MET ♥️🤝$UNI . Long trade entry price: $7.10–$7.15 Take-profit 1: $7.30 Take-profit 2: $7.50 Final take-profit: $7.70 Stop-loss: 6.85 MET long trade entry price: 0.320–0.326 Take-profit 1: 0.335 Take-profit 2: 0.345 Final take-profit: 0.355 Stop-loss: 0.312
post-image
UNI+3.05%
MET-0.33%
Many people go long as soon as the price moves above the moving averages, but overlook a key question: the “health” of the trend. Being above the moving averages does not mean the trend is healthy. Excessive price deviation from the moving averages, an overheated RSI, and an excessively positive funding rate are often signals of accumulating short-term risk. Take $UNI as an example: the current price is 7.125, MA5=7.1232 has crossed above MA20=7.0487, and the moving averages are in a bullish alignment—the first step toward establishing a trend. But to assess its health, look at two things: fi
post-image
UNI+3.05%
TRX+0.42%
MET-0.33%
BTC ETH MARKET PREDICTION
live-cover
LIVE37
$YB SHORTYB hasn't managed to defend its earlier price levels. Sellers still have an opportunity to push this market lower.entry: 0.05113tp1: 0.05021tp2: 0.04928stop: 0.05266
post-image
YB+2.91%
$ONE and $KOMA have both seen their upward momentum weaken noticeably after a rapid rally, with signs of exhaustion emerging in the market. I personally think a pullback is likely next, and I’ve already started building short positions.
$ONE futures short plan: Entry at 0.00240, first target at 0.00156, with defense at 0.00269.
$KOMA futures short plan: Entry at 0.01648, target at 0.01423, stop-loss at 0.01710.
The above is only a personal trading idea and does not constitute investment advice. Futures leverage carries extremely high risk, so please manage your position carefully.
post-image
KOMA-3.91%
Not even the s&p can keep this floater down
post-image
SPX+0.33%
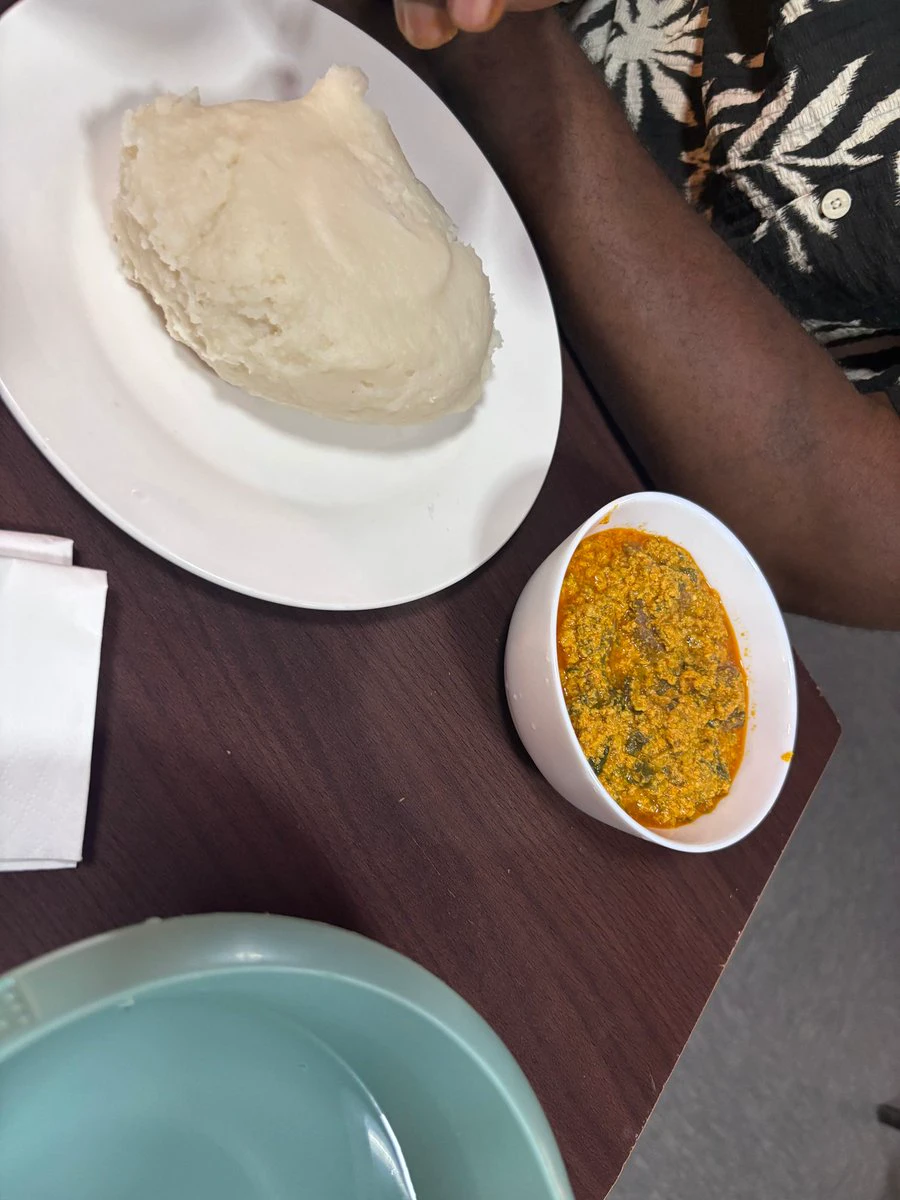
this why I wasn’t active today
Pardon the pounded yam and egusi, it was the best I could get here
post-image
Load More

Join 40 M users in our growing community

⚡️ Join 40 M users in the crypto craze discussion

💬 Engage with your favorite top creators

👍 See what interests you

Trending Topics

USAIStocksHitHard

21.24k Views3.67k Discussing

U.S. stocks sold off sharply on Thursday, November 5 (UTC). The Nasdaq closed down around 5.5%, entering correction territory, while the Philadelphia Semiconductor Index plunged roughly 12%, with chip stocks including $NVDA and $AMD posting steep losses. Beyond profit-taking, investors are growing concerned about the pace of AI data center construction, capital spending, and future returns on investment. The key question now is whether the AI sector’s lofty growth expectations need to be repriced. Where do you think the next opportunities will emerge: chip stocks, tech giants, or other sectors?

USNonfarmPayrolls

34.98k Views4.34k Discussing

StakeOnLaunchpoolToShare450KVLX

10.25k Views829 Discussing

View More