Square
Following
Hot
News
Notifications
Profile
Share your thoughts
placeholder
Article
NASA hosts its first aerospace expo in Florida to celebrate America’s 250th anniversary, showcasing new aircraft, lunar plans, and a technology extravaganza featuring the president.
The highlights of space exploration are packaged as a public celebration, while the technical details remain behind the exhibition booths.
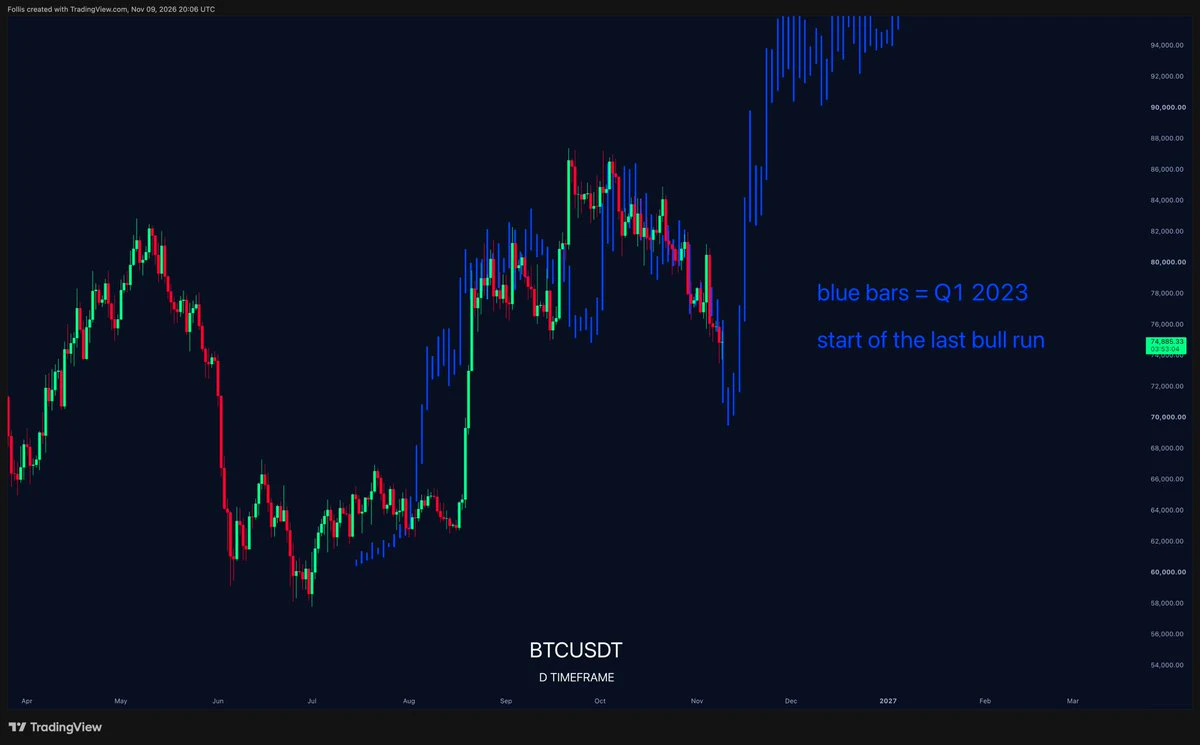
$BTC
post-image
BTC-0.67%
Trading at $134 over the weekend, SPCX rose 7.39% on Monday to reach $141.58, following Musk’s remarks at the Baron Investment Conference. The SuperTrend indicator is currently green at the 136.07 level, signaling a "buy." But is this rally merely a boost driven by Musk’s claims, or is there a tangible financial transformation underpinning it?

$SPCX ‌
SPCX+5.90%
Trenches
牛逼
牛
bade
b
牛逼
0x96...7777
Market Cap
$.
Change
.
24h Vol
$.
Holders
.
PIEVERSE
P
bade
b
PIEVERSE
0x0e...25a9
Market Cap
$.
Change
.
24h Vol
$.
Holders
.
STONK
S
bade
b
STONK
6GmA...UNgx
Market Cap
$.
Change
.
24h Vol
$.
Holders
.
BTC
B
bade
b
BTC
C5xp...pump
Market Cap
$.
Change
.
24h Vol
$.
Holders
.
ON
O
bade
b
ON
0x0e...1d48
Market Cap
$.
Change
.
24h Vol
$.
Holders
.
Democrats Sweep Congress: Is a Major Shift Coming for Crypto?
live-cover
LIVE86
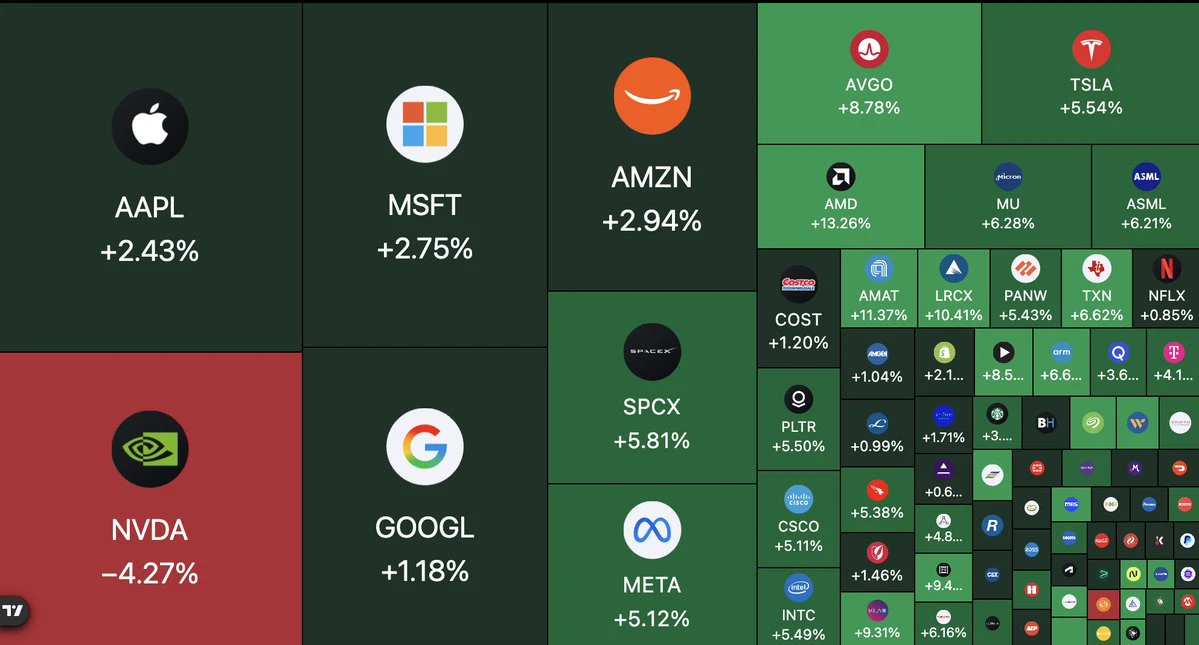
$1.8 Trillion added in US market today
S&P 500 +2.35
NAsdaq +2.74%
DOW +2.25%
Russell +3.16%
Memory stocks bounce after last week panic sale.
$MU +6.24%
$SNDK +6.16%
$AMD +13.2%
$INTC +5.49%
$WDC +9.86%
$STX +10%
$CRWV +5.56%
$SOXX +7.52%
post-image
SPX500+0.19%
NDAQ+1.29%
DOW-1.40%
MU+6.42%
SNDK+6.27%
$SOXL $TQQQ My positions today totaled 300k U from the low to the high, and I’ve secured all the profits. I’ll leave the gains from here on to others. Thanks, market
post-image
SOXL-1.16%
TQQQ+10.32%
We have all experienced that familiar feeling in our portfolios at some point: an asset climbs for a long stretch, then suddenly pulls back, leaving you wondering—has the trend ended, or is it just catching its breath? Looking at the GateToken chart, we find ourselves in exactly such a moment. The price has retreated from 11.52 to 9.62. The SuperTrend indicator is flashing red at 10.42, signaling a bearish trend in the short term.

This isn’t a situation that warrants panic, but it’s also not a signal to simply brush off as "business as usual." In short, the indicators suggest that bullish mom
GT-2.41%
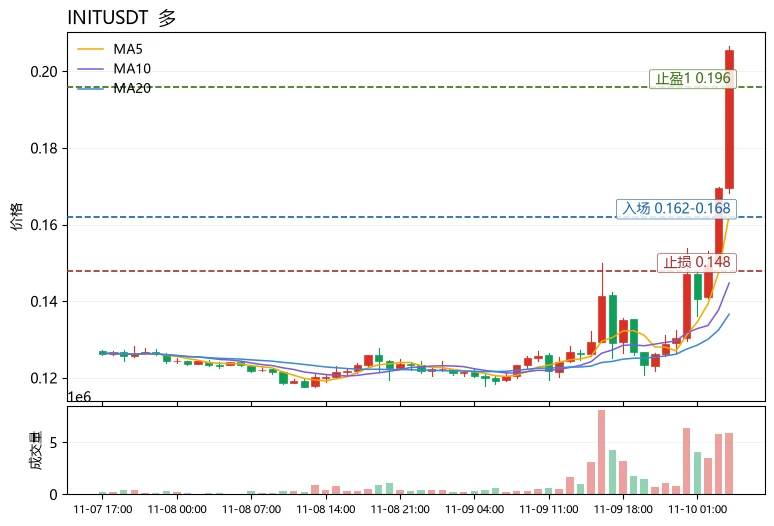
Chasing rallies and selling lows is the most common pitfall in technical trading: seeing a big bullish candle and rushing in with a market order without checking the moving-average deviation or the price’s position relative to the Bollinger Bands often means buying at a short-term emotional peak. Take $INIT as an example: the current price of 0.20566 is far above MA5 (0.162438) and MA20 (0.136612), and is trading above the upper Bollinger Band at 0.175558, a typical overbought extension; RSI is as high as 82.4, while the MACD histogram remains bullish at +0.006567, but its slope is unlikely t
post-image
INIT-1.74%
$BTC US stocks have all rebounded; buy the dip on all altcoins
BTC-0.67%
$ARIA At $10, you can enter now; gains are strong
post-image
ARIA+22.03%
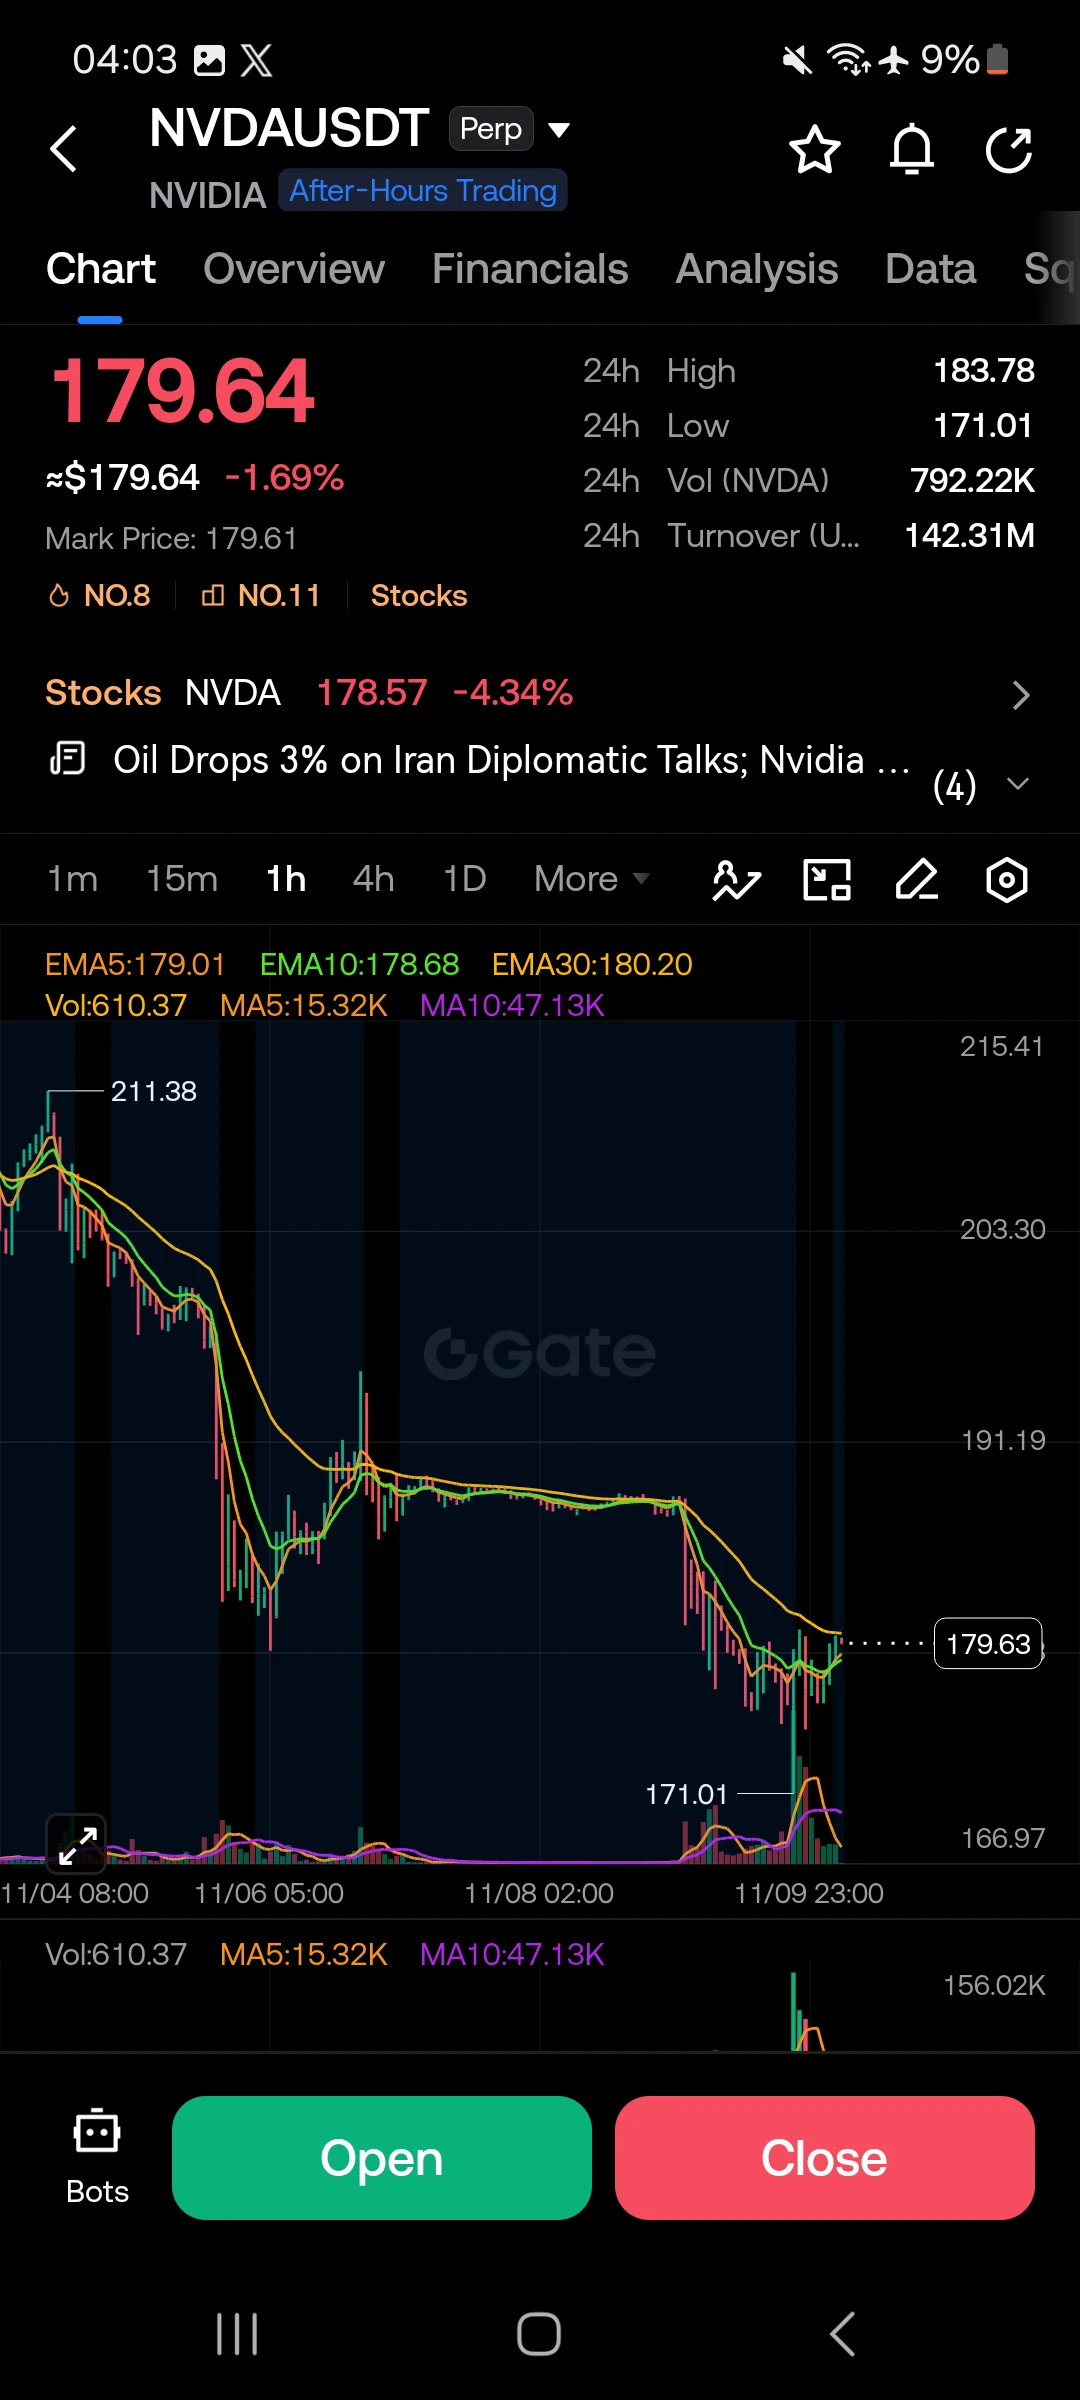
$NVDA ‌$NVDA: Is This a Recovery or Just a Temporary Bounce? 👀

NVIDIA is trading around $179.64, down 1.69% over 24 hours.

But there's something worth watching.

Price recently dropped to $171.01 before buyers stepped in and pushed it back toward $180.

Here's what matters now:

- $171: Recent local low.
- $179–180: Immediate decision zone.
- $183.78: 24H high and a level to watch for renewed strength.

The bigger trend still looks weak. Price needs to reclaim higher levels before calling this a genuine recovery.

I'm watching buyer strength around $180.

Will NVIDIA recover, or will selle
post-image
NVDA-4.34%
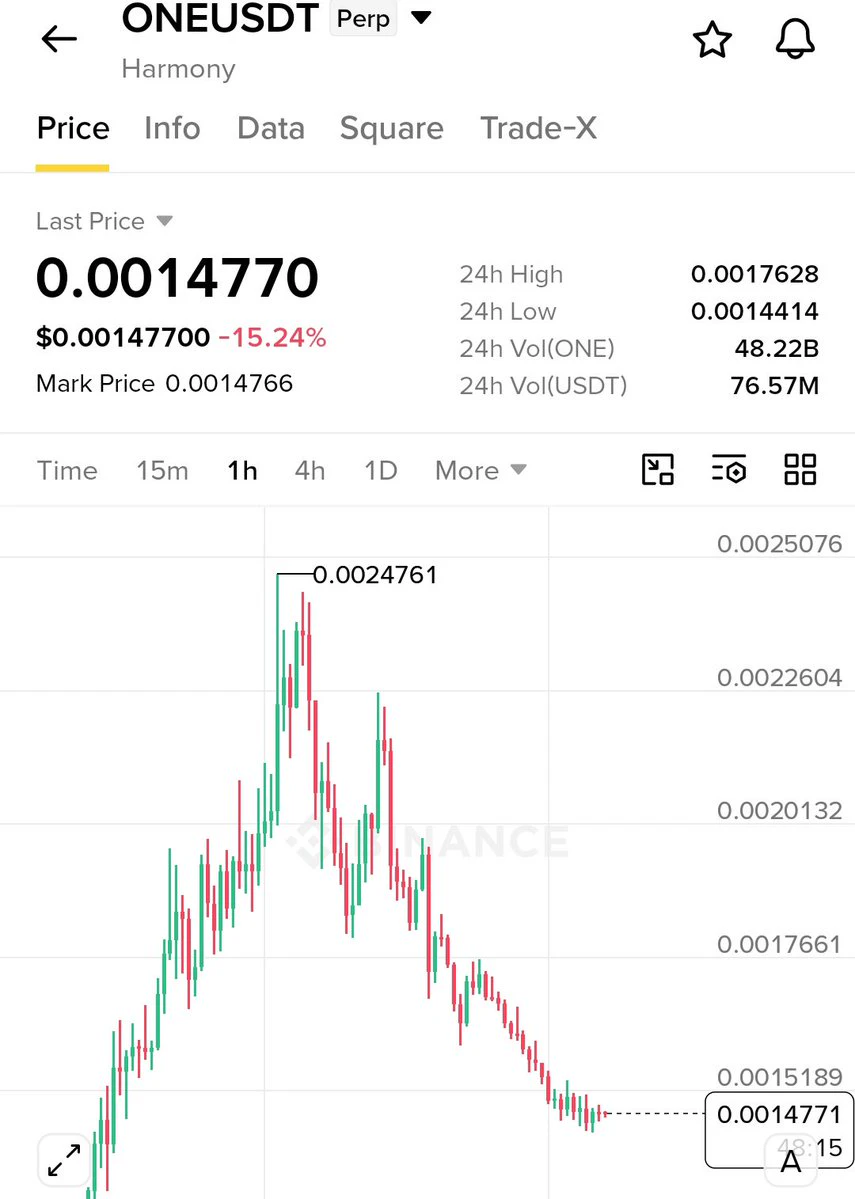
$JCT and $ONE are both trending among the BIGGEST LOSERS right now.
Their accuracy speaks for itself.
I shared just ONE level for $ONE, and it crashed right from that level. Many people made massive profits.
Less noise, more results. You don't have to trust me. Just trust my charts.
I promised to make trading a child's play for you. I'm working towards that promise.
post-image
JCT-3.26%
Layout: Bitcoin, Ethereum, Dogecoin
live-cover
LIVE994
  • 1
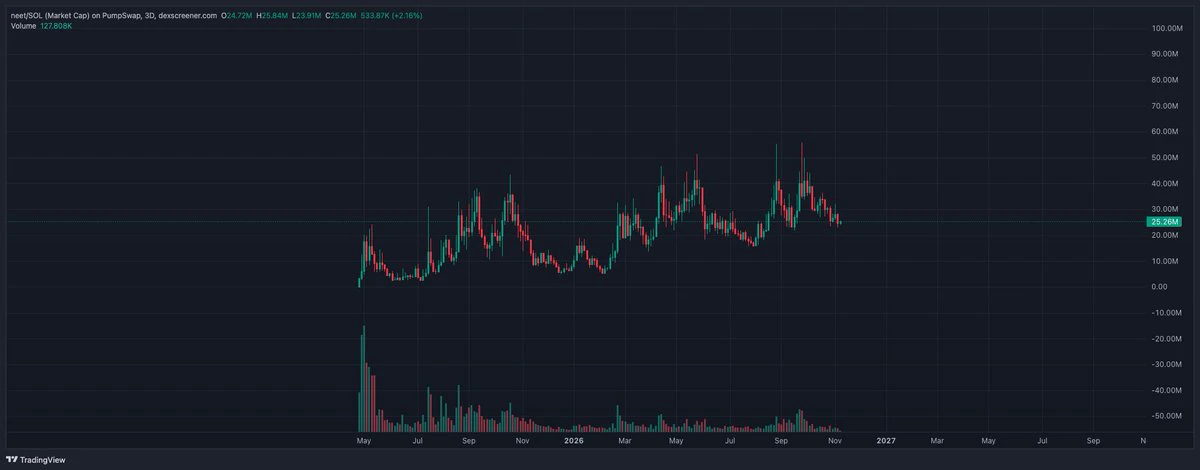
Tempted to reposition back into solana:Ce2gx9KGXJ6C9Mp5b5x1sn9Mg87JwEbrQby4Zqo3pump because the word is starting to get viral with unemployment tiktoks and reels it could run hard on second wave of onchain memes. + chart is unbelievably strong considering it launched last year April. Is this a good decision? I really believe so tbh.
post-image
SOL-0.77%
Every time “turning 1,000 into 100k” comes up, there are always three comments in the replies. Let’s break them down one by one.
“My friend did it.”
If your friend did it, how much is in his account now?
If someone shows you a screenshot from three months ago, that’s not a track record; that’s a historical artifact.
People who consistently pull it off share one trait: they don’t urge you to go all-in; they tell you to leave yourself an exit.
Those urging you to get in are mostly hoping you’ll provide the exit liquidity for them.
“Just keep rolling it over, one trade at a time.”
Rolling over yo
post-image
BTC-0.65%
Amundi, which manages €2,579bn, now has more tokenized assets onchain than BlackRock and its $15.5 trillion: $2,513,837,705 against $2,466,650,508.
Amundi's total rose 23.64% in the past 30 days, with ~$1.8B of it on Stellar.
@Amundi_ENG @StellarOrg
XLM-0.64%
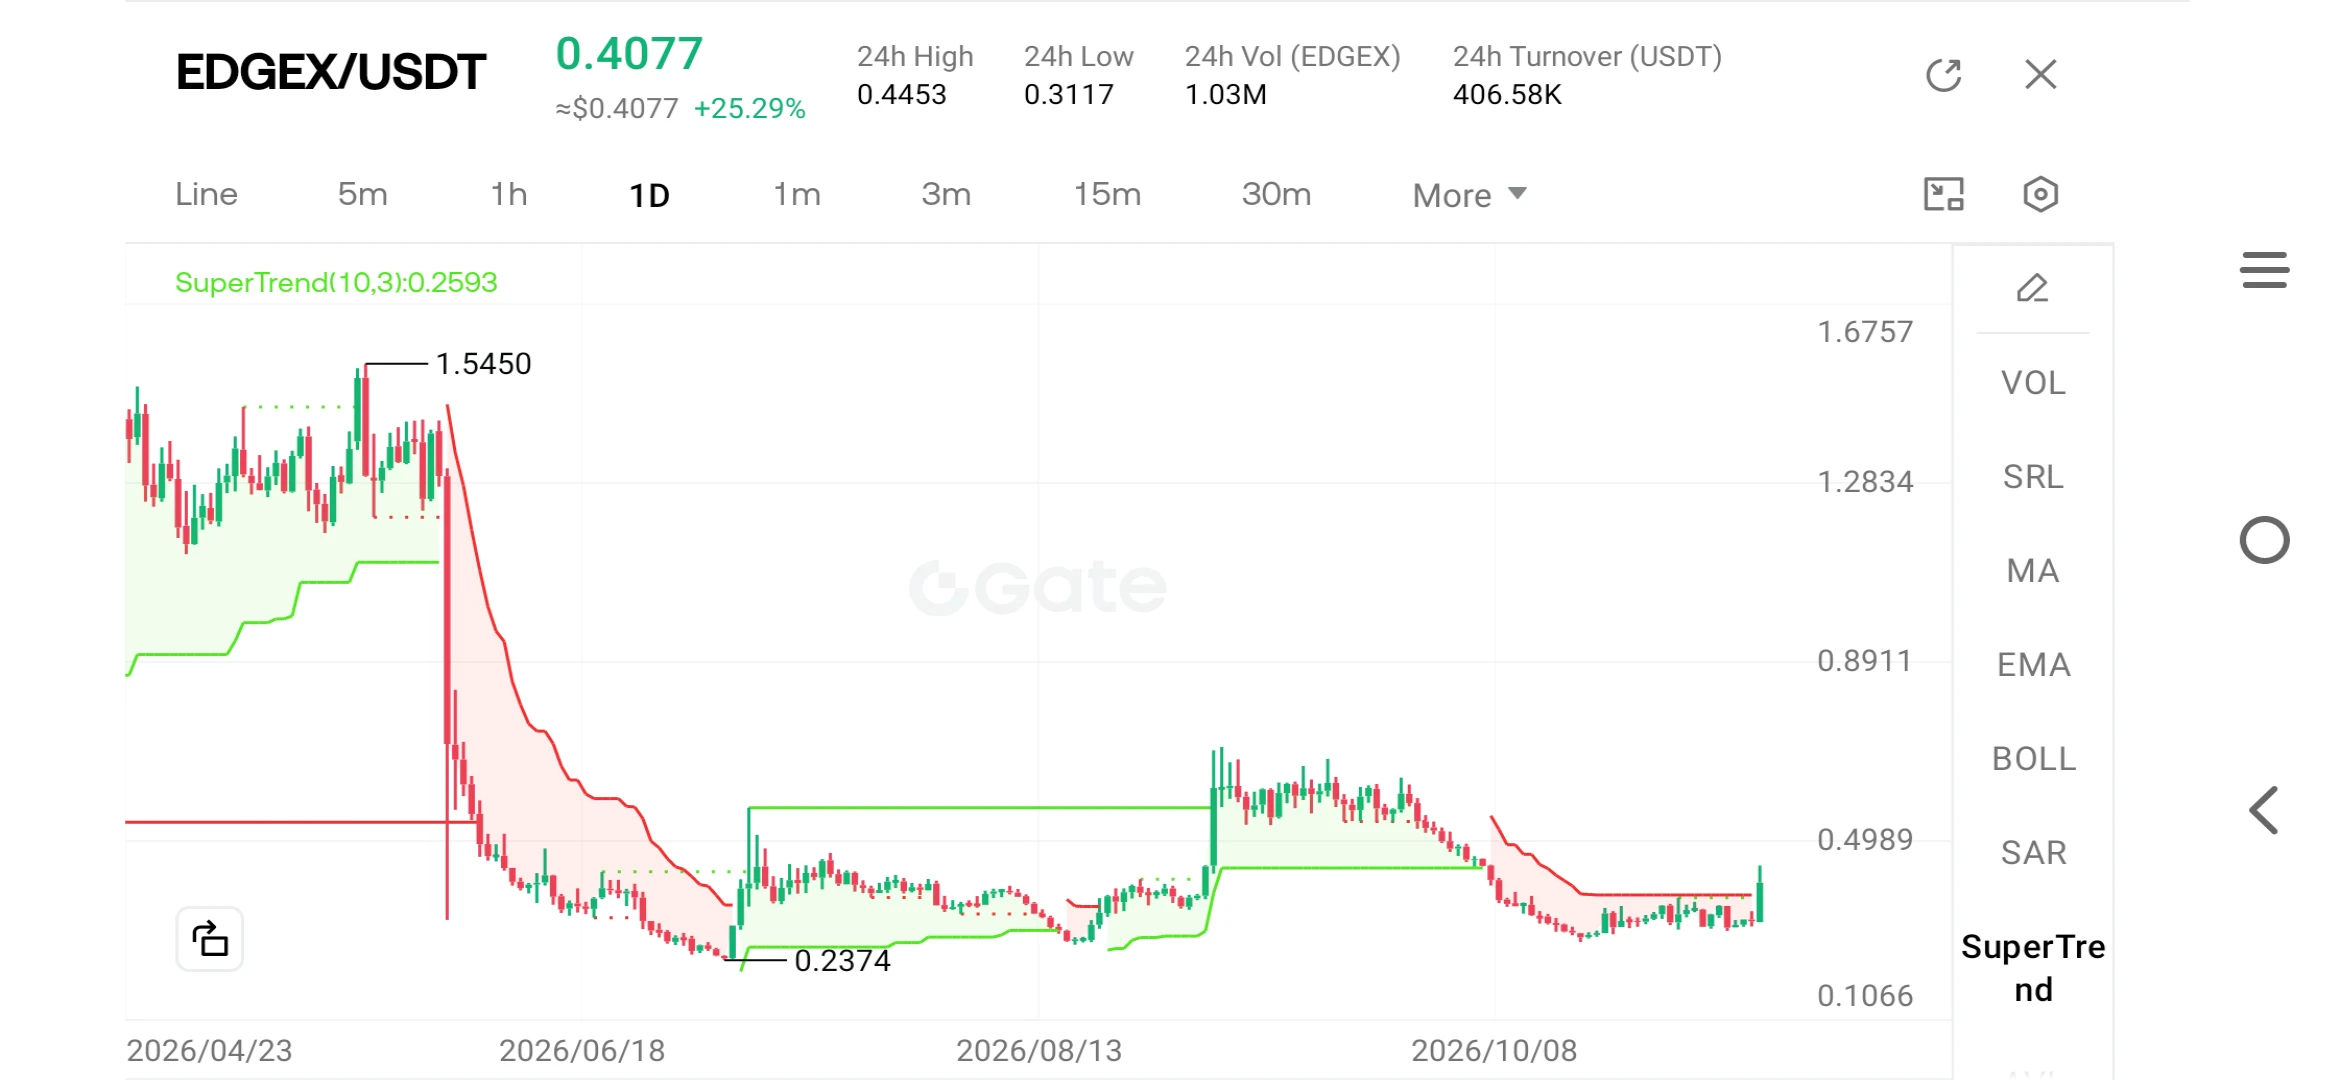
Today’s chart looks exciting at first glance. EDGEX is trading around $0.4077, up 25.29% in 24 hours. The daily range was $0.3117 to $0.4453, and turnover on this venue was about $407K.

But the excitement fades when you zoom out. The peak on the chart was $1.5450 back in the spring. The low was $0.2374. That means price is still about 74% below its high, and about 72% above its low. In other words, today’s move is a bounce inside a large downtrend, not a reversal yet. Treat it that way until it proves otherwise.

SuperTrend on the daily chart appears to have flipped bullish on today’s candle.
post-image
EDGEX+1.20%
BTC-0.67%
ETH-1.26%
SOL-0.77%
XRP-1.15%
One of the world's biggest stock exchanges is giving $AVAX a central role in moving stocks onto the blockchain.
New York Stock Exchange plans to use Avalanche as the main ledger for clearing and settling trades on its upcoming tokenized-stock venue. Once regulators approve it, the venue would trade around the clock.
post-image
AVAX-0.10%
Believe in something
$BTC
post-image
BTC-0.67%
  • 1
$SOL is currently at 86.74, down 2.59% over 24H. 1H/4H trends are weak, and the 4H RSI is oversold. 1H resistance is 88.46, with support at 85.14; 4H resistance is 91.62, with support at 85.02. If price holds above 88.46 or breaks below 85.14, watch whether volume reaches 0.07 times the 20-candle average. In the review, assess whether the hold above 88.46 is effective and whether price can recover after losing 85.14; volume confirmation is key. Market volatility is high; for observation only.
post-image
SOL-0.77%
Is it realistic to turn 1,000u into 100ku in the crypto market in the short term?

No. Turning 1,000 into 100k is a 100x return. That number isn’t just “hard”—it’s a whole different beast.

Let’s work out just how far 100x is:
At 20x leverage, going all in, the price only needs to move 5% for your account to double.
100x means doubling 7 times in a row (2 to the power of 6.64 ≈ 100).
And just one 5% move in the opposite direction means -100%—you’re wiped out.
Getting all 7 right, assuming a 50% win rate, has a probability of 0.78%; after fees, funding fees, slippage, and wicks, the actual odds
post-image
BTC-0.65%
ETH-1.23%
Load More

Join 40 M users in our growing community

⚡️ Join 40 M users in the crypto craze discussion

💬 Engage with your favorite top creators

👍 See what interests you

Trending Topics

USCPIDataIncoming

44.29k Views2.03k Discussing

The U.S. October CPI report will be released on November 10 at 8:30 a.m. ET. September CPI came in at 3.7% year over year, and markets will be watching closely for signs that inflation is cooling, especially in core CPI. A softer-than-expected reading could strengthen rate-cut expectations, while hotter inflation may pressure risk assets through higher Treasury yields and a stronger dollar. How do you think this CPI print will move $BTC, U.S. stocks and gold?

RedBullDoublePodiumInBrazil

9.98k Views30.59k Discussing

BTCFlashCrash

220.49k Views66.6k Discussing
View More