













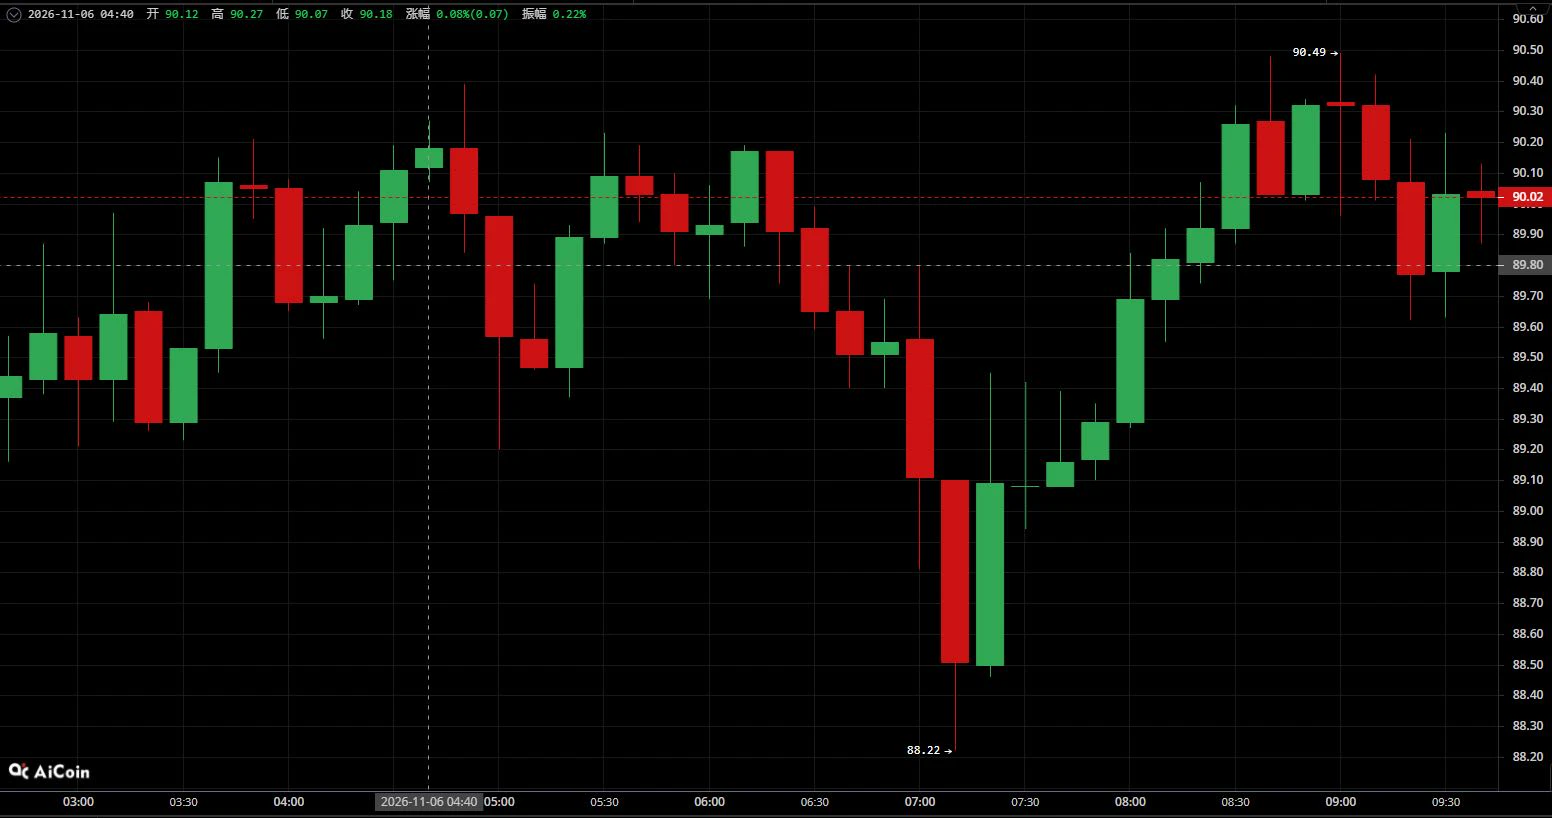





The shift from green to red numbers on stock market screens is not the real news; the true story lies in the fundamental mental shift behind that red.
What unfolded in the U.S. markets on Thursday was not merely an ordinary sell-off, but a profound rupture in how the "artificial intelligence trade" is valued and how its risks are perceived. As the Nasdaq closed the day down 5.5%, the semiconductor index suffered its worst performance since 2020, plunging as much as 12% in a single session. Nvidia fell 9%, AMD and Micron dropped 17% each, and Qualcomm slid 12%—altogether, approximately $2.5 trillion in market capitalization evaporated.
What lies on the surface of this sell-off?
The spark was ignited by concerns regarding potential regulations on data centers and AI infrastructure following the election results. Investors began to price in the possibility that the construction of data centers—the backbone of the AI economy—might slow down. According to an analysis by one firm, roughly 30% of the projected data center capacity in the U.S. through 2028 is now at risk due to construction delays. A disappointing earnings outlook from a major chipmaker proved to be the final straw.
However, the core shift is that the AI narrative has evolved from a simple "growth story" into a rigorous test of profitability and financing. Valuations that ballooned during years of low interest rates can no longer be sustained by the same narrative in an environment of high interest rates and tighter financial conditions. The deleveraging process that funds have been undergoing for months was already a clear sign that this mental shift was well underway.
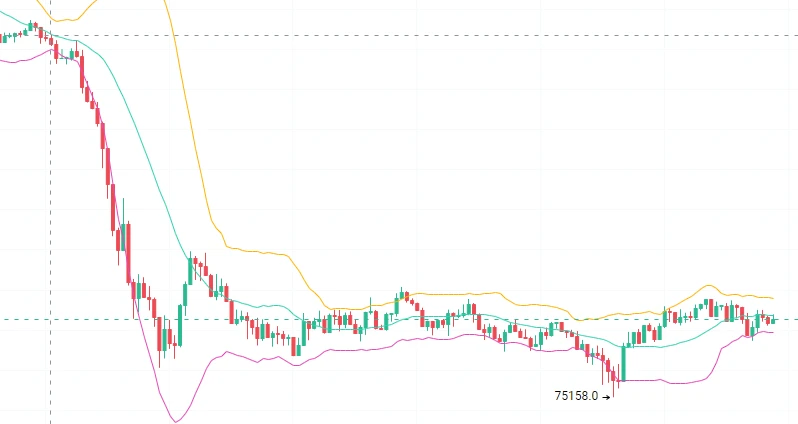
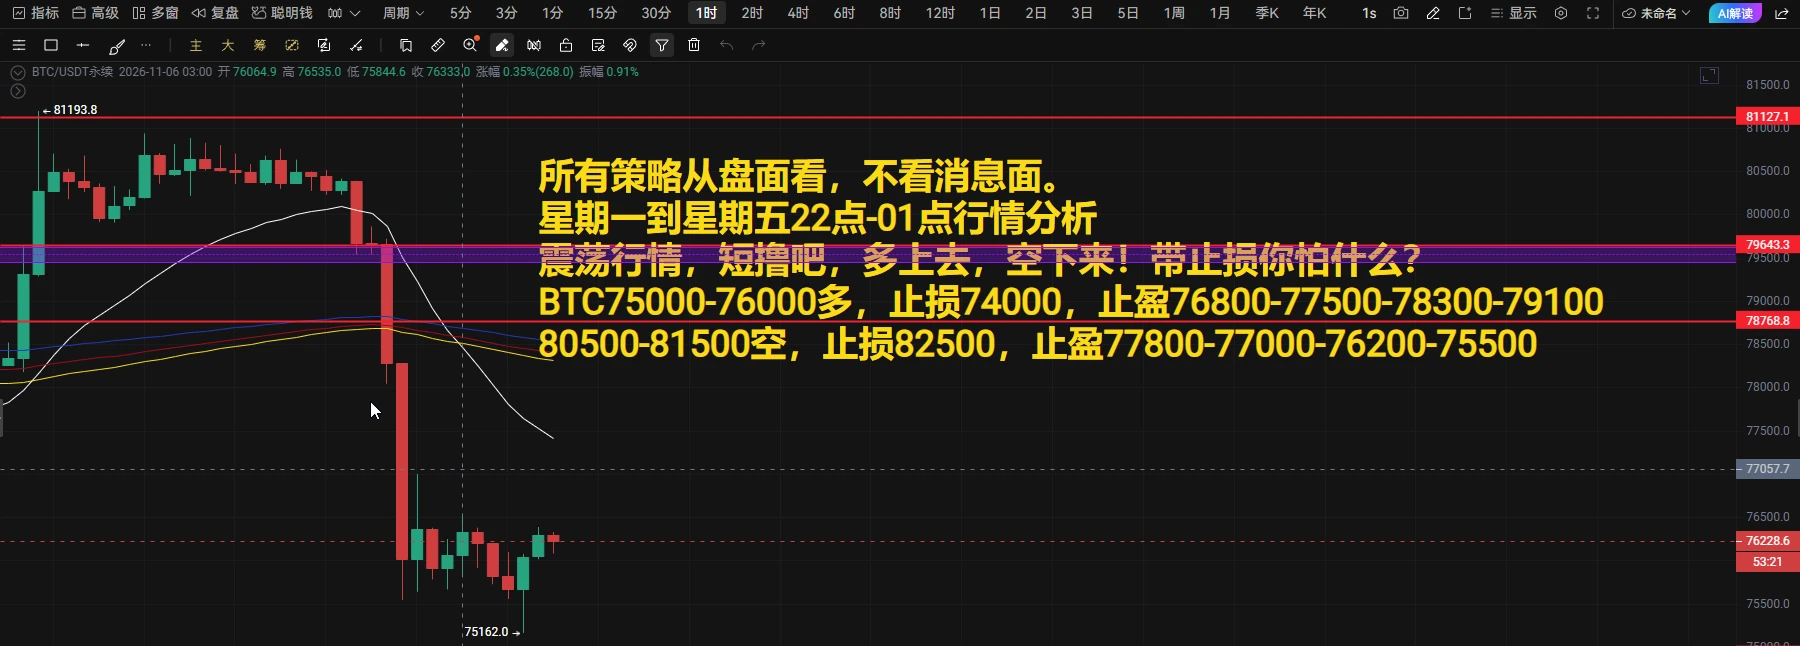
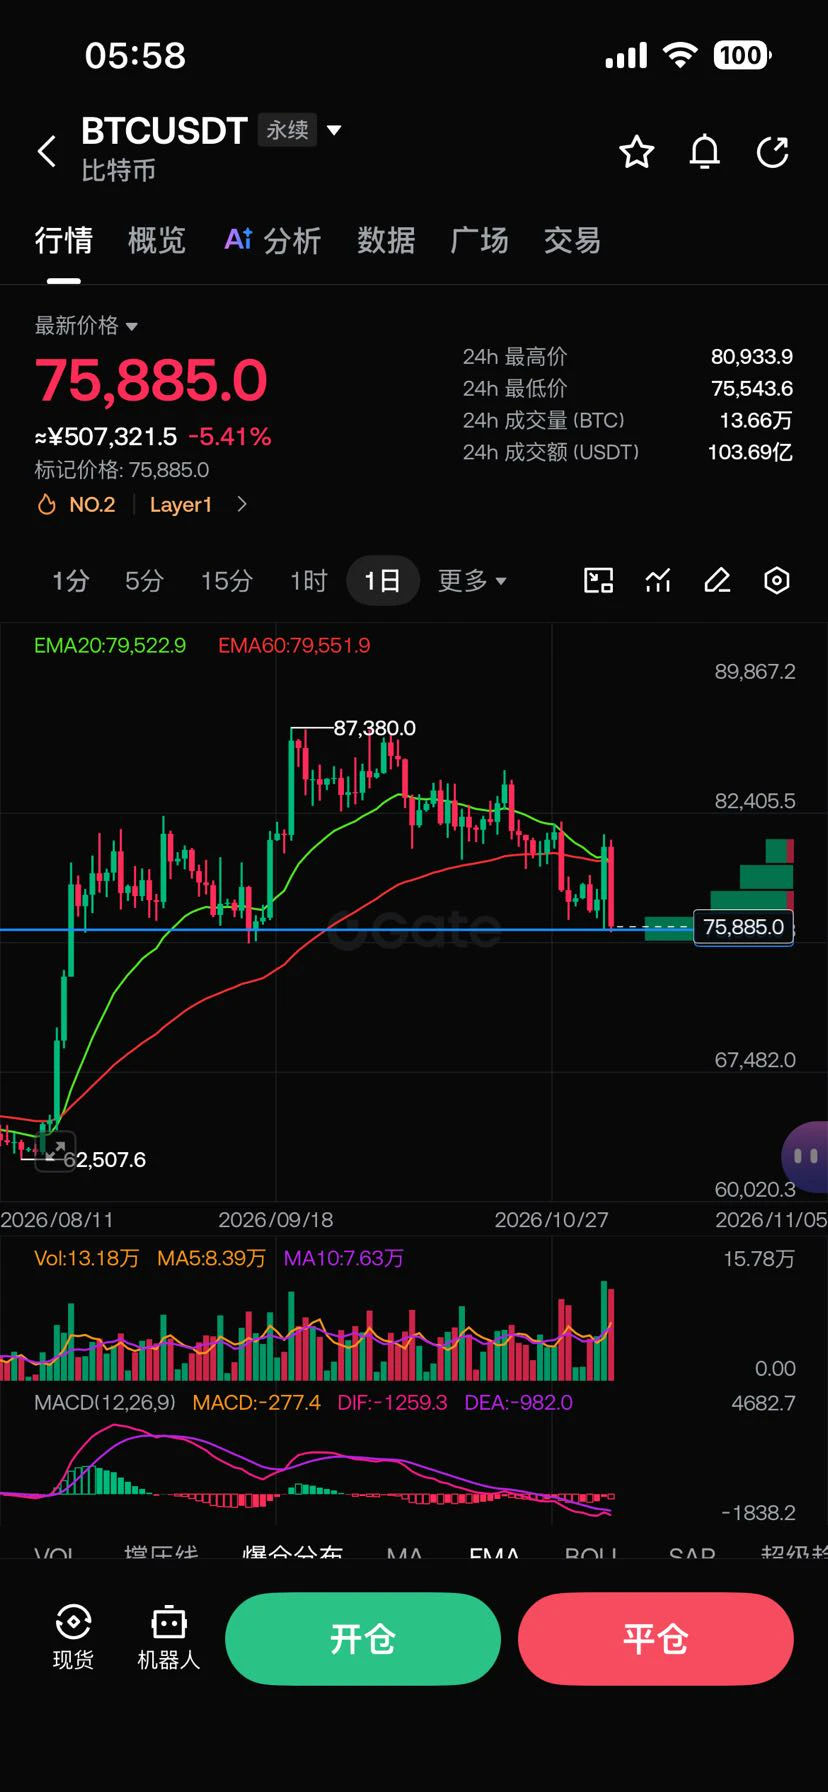
Why couldn't crypto escape this sell-off? The crypto market was not immune to this sell-off. On Thursday morning, Bitcoin was trading above $80,000, only to fall below $76,000 within hours, while Ethereum lost more than 8% of its value. The total crypto market capitalization shrank by approximately $137 billion.
The underlying cause is not merely a deterioration in general risk appetite, but also the tangible link crypto has forged with artificial intelligence infrastructure. Major Bitcoin miners are selling off their holdings to finance AI data centers; consequently, any instability in the data center narrative directly impacts Bitcoin supply and the economics of mining. Leveraged positions turned the decline into a wave of panic selling—roughly $370 million worth of leveraged crypto positions were liquidated in just one hour, the vast majority of which were bullish bets.
Is this a correction, or a new regime?
The market is currently pricing in two distinct scenarios. On one hand, some argue that this is merely a temporary correction—a liquidation of overheated AI-related positions. On the other, some believe that AI valuations remain detached from reality and that this does not represent a buying opportunity.
What matters is not so much which side is correct, but rather recognizing that the market is no longer driven by the same narrative. The triad of valuation, policy, and liquidity is being recalibrated.
The "AI trade" was fueled for years by low interest rates and abundant liquidity; now, high interest rates, tighter financial conditions, and regulatory uncertainty have entered the equation. The fact that 30% of data center capacity is at risk is not merely a construction issue; it is a matter that affects the timing of the entire supply chain.
On the crypto front, the liquidation of assets by miners and the unwinding of leveraged positions illustrate how macro shocks can trigger a chain reaction. In other words, a reassessment of valuations in the artificial intelligence sector can directly impact the supply of Bitcoin.
There is no single answer to whether this wave of selling marks the beginning of the end for the AI trade, or if it is simply a sharp "breather" within a long-term bull market.
What you should monitor is whether valuations are being validated by profitability, how the regulatory framework regarding data center permits takes shape, and whether spot demand emerges once leveraged positions have been cleared out. In the face of macro shocks, the narrative shifts rapidly, but it takes time for the true direction of capital flows to become clear.
This content is for informational purposes only and does not constitute investment advice.
#USStocksFaceHistoricSelloff
#Gate股票畅聊季 #GateStockTalkSeason #GateSquareTradingChallenge
#ShareWeekly
$US30 $NAS100 $AMD $MU $NVDA
What unfolded in the U.S. markets on Thursday was not merely an ordinary sell-off, but a profound rupture in how the "artificial intelligence trade" is valued and how its risks are perceived. As the Nasdaq closed the day down 5.5%, the semiconductor index suffered its worst performance since 2020, plunging as much as 12% in a single session. Nvidia fell 9%, AMD and Micron dropped 17% each, and Qualcomm slid 12%—altogether, approximately $2.5 trillion in market capitalization evaporated.
What lies on the surface of this sell-off?
The spark was ignited by concerns regarding potential regulations on data centers and AI infrastructure following the election results. Investors began to price in the possibility that the construction of data centers—the backbone of the AI economy—might slow down. According to an analysis by one firm, roughly 30% of the projected data center capacity in the U.S. through 2028 is now at risk due to construction delays. A disappointing earnings outlook from a major chipmaker proved to be the final straw.
However, the core shift is that the AI narrative has evolved from a simple "growth story" into a rigorous test of profitability and financing. Valuations that ballooned during years of low interest rates can no longer be sustained by the same narrative in an environment of high interest rates and tighter financial conditions. The deleveraging process that funds have been undergoing for months was already a clear sign that this mental shift was well underway.
Why couldn't crypto escape this sell-off? The crypto market was not immune to this sell-off. On Thursday morning, Bitcoin was trading above $80,000, only to fall below $76,000 within hours, while Ethereum lost more than 8% of its value. The total crypto market capitalization shrank by approximately $137 billion.
The underlying cause is not merely a deterioration in general risk appetite, but also the tangible link crypto has forged with artificial intelligence infrastructure. Major Bitcoin miners are selling off their holdings to finance AI data centers; consequently, any instability in the data center narrative directly impacts Bitcoin supply and the economics of mining. Leveraged positions turned the decline into a wave of panic selling—roughly $370 million worth of leveraged crypto positions were liquidated in just one hour, the vast majority of which were bullish bets.
Is this a correction, or a new regime?
The market is currently pricing in two distinct scenarios. On one hand, some argue that this is merely a temporary correction—a liquidation of overheated AI-related positions. On the other, some believe that AI valuations remain detached from reality and that this does not represent a buying opportunity.
What matters is not so much which side is correct, but rather recognizing that the market is no longer driven by the same narrative. The triad of valuation, policy, and liquidity is being recalibrated.
The "AI trade" was fueled for years by low interest rates and abundant liquidity; now, high interest rates, tighter financial conditions, and regulatory uncertainty have entered the equation. The fact that 30% of data center capacity is at risk is not merely a construction issue; it is a matter that affects the timing of the entire supply chain.
On the crypto front, the liquidation of assets by miners and the unwinding of leveraged positions illustrate how macro shocks can trigger a chain reaction. In other words, a reassessment of valuations in the artificial intelligence sector can directly impact the supply of Bitcoin.
There is no single answer to whether this wave of selling marks the beginning of the end for the AI trade, or if it is simply a sharp "breather" within a long-term bull market.
What you should monitor is whether valuations are being validated by profitability, how the regulatory framework regarding data center permits takes shape, and whether spot demand emerges once leveraged positions have been cleared out. In the face of macro shocks, the narrative shifts rapidly, but it takes time for the true direction of capital flows to become clear.
This content is for informational purposes only and does not constitute investment advice.
#USStocksFaceHistoricSelloff
#Gate股票畅聊季 #GateStockTalkSeason #GateSquareTradingChallenge
#ShareWeekly
$US30 $NAS100 $AMD $MU $NVDA