Square
Following
Hot
News
Profile
Share your thoughts
placeholder
Article
Short-term long $OGN
. On the 1-hour timeframe, after breaking out of the consolidation range, it continues to maintain a strong upward structure. Entry point 1: 0.0460 – 0.0465 (current price range) Entry point 2: 0.0435 – 0.0445 (near the retested support level) Entry point 3: 0.0412 – 0.0420 (deep EMA20 support level) Take profit: TP1: 0.0500 TP2: 0.0540 TP3: 0.0600 Stop loss: 0.0405 Position management: Allocate funds evenly across the 3 entry points, prioritizing waiting for a price pullback and avoiding blindly chasing the rise. Take partial profits when TP1 is reached; after the price c
post-image
OGN+82.57%
$HYPE Add to positions along the trend with unrealized gains#BTC回调触及81000美元 #作手分析
post-image
HYPE-2.10%
$SOL The overall crypto market is down at the moment, and that includes Solana. There were about 20 million in long positions in Solana that were closed.
The overall crypto market liquidated millions and millions today. Also, there were some outflows happening with ETFs of Solana happening.
However, you know, within a week or two, all of this is going to flip around. There is just too much interest in Solana and crypto as a hold. The trading volume is up over 48 percent for the day. Investors and traders are still trading Solana at a high level.
post-image
SOL-4.22%
  • 1
market updates on today $BTC & $XAU
live-cover
LIVE1,597
Hot CPI: A Rate Hike—or a Longer Wait for Relief?
Inflation can unsettle markets without forcing the Federal Reserve to raise rates.
The crucial shift is in the expected policy path, not the CPI headline alone.
Here is how to separate October tightening risk from a temporary market scare.
What would change?
In this hypothetical scenario, CPI exceeds expectations. That could strengthen October hike expectations, but the adjustment might instead mean fewer anticipated cuts or a longer hold. Without verified market pricing, assigning a probability would be speculation.
Composition matters: persis
post-image
xxx40xxx
Hot CPI: October Hike Risk or Delayed Rate Relief?
Markets can tighten financial conditions before the Federal Reserve changes rates.
An upside CPI surprise matters most when it changes the expected policy path—not merely the headline.
The distinction helps explain when pressure on crypto and U.S. stocks could persist.
A surprise is not a verdict
If CPI exceeds expectations, October hike expectations could rise. But investors might instead anticipate fewer cuts or a longer hold. Without verified starting probabilities, the magnitude of that shift remains unknown.
Persistence matters more than surprise alone. Broad-based core inflation would strengthen the tightening argument; an isolated energy increase would offer weaker evidence. Employment trends and Fed communication could reinforce or challenge either interpretation.
Where the pressure lands
If expected interest rates and Treasury yields rise, equity valuations could weaken as future profits are discounted more heavily. Earnings provide a separate test: resilient margins and guidance could cushion the impact, while deteriorating profits could compound it.
Crypto could face reduced speculative demand and tighter financing conditions. Leverage can amplify price moves, but losses are not inevitable: positioning and expectations already reflected in prices influence the reaction.
Strategy: separate confirmation from noise
A sustained rise in yields alongside restrictive Fed communication would strengthen the bearish scenario. Cooling underlying inflation or a reversal in bond-market repricing would weaken it.
One important countercase: weaker employment could reduce hike expectations yet still hurt stocks through recession fears. Easier policy expectations are not automatically bullish.
A disciplined framework watches yields, earnings guidance and crypto leverage together rather than chasing the first move.
Risk: Inflation releases can trigger reversals, slippage and leveraged losses. This is educational analysis, not personalized investment advice or a profit guarantee.
What evidence would persuade you that October’s dominant risk is renewed tightening rather than weakening growth, and why?
$BTC $GT $ETH
#ShareWeekly #weeklyshare #FedSeptemberMinutesLeanHawkish #GateSquare
repost-content-media
BTC-0.52%
GT-1.01%
ETH-2.94%
  • 1
This is my third year of smoking cigars, and I’ve fallen in love with them.
Seeing @cigrhabana ask what cigars represent suddenly made me want to talk about it.
I’ve always felt that the charm of cigars lies not only in the tobacco leaves and flavors, but also in the connections between people.
When friends gather together, light up a cigar, and talk about their recent lives and experiences, sometimes there is no need to say much. A glance or a laugh is enough to feel the understanding between them. Cigars represent not just a hobby, but also sharing and friendship.
Smoke rings are interesting
Ethereum SHORT SQUEEZE INCOMING ?
Funding turned negative across CEXs and DEXs during the dump, while $ETH bounced from $2,406 to $2,495.
Now price has hit its 4Hr MA7 near $2,496. This level is key 👀
•Hold $2,450 → $2,576 next
• Reclaim $2,580 → $2,650–$2,700
• Lose $2,405 → $2,357 retest
Funding is slightly positive again:
• BTC : +0.0066%
• ETH : +0.0011%
The bounce is real, but the reversal isn't confirmed yet.
When everyone’s shorting, a squeeze can surprise them. Don’t chase shorts into support!
#CEXandDEXFundingRatesTurnNegative
post-image
ETH-2.91%
BTC-0.53%
Taking a phone call while driving is unsafe.
And you should take care of other people's cars too.
You really don't know how to treat a lady with care.🙄
post-image
📢 LIVE STREAM ANNOUNCEMENT: Ethereum (ETH) Falls Below 2,700 USDT
⏰ Starting Time: 10:06 AM
🎙️ Today's Topic: Ethereum (ETH) falls below 2,700 USDT, with its 24-hour gains narrowing to just 0.20%.
🔗 Join the Livestream:
https://gate.com/live/video/e85d9480386845d8a01f7cce667e394b?type=live&stream_id=e85d9480386845d8a01f7cce667e394b&session_id=e85d9480386845d8a01f7cce667e394b-1791522235&ref=VFBHUV8LVQ&ref_type=104
📊 What Will We Discuss?
Ethereum's movement below the 2,700 USDT level raises important questions about market momentum, trading activity, and investor sentiment.
🔹 Key Discussio
post-image
ETH-2.94%
  • 1
Nasdaq $nas100
—does this count as a breakout followed by a pullback?
Ready to take off?
post-image
NAS100-0.51%
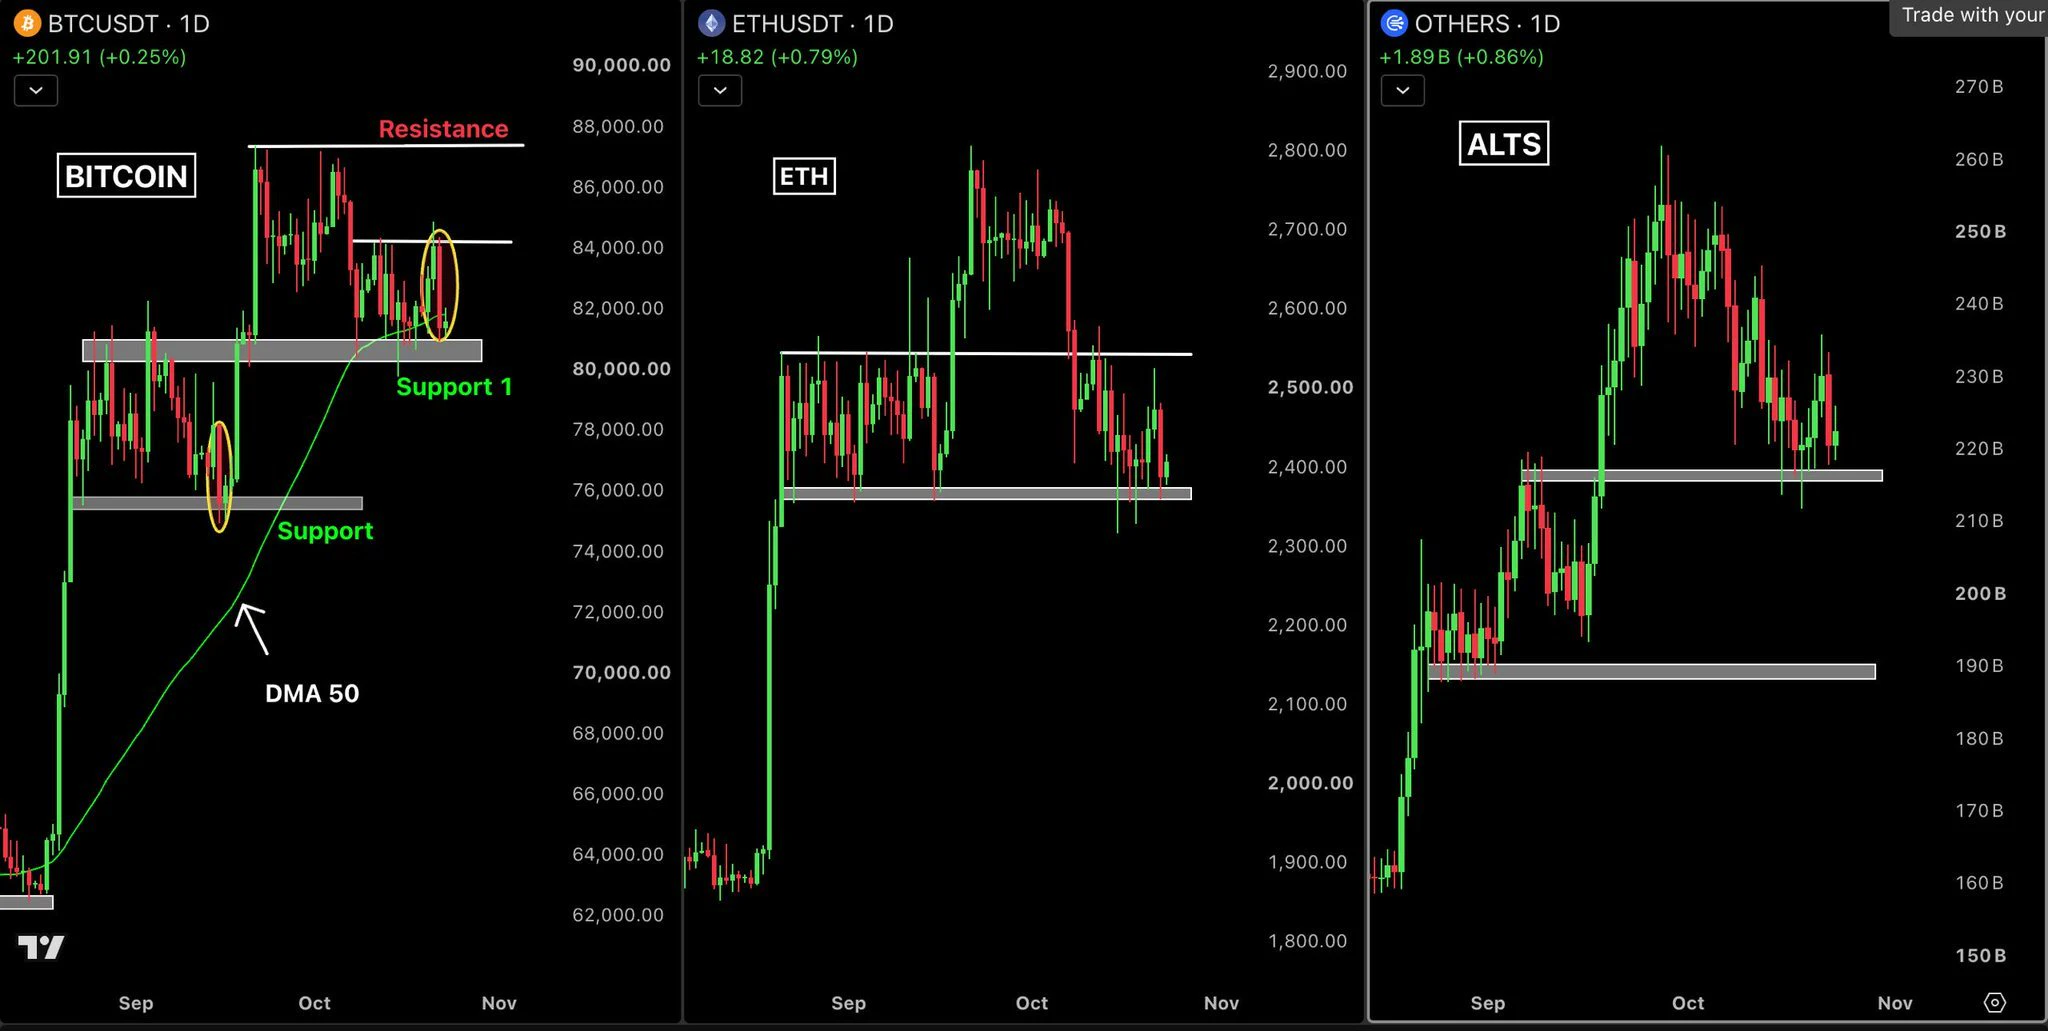
$BTC As I said, it is developing exactly as expected, friends!
BTC is following the path I previously pointed out. After falling toward the $80,500 support zone, Bitcoin rebounded and climbed back above $81,700, as expected. The reaction at the support level is progressing smoothly. Next, watch the $82,000–$82,500 range and wait for the next move; according to my chart, the upside target is $83,138. Patience and proper analysis are important. Let the chart speak for itself. Buy and trade $BTC
post-image
BTC-0.52%
I declare that robin has ushered in the great era of blockchain gaming.
post-image
My favorite projects right now:
solana:9CPfv7rc6Bd3jtovmZtf5Zy8bdvssv8c4BwzbGk147
solana:8nnaeWCw8mUypcGAgbmSuzAT85uWx4UN12adDrMhXrGF
solana:7KEPApdbBMByrmqihz3bht2uMhFQcatjfSFQCKq66kH3
SOL-4.20%
$STRK is the only asset in the current L2 sector to show independent strength. The outlook is bullish, but it is not advisable to chase at the current level; wait for a pullback.
The comparison is clear: during the same period, $UNI was down 5.91% over 24h and $NEAR was down 10.26%. Both have seen MA5 fall below MA20, while their RSI readings are only 43.9 and 47.4, respectively, indicating weak consolidation. Meanwhile, $STRK was up 39.13% over 24h, with MA5=0.063724 firmly above MA20=0.059057, a bullish moving-average alignment, and RSI=76.7 in the overbought zone but showing no bearish
post-image
STRK+42.79%
UNI-4.65%
NEAR-10.40%
$OGN Current price 0.04503, key watershed 0.0437 (MA5/MA20 convergence zone), overhead resistance 0.0516 (upper Bollinger Band). 24h surge of 98.55% and a 68.9% range across 30 candles indicate an extreme-volatility state, not the start of a trend but the point of highest risk premium.
The bias is bullish, but only enter on a pullback: RSI 64.5 is not yet overbought, and the bullish moving-average alignment support structure remains intact; however, the MACD histogram is -0.0008218 and has turned bearish, indicating that upward momentum is fading, so chasing the price is equivalent to catchin
post-image
OGN+82.57%
NEAR-10.40%
STRK+42.79%
$AIN Breakout imminent! All technical indicators have formed golden crosses—have you gotten on board? Where is the next target?#Gate.io 🔥🚀 #每周来晒
AIN+18.22%
#PLTR##帕兰蒂尔# The upside target of 201.43 submitted on August 28 was achieved today, October 9. As effortless as moving one’s arm. Figure 2 shares the monitoring points and future targets. $PLTR ‌
PLTR+3.21%
ETH rose 0.91% over a 15-minute window, representing a technical rebound after the previous pullback, driven by a recovery from oversold conditions. However, it lacks a clear event catalyst, while sell orders dominate the order book and liquidity remains thin, limiting the gain. ETH is down 3.71% over 24 hours and 8.48% over 7 days, with the medium-term outlook still weak. The sustainability of the rebound remains to be confirmed by trading volume and buying pressure.
post-image
ETH-2.94%
my first trade has successfully done
post-image
  • 2
Load More

Join 40 M users in our growing community

⚡️ Join 40 M users in the crypto craze discussion

💬 Engage with your favorite top creators

👍 See what interests you

Trending Topics

GateAtTOKEN2049

35.27k Views20.82k Discussing

Gate brought a series of major events to TOKEN2049 Singapore! From the official launch of Gate Money to the F1 Red Bull driver meet-and-greet and the Gate Gala, we witnessed a new chapter of "One Gate, Borderless Finance." Which moment from TOKEN2049 stood out most to you?

BTC Pulls Back to 81000

25.42k Views35.72k Discussing

AIStocksFallALABDropsOver9%

24.66k Views558 Discussing

View More