



Share your thoughts
placeholder
Article
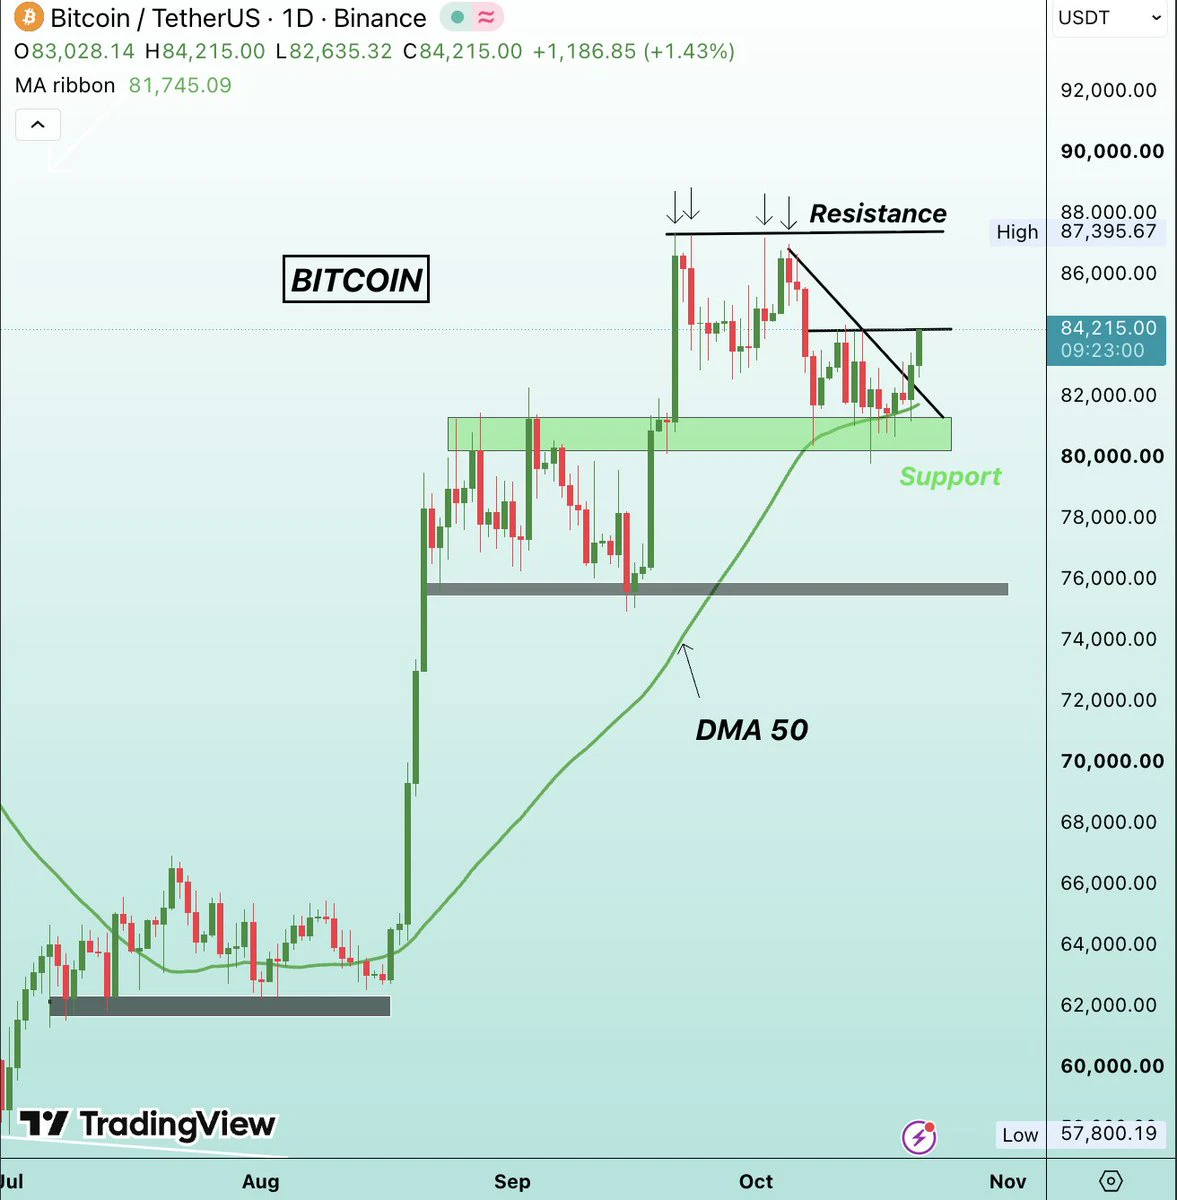
BTC & ETH Face Different Support Structures! Which Market Zone Could Attract Buyers First?
live-cover
LIVE1,014
Day 15. Today, I started leading trades with the smaller account. The smaller account made seven or eight tiny-position trades, with a 90% win rate and 20% profit, trading relatively conservatively. I can only comfort myself by saying that steady is fast, I guess. Leading trades really is different—every trade requires careful consideration. When the direction is right, everything is fine, but once there is a loss, I start calculating how much the followers will lose. Leading trades and trading on my own are truly very different. This will be another challenge: victory only, no defeat!!!
100U
ETH+0.73%
BTC+0.03%
Everyone’s long XRP at 1.42, but the 15-minute RSI just screamed 72—who’s the exit liquidity?

$XRP /USDT - SHORT

Trade Plan:
Entry: 1.4192 – 1.4238
SL: 1.4432
TP1: 1.4052
TP2: 1.3944
TP3: 1.3781

Why this setup?
XRP is stalling inside a 1D range, and the 4h signal flips SHORT at 1.4215.
- RSI (15m) at 72.61 = overheated, ripe for a snap-back.
- ATR (1h) is razor-thin (0.009) → volatility is coiling; the first push often fails.
- Entry zone 1.4192–1.4238 is a magnet, but TP1 at 1.4052 offers a 1.1% scalp *before* the daily trend decides.
Why now? The clock says 18:14 UTC—liquidity
XRP+0.84%
Most traders will ignore HOME/USDT right now—that’s exactly why I’m watching it.

HOME/USDT - SHORT

Trade Plan:
Entry: 0.0061 – 0.0061
SL: 0.0062
TP1: 0.0060
TP2: 0.0060
TP3: 0.0059

Why this setup?
Why now? The 4h signal screams SHORT with 95% confidence, but the 15m RSI (51.28) hasn’t confirmed weakness yet. That’s the trap—waiting for exhaustion that already happened on the 1D bearish trend. Entry at 0.0061, TP1/TP2 stacked at 0.0060, TP3 at 0.0059. The ATR (4.4e-05) says moves are tight, but the trend says they’re relentless. Price is sitting at a pivot—if 0.0061 breaks, the slide is m
HOME+0.66%
Everyone’s chasing SOL longs at 103.79—but the 4h tape just whispered a different secret.

$SOL /USDT - SHORT

Trade Plan:
Entry: 103.61 – 103.97
SL: 105.50
TP1: 102.51
TP2: 101.65
TP3: 100.36

Why this setup?
Why now? The 1D is stuck in a range, not a breakout. RSI on the 15m is hot at 63.4, meaning the last push up is overbought on the low timeframe. ATR (0.71) shows quiet volatility—perfect for a liquidity sweep. Entry sits at 103.79 with TP1 at 102.51 and TP2 at 101.65. The invalid line at 102.34 is your canary: if we lose that, shorts get squeezed. But the math says downside is cleaner
SOL+1.51%
Wait for a shot; don't make rash moves emotionally.

$DOGE $LAB
post-image
DOGE+6.82%
LAB+2.00%
Honestly, I was stopped out of the first entry of this long position. The price plunged with a wick at the time, directly hitting my stop-loss. Watching the market pull back up, it would be a lie to say I felt nothing, but I also knew that wasn’t a reason to chase the trade—I had to wait for a second confirmation.

Later, $EDGEX retested without breaking the previous low, and buying support reappeared at the same level, so I chose to enter again. This time, I set a rule for myself: take 70% off when the price surges into the target zone, and set a protection level for the remaining 20% so I w
post-image
EDGEX+3.57%
DOGE+6.82%
XRP+0.84%
Most traders will fade this 95% confidence LONG on NEAR — that’s exactly why it prints.

$NEAR /USDT - LONG

Trade Plan:
Entry: 2.2204 – 2.2448
SL: 2.1152
TP1: 2.3207
TP2: 2.3794
TP3: 2.4674

Why this setup?
- Daily trend is bullish, and 4h structure is armed for a breakout, not a breakdown.
- RSI 15m at 52.47 shows room to run—no overbought cliff yet.
- Entry zone 2.2204–2.2448 aligns with the 1h pivot (2.2326); TP1 at 2.3207 is a 4% scalp, TP2 at 2.3794 is the real meat.
- ATR 1h (0.0489) says volatility is expanding—waiting for a “better” entry means missing the move.
- Invalidat
NEAR+1.32%
Everyone’s staring at the wrong side of DOGE while the 4h chart whispers a trap.

$DOGE /USDT - SHORT

Trade Plan:
Entry: 0.09084 – 0.09122
SL: 0.09335
TP1: 0.08929
TP2: 0.08812
TP3: 0.08638

Why this setup?
Why now? RSI on the 15m is screaming at 72.87—overbought in a range. The primary signal says SHORT at 0.09103, targeting 0.08812, but the alt path flips long to 0.09327. With 77% confidence and a tight 0.000745 ATR, the market is coiling. This isn’t a breakout; it’s a liquidity grab waiting for late longs.

Debate:
If the daily is range-bound, do you fade this 4h pump to 0.09122 or rid
DOGE+6.82%
This $CHIP long position made it this far not because I was especially brave, but because the protective stop kept me disciplined. After entering, the price surged for a while. I didn’t rush to exit everything, but took partial profits in batches. With a lighter position, my mindset stabilized. I moved the protective stop higher for the remaining position. Although the subsequent pullback triggered many people’s stop-losses, my position remained open because the price never touched the protective stop I had moved up.
Most pullbacks in the market are caused by people being unable to hold their
post-image
CHIP+7.11%
ETH+0.73%
SNDK+2.03%
Everyone’s staring at the green ticker, but the 4H chart just whispered a 95% secret about $LAB /USDT.

$LAB /USDT - SHORT

Trade Plan:
Entry: 0.07439 – 0.07489
SL: 0.07700
TP1: 0.07287
TP2: 0.07169
TP3: 0.06992

Why this setup?
- The daily trend is **bearish**, and confidence is a rare 95/100—this isn’t a coin flip.
- Price is hovering at 0.07464, but the real gravity pulls toward TP1 at 0.07287 and TP2 at 0.07169.
- RSI on the 15m (51.65) shows zero bullish momentum—just a lazy pause before the next leg down.
- Why now? The 1h ATR (0.000984) is tight, meaning the breakdown will be e
LAB+2.00%
Everyone’s chasing the SUI breakout—but my 4h chart just whispered a different secret.

$SUI /USDT - SHORT

Trade Plan:
Entry: 0.7991 – 0.8041
SL: 0.8254
TP1: 0.7838
TP2: 0.7719
TP3: 0.7540

Why this setup?
- $SUI /USDT is stalling at 0.8016 with a SHORT bias (55% confidence) while the 1D trend is *range*, not momentum.
- RSI on the 15m is at 60.51—not overheated, but the 1h ATR (0.0099) shows low volatility, meaning the range top is a magnet for fakeouts.
- Why now? Entry zone 0.7991–0.8041 is the exact rejection spot; if it holds, TP1 at 0.7838 is a quick 2% grab before the real drop
SUI+5.79%
Fed Rate Expectations Move With Every Data Release! Could BTC & ETH React Before the September Meeti
live-cover
LIVE397
Everyone’s long LTC at 54.78—I’m counting the seconds until the 4h rug pull hits SYMBOL.

$LTC /USDT - SHORT

Trade Plan:
Entry: 54.64 – 54.92
SL: 56.58
TP1: 53.43
TP2: 52.53
TP3: 51.17

Why this setup?
- RSI on the 15m is already overheated at 68 while price sits mid-range—no fuel left for upside.
- 1D trend is *range*, and we’re at the top of that range with a 77% short conviction.
- ATR (0.58) is tight, meaning the breakout is violent when it comes—and it’s pointing to TP1 at 53.43 before you blink.
- Why now? Because the 4h structure is rejecting 54.92, and the waiting game ends w
LTC+6.96%
Everyone’s watching HYPE’s 4h breakout—but I’m fading the crowd until this RSI prints a lie.

$HYPE /USDT - LONG

Trade Plan:
Entry: 85.800 – 86.102
SL: 84.505
TP1: 87.035
TP2: 87.758
TP3: 88.843

Why this setup?
- 1D trend is bullish, yet the 15m RSI at 64.16 screams overbought exhaustion before the 4h close.
- Entry zone 85.80–86.10 is a liquidity magnet; ATR (0.60) says volatility is coiling for a 1.5% snap either way.
- Why now? TP1 at 87.03 is only 1.2% away—but the 95% confidence LONG is priced for a “sure thing,” which is exactly when traps trigger.

Debate:
If the 4h candle clo
HYPE+0.46%
September 6 $BTC early-morning analysis
The 4-hour chart continues its range-bound recovery, up 0.78%, with net capital inflows of 143 million and buying funds continuing to return. The price has held above the Bollinger middle band at 79465.4, with solid support at the 78618 low below; large sell orders are placed in the order book, indicating clear overhead selling pressure. The Bollinger upper band at 82352.8 is strong mid-term resistance, while the lower band at 76578 serves as a key defense level. The market is experiencing a recovery rebound after the decline and has not yet entered a s
post-image
BTC+0.02%
ETH+0.73%
$DOGE This trade was entered during the overnight session a few days ago. At the time, the chart printed several consecutive small-bodied candlesticks, gradually moving higher, but without any obvious increase in volume or acceleration. I judged this to be a typical slow bullish advance with at least some short-term room to extend, so I opened a long position in the direction of the trend.

After entry, the price did not move straight up. It went through a period of narrow-range consolidation, with much of the unrealized profit fluctuating back and forth. It would be impossible to say my mind
post-image
DOGE+6.82%
ZEC-2.35%
XRP+0.84%
Who is ready for this?
post-image
Everyone’s long $CL /USDT at 91.78—except the 4h tape just whispered a secret.

$CL /USDT - SHORT

Trade Plan:
Entry: 91.69 – 91.87
SL: 92.60
TP1: 91.17
TP2: 90.76
TP3: 90.14

Why this setup?
Why now?
- 1D is range-bound, so no breakout fuel—only mean reversion.
- 15m RSI at 60.4 is fading; momentum is stalling right at resistance.
- ATR (1h) at 0.34 means tight stops—but TP1 at 91.17 is a 0.6% drop that respects the range floor.
- Confidence is weak (55), so this is a scalp, not a saga.

Debate:
Are you fading the 91.78 pop for TP1, or does the range fake you out into 92.39 first?
CL+1.00%
Load More

Join 40 M users in our growing community

⚡️ Join 40 M users in the crypto craze discussion

💬 Engage with your favorite top creators

👍 See what interests you

View More