Share your thoughts
placeholder
Article
Apefest coming soon
post-image
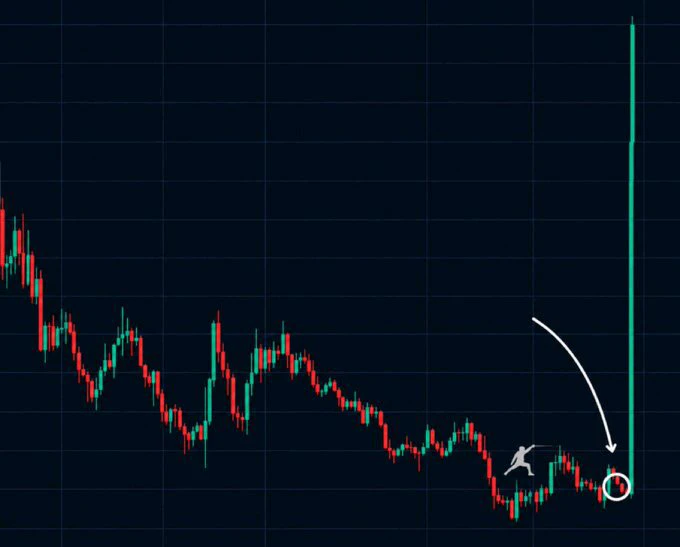
Btc going down?
Market is collapsing?
People selling their memes?
Bear market?
Then why is HYPE pumping?
post-image
BTC-2.21%
HYPE+0.30%
$ZEC I see that many liquidation prices on the feed are between 1200 and 1300. Will it keep pushing upward?
post-image
ZEC+5.36%
  • 1
Gate Alpha Today’s Hot Asset Brief
The meme-coin market is heating up around tokenized-stock narratives, and several low-cap assets are attracting major attention.
🎬 $MEME
A meme coin built around the AMC meme-stock narrative, with its main pool paired with the Robinhood-chain $AMC stock token.
• Peaked around $144M
• 24h: +26,054%

Inspired by Vlad’s “What’s the concern?” comment, $CONCERN quickly gained traction after $MEME crossed $100M.
• Passed $1M within an hour
• High: $5.2M+
• 24h: +3,024%
$CRCL
A meme narrative around Circle and the CRCL ticker, connected to the on-chain CRCL s
post-image
concern
concernWhat's the concern
Pump.Fun
MC:$2.84KHolders:1
0%
MEME-2.67%
CRCL-0.81%
GRASS-2.69%
Why is everyone fading $ESPORTS /USDT right before the 4h close?

$ESPORTS /USDT - SHORT

Trade Plan:
Entry: 0.01460 – 0.01470
SL: 0.01516
TP1: 0.01426
TP2: 0.01401
TP3: 0.01362

Why this setup?
The 1D trend is bearish, and the 95% confidence SHORT signal aligns with that. RSI on the 15m is overheated at 71.37—buyers are exhausted. Entry zone 0.01465 with TP1 at 0.01426 and TP2 at 0.01401 offers a 4.4% drop potential. The ATR (0.000214) shows volatility is tight, so the move down could be swift if 0.01460 breaks.

Debate:
Are you shorting the breakdown to 0.01401 or waiting for a retest of
ESPORTS-0.07%
JUST IN: 🇺🇸 President Trump says economic growth does not cause inflation “stupidity” does.
President Trump is correct.
Growth does not automatically cause inflation. It depends on why the economy is growing and whether demand is outrunning the economy’s ability to produce more goods and services.
Any other economists want to add something? Preferably someone from the far left. 🙂🔫
post-image
$TSLA ‌TSLA shares are trading down 6.36% at $352.41 in intraday trading. The daily trading range is between $351.34 and $364.68, with the stock opening at $362.07. The company, which closed at $376.35 yesterday, has a total market capitalization of $1.39 trillion ($1,391.74 billion), and its Price/Earnings (P/E) ratio is recorded at 325.54.
In terms of technical indicators, short-term moving averages show the pressure on the price and potential support levels. The MA5 level at $361.95 and the MA10 level at $355.80 are forming resistance just above the current price, while the MA30 level at $
TSLA-5.84%
  • 1
$USDJPY $EURJPY $GBPJPY ‌The Japanese Yen (JPY) remains at the center of global currency markets, influenced by the Bank of Japan's (BoJ) monetary tightening path, rising inflationary pressures, and speculation surrounding the asset allocation strategies of the GPIF, the world's largest pension fund. The BoJ's continued focus on further interest rate hikes as inflation approaches its 2% target is accelerating the exit from years of excessively loose monetary policy, while the rise in Japanese bond yields is directly impacting global capital flows.
BoJ Policy Axis and Dilemmas in the Japan
USDJPY+0.26%
EURJPY+0.17%
GBPJPY+0.23%
$5k a day keeps the 9-5 away $Q
I'm trading on Gate, a top-tier exchange with a 13-year track record. Come join me and dive into the hottest events right now!
https://www.gate.com/campaigns/6126?ch=6977&ref_type=132
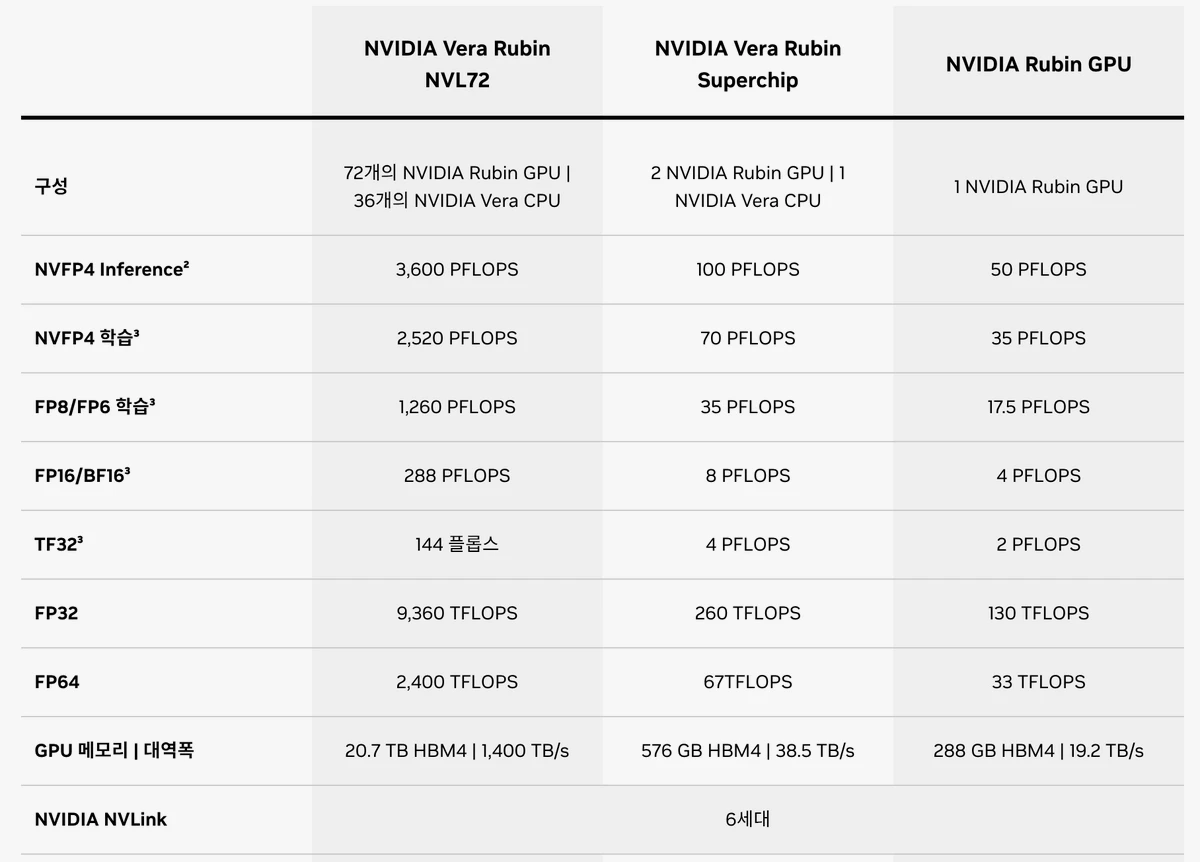
$NVDA$MU$SNDK
post-image
NVDA+0.61%
MU+5.00%
SNDK+10.76%
$USELESS (USELESS) – Sharp Recovery, Watching for Breakout
I'm watching USELESS because it is up +26.53% at $0.24072, bouncing sharply from a 24h low of $0.18046. The price is currently right at the Middle Band (MB at $0.24260). The 24h high is $0.29000, and MACD is turning positive. I am staying out for now, watching to see if it can break and hold above the Middle Band ($0.24260) to confirm a continuation.
post-image
USELESS+27.74%
  • 4
  • 1
A hand that set the stop-loss a few days ago trembled slightly; this morning I realized that was unnecessary filial piety. 🖤 The last glance before bed showed the market still hovering at high levels, and a thought popped into my head: This bull-trap smell is way too strong. In that moment, I knew I could most likely sleep well tonight.

The logic wasn't complicated: The rebound was weak, and volume couldn't break out; every push upward was just short of enough. The resistance above was obvious. Those chasing longs at this level were probably just along for the ride. I chose to short from th
post-image
ADA-4.01%
ZEC+5.36%
A few days ago, my hand trembled slightly as I set a stop-loss before bed. This morning, I realized that extra act of filial piety had been unnecessary. My last glance before bed showed $BASED had just pulled back to a key level. I repeatedly confirmed that the pullback had held and the footing was solid, with absolutely no sign of a breakdown.

I judged at the time that this bullish move had potential, so I directly opened a long position around 0.05933 as a test. When I opened the chart this morning, I froze for a moment—the price had already touched 0.06868, with +757.86% sitting there. T
post-image
BASED-1.66%
SOL-3.46%
BNB-0.43%
Layout for Bitcoin, Ethereum, and Dogecoin
live-cover
LIVE1,703
Everyone’s long silver, but the 4h tape just whispered something else about $XAG /USDT.

$XAG /USDT - SHORT

Trade Plan:
Entry: 65.82 – 66.08
SL: 67.17
TP1: 65.04
TP2: 64.43
TP3: 63.52

Why this setup?
Why now?
- 1D is range—no hero trend to save you.
- 15m RSI at 41.94 shows momentum already rolling over, not exhausted.
- ATR ~0.50 on 1h gives room to breathe, but entry 65.95 sits right under invalidation 67.01.
- Short targets stack cleanly: TP1 65.04, TP2 64.43—a 2.3% drop from ref before SL risk.
- Conf 55 is not a scream, it’s a lean—range tops get sold, not bought.

Debate:
XAG-1.22%
On September 2, I took a heavy position in 30 shares of SanDisk. I made 900 but didn’t sell, and ended up selling for a profit of only a few dozen. There was nothing I could do since it didn’t surge. Yesterday I placed orders for three or four shares, but it didn’t wick down even once to let me buy in. Well, today it rose to over 1,700, and I missed it.
I’ve found that once you figure out U.S. stocks, they’re more fun to trade than BTC and ETH: the volatility is higher, making them suitable for swing trading; you can also easily get trapped, and they’re suitable for studying cycles and sectors
post-image
SNDK+10.76%
This week also wrapped up perfectly. Time to sleep, time to sleep.
I never quite understood the exact meaning of “magnetic field” and “sixth sense” until it suddenly clicked today.
The essence of a magnetic field is attention.
Being forced to project attention toward low-frequency people or things
is an extremely dangerous signal.
A mismatch in attention will exacerbate the rise in soil moisture.
Therefore, whether it is your living environment or interpersonal relationships, you should choose those that make you feel calm and comfortable, with a greater sense of focus.
Attention is All You Need.
post-image
Everyone’s bragging about ZEC’s 1D trend—but my 4h chart just whispered a secret that 84% of traders missed.

$ZEC /USDT - SHORT

Trade Plan:
Entry: 1018.21 – 1032.15
SL: 1112.14
TP1: 959.96
TP2: 916.48
TP3: 851.26

Why this setup?
- The daily trend says “bullish,” yet the 4h setup is screaming SHORT with 84% confidence.
- Price is stalling near 1025.18, right under the 1h ATR of 27.87—a classic squeeze zone.
- RSI on the 15m (60.45) shows fading momentum, not a breakout spark.
- Why now? The “Waiting” status means the trap is set: a drop to TP1 (959.96) is a 6.4% move before the dail
ZEC+5.36%
Load More

Join 40 M users in our growing community

⚡️ Join 40 M users in the crypto craze discussion

💬 Engage with your favorite top creators

👍 See what interests you

View More