Share your thoughts
placeholder
Article
$CVC Signal】Long + negative funding squeeze, 1H overbought awaiting a pullback
$CVC 4H RSI 92.4, 1H RSI 70.58, with overbought conditions stacking across both timeframes. Funding rate -2.0000%, with shorts paying hourly to hold positions. The 4H MACD histogram continues to expand, while the 1H histogram is contracting. The 1H Bollinger upper band is 0.0383, and the current price of 0.03594 is trading near the upper half. The buy/sell ratio is ranging sideways at 0.49-0.50, with no concentrated selling pressure released. OI remains stable, and order book depth is neutral.
🎯Direction: Long
⚡En
post-image
CVC+54.93%
BTC-0.08%
ETH-1.04%
SOL-1.26%
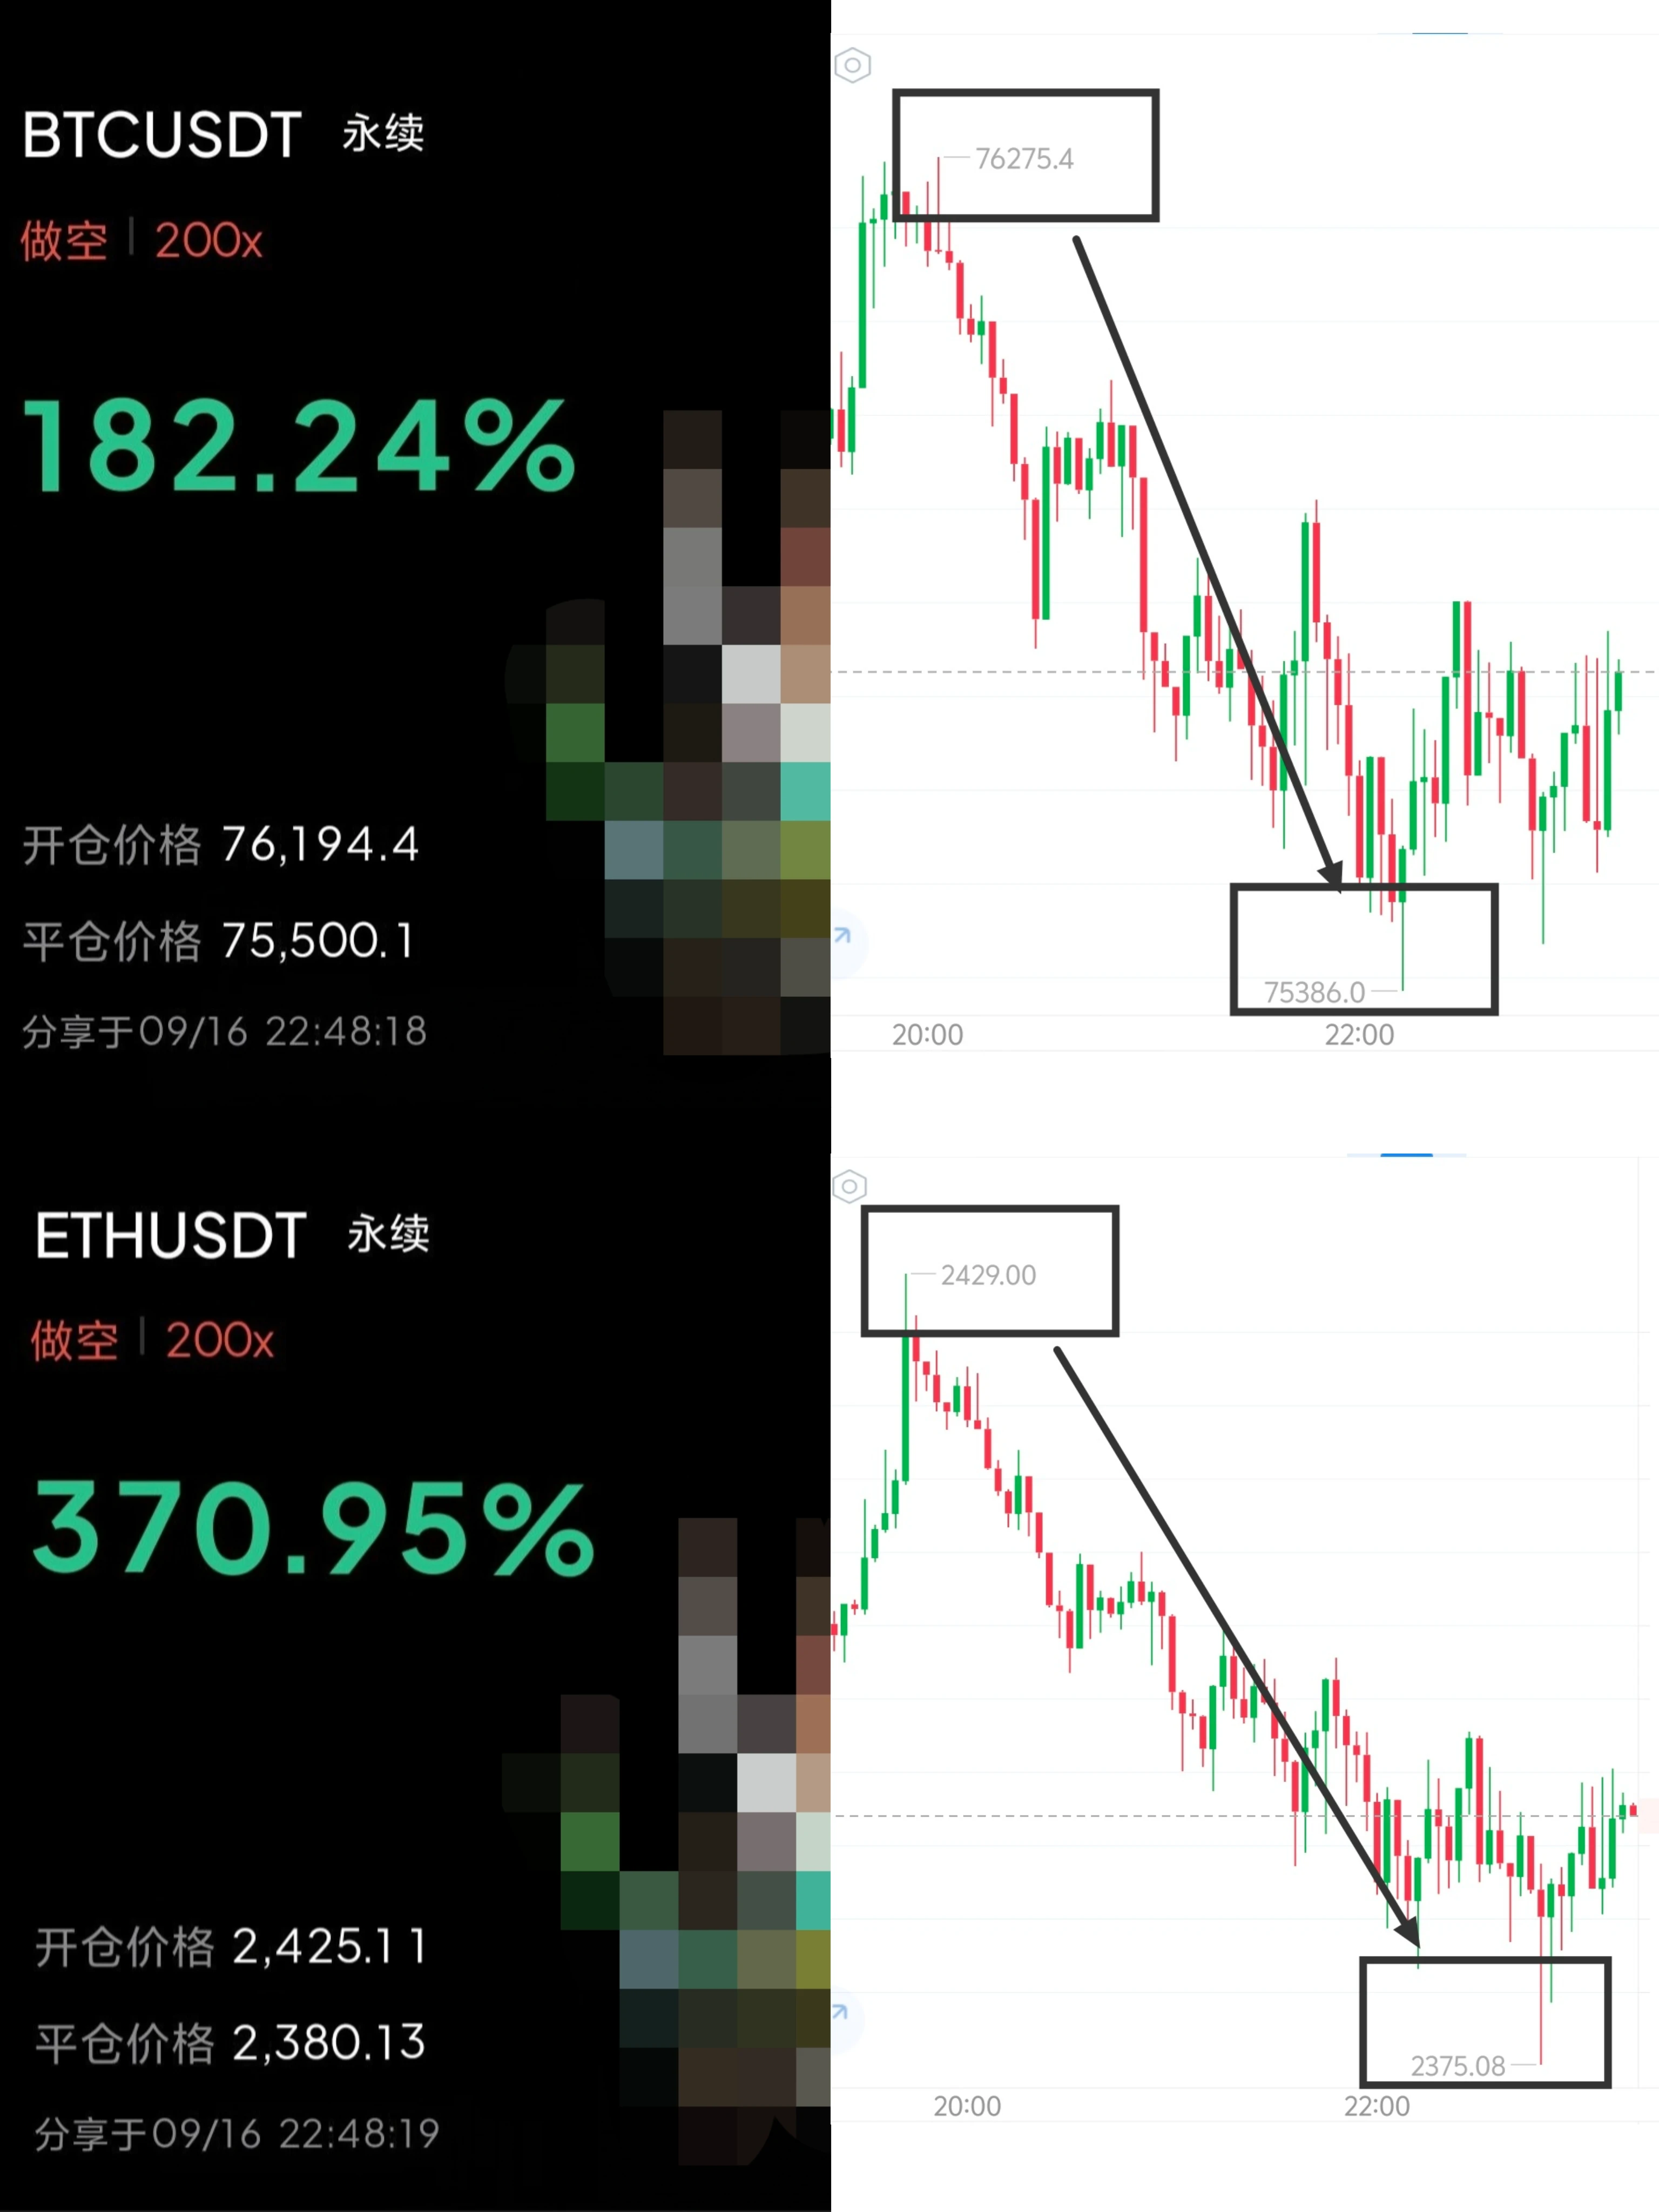
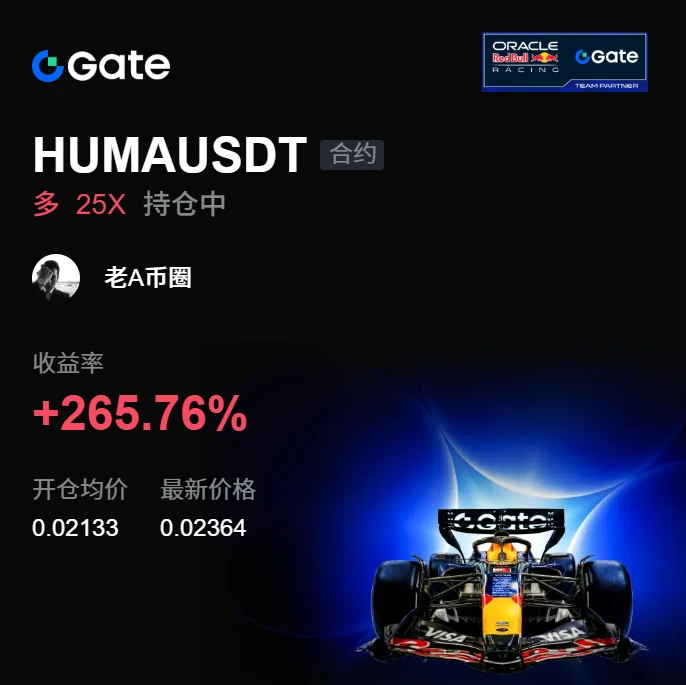
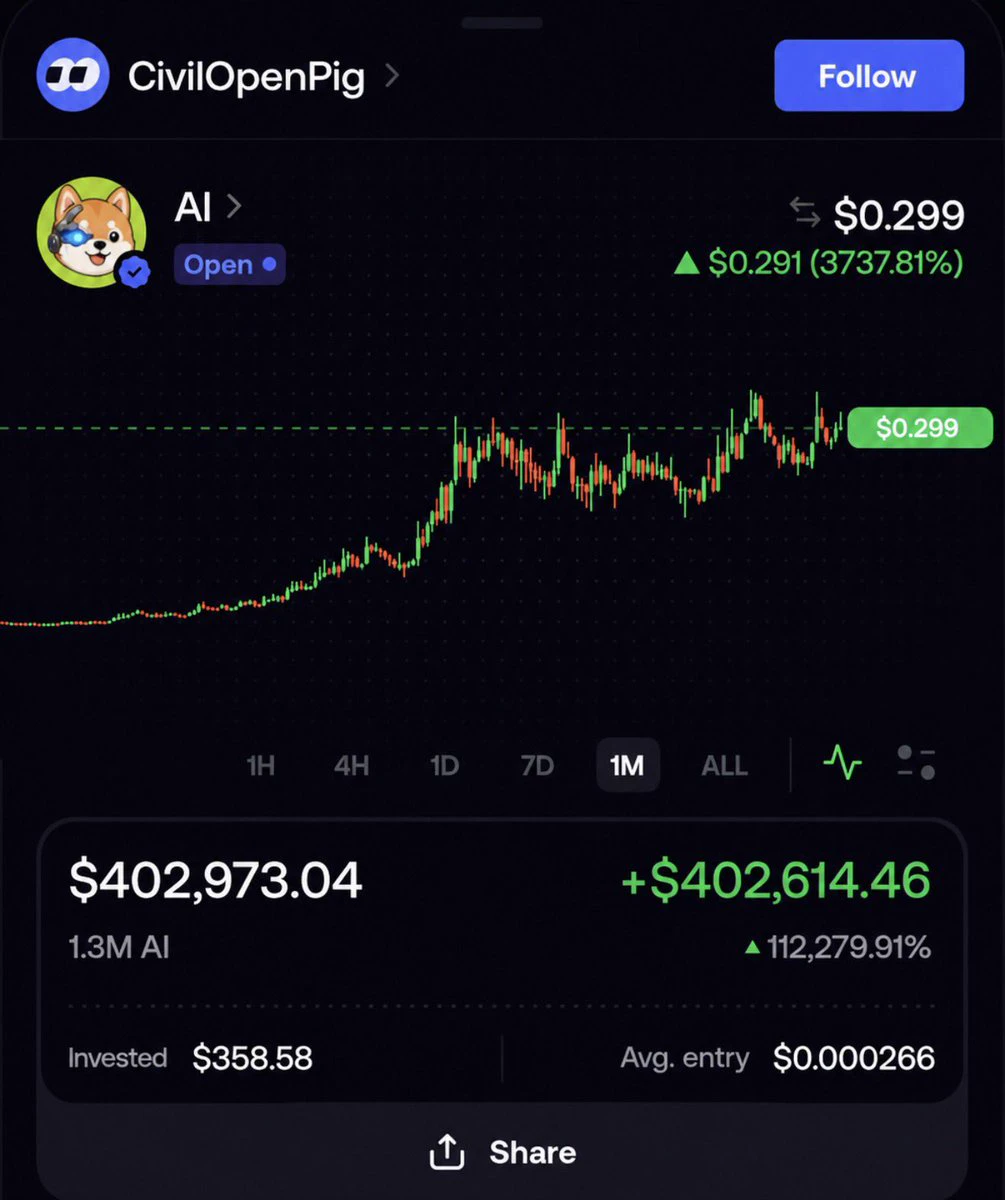
#晒出我的合约收益 Look at this order—I still can't calm down after all this time.
post-image
LDO pump pump bigpump ath hype go
post-image
LDO-2.14%
BIGPUMP-0.24%
HYPE-2.18%
Stock Market | U.S. House to review crypto tax bill
live-cover
LIVE2,502
$BTC Shorts Lying in Wait】1H rebound under pressure, order-book sell pressure imbalance
$BTC The 1H rebound reached 77099.9, with order-book depth imbalance at -83.71% and Bid/Ask at 0.09; a sell wall hangs overhead. The 4H price is below EMA20/EMA50, repeatedly facing resistance near the Bollinger midline around 77172.
🎯Direction: Short
⚡Entry/Limit Order: 76893.701 - 77099.900
🛑Stop-loss: 77870.899
🚀Target 1: 75943.402
🚀Target 2: 75365.152
🛡️Trade Management:
- Execution strategy: After reaching Target 1, reduce the position by 50% and move the stop-loss up to breakeven. If the price f
post-image
BTC-0.09%
ETH-1.04%
SOL-1.26%
Core CPI Rises More Than Expected, Intensifying the Fed’s Internal “Dove-Hawk” Debate
Today, let’s focus on core CPI, because it better reflects underlying inflationary pressure than headline CPI.
August core CPI rose 0.3% month-on-month, above the market expectation of 0.2% and higher than the previous reading. That number may not look large, but the Federal Reserve is watching core inflation closely because food and energy prices are too volatile to serve as a basis for policy.
What does a 0.3% month-on-month rise in core CPI mean? Annualized, it comes to roughly 3.6%, still well above the F
NVDA-0.09%
$POWER Signal】Long + 1H overbought holding firm, negative funding rate providing support
$POWER The 1H price surged to 0.10998 before retreating to 0.108, with the 4H Bollinger upper band at 0.1032 underfoot. RSI is 87.98 on 4H and 72.32 on 1H, with buying continuing to absorb sell orders in overbought territory. Order book depth imbalance is +7.02%, bid/ask is 1.15, and bids below are thick. The 4H and 1H MACD histograms are expanding simultaneously, while the funding rate is -0.0021%, meaning shorts are paying a slight fee. OI is stable and the price is holding firm. The current price is ne
post-image
POWER+21.11%
BTC-0.08%
ETH-1.04%
SOL-1.26%
#GateTop4MainstreamCEX
#Gate主流CEXTop4
Gate Holding the Global Top 4 — Is Top 3 the Next Target?
August 2026 delivered another strong signal about Gate’s growing position in the global centralized crypto exchange market. According to the latest BlockBeats data, Gate recorded approximately $40 billion in spot trading volume and approximately $285 billion in derivatives trading volume during August, keeping Gate firmly inside the global Top 4 mainstream CEX ranking. For me, this is much more than a simple ranking. It reflects the scale of activity, trader participation, product expansion and mar
post-image
been watching this one for a while
feels like a few solid theses recently were what triggered the breakout
bsc splits attention hard, but this is one of the few with lore you can't swap out
$BEM
post-image
Crypto Markets Enter A Data-Heavy Week, Could BTC and ETH Break Their Current Ranges?
live-cover
LIVE318
August gave us an interesting signal about the crypto exchange market.
Trading activity came back strongly, but the recovery was not equal across every exchange.
Total CEX volume reached around **$4.29T**, up 12.7% from July.
Spot volume climbed 18.7% to about **$891B**, while derivatives reached roughly **$3.40T**, up 11.3%.
And inside that bigger picture, Gate ranked **4th globally** by combined spot and derivatives volume, processing around **$327B** in August.
But honestly, the ranking itself is not the most interesting part.
The bigger story is where that volume came from.
Gate handled ap
post-image
  • 7
Doge faces minor pressure. Let's break down the latest action for $DOGE . 1️⃣ We are seeing $DOGE trading at $0.08377, showing a minor drop of -1.598% in 24 hours. 2️⃣ Today's peak stood at $0.08538 while the floor was found at $0.08286. 3️⃣ Momentum is currently neutral as traders decide on the next big direction. For educational purposes, if you expect a bounce, a sample long structure could be entering at $0.08377 with SL at $0.081257 (-3%) and TP at $0.087958 (+5%). If you expect more drop, a sample short structure might involve entry at $0.08377, SL at $0.086283 (+3%), and TP at $0.079581
post-image
DOGE-1.32%
$BTC Bulls need to wake up here
post-image
BTC-0.08%
#ShareWeekly
#XRP is sitting in a tight range at exactly the wrong time to be emotional. Price is around $1.35, down roughly 1.4% over 24h and 5.4% over 7 days, while 24h volume is about $965M and market cap is around $84.9B. The important part is that price is still holding the lower part of the range instead of breaking down cleanly.
What makes this week interesting is the amount of information waiting outside the chart.
The U.S. Senate is preparing for a key CLARITY Act procedural vote on September 15, and Republicans have already released an updated version of the bill with changes aimed
post-image
XRP-1.45%
What does low liquidity mean?
Low liquidity does not necessarily mean the market is at the bottom, nor does it necessarily mean that, as the saying goes, a prolonged sideways market will inevitably fall. In fact, it simply means that differentiation or executability has declined.
It may be that the market is genuinely dormant, or that the trading center has shifted after a period of sideways movement. Alternatively, sellers may have temporarily exited the market, or it may be a sampling illusion caused by data coverage, fragmented liquidity across exchanges, or smoothing over larger timeframes
  • 1
When will $SNDK drop to 1540?
post-image
SNDK-3.32%
Tokenized asset classes on around 10 September: U.S. Treasuries hold $15.77B across 74,253 holders, while stocks hold $2.91B across 3.17M holders.
  • 1
The profit is thin, but it grew on its own—I didn't touch it.

While everyone was still watching, the volume didn't follow. There were no buyers on the way up, so I judged it to be a fake pump and alerted everyone to prepare short positions.

From 0.33936 to 0.11297, +1312.36%—the long wait was worth it. It was truly sluggish at first, but the result feels great. Don't lose patience grinding away in a range, only to try to win back your dignity in a one-way move.

The money you make is the realization of your understanding; the money you lose is the flaw in your understanding. Take 80% off
post-image
ETH-1.06%
BTC-0.09%
Highly volatile, just make a few quick trades$LSK
LSK+319.94%
#ShareWeekly
#FIL The move is real, but the next candle is not the trade
Fil coin has suddenly come back onto the radar, and what interests me is how fast the move happened. FIL pushed from the mid-$0.85 area to around $0.91, with a sharp intraday burst taking it to roughly $0.915. This is no longer a quiet recovery — momentum has clearly returned.
The latest data has FIL around $0.911, with roughly +12.7% over 24h and +15.4% over 7 days. 24h trading volume is about $111.85M, while market cap is around $753M. The latest reported 24h range is approximately $0.797–$0.921.
The important thing
post-image
FIL+20.02%
Load More

Join 40 M users in our growing community

⚡️ Join 40 M users in the crypto craze discussion

💬 Engage with your favorite top creators

👍 See what interests you