


Share your thoughts
placeholder
Article
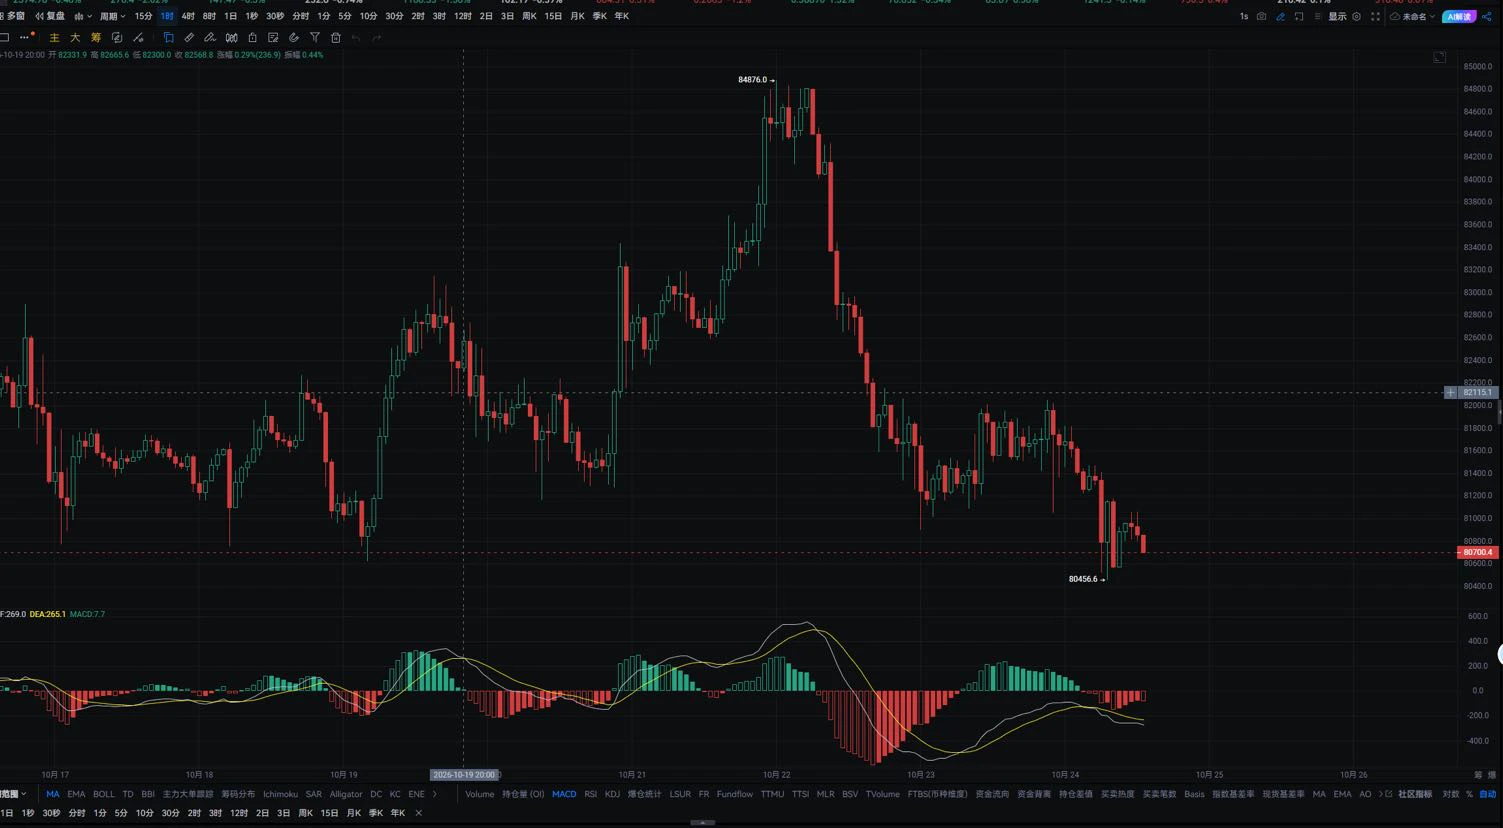
$BTC , is it going to hold at 80,000? Looks like this year's market isn't very good! It seems the wish to double will fall through! Bring on the bull market! 🐮🐮🐮🐮🐮🐮🐮🐮🐮🐮🐮🐮🐮🐮🐮🐮🐮🐮🐮🐮🐮🐮🐮🐮🐮🐮🐮🐮🐮🐮🐮🐮🐮🐮🐮🐮🐮🐮🐮🐮🐮🐮🐮🐮🐮🐮🐮🐮🐮🐮🐮🐮🐮🐮🐮🐮🐮🐮🐮🐮🐮🐮🐮🐮🐮🐮🐮🐮🐮🐮🐮🐮🐮🐮🐮🐮🐮🐮🐮🐮🐮🐮🐮🐮🐮🐮🐮🐮🐮🐮🐮🐮🐮🐮🐮🐮🐮🐮🐮🐮🐮
post-image
BTC+0.28%
  • 6
  • 1
#​MU Micron Technology (MU) – Market Analysis (Data as of September 6, 2026, based on the September 4 regular session)
Micron closed its last completed trading session on Friday, September 4, 2026, at USD 1,014.95, up USD 56.46 or approximately 5.89 percent from the prior close of 958.49. The session ranged from 969.00 to 1,017.77 on roughly 30.7 million shares, the heaviest volume in twenty sessions at about 2.3 times its average, and the stock finished near its session high. US equities do not carry a rolling 24-hour change figure, so the latest full trading day is used here. That single-day
post-image
MU+5.89%
  • 3
Bonk Guys PONS holdings achieved returns of over 150x, while the portfolio surpassed $27 million to
live-cover
LIVE2,230
【$RAYSOL Signal】Long | 4H MACD bullish expansion
$RAYSOL RSI 4H 79.52, buying demand gap.
4H MACD bullish momentum is expanding, while the 1H red bars are shortening, indicating insufficient short-term follow-through. Order book depth imbalance: -7.90%; the share of aggressive buyers is declining. OI is stable, with the funding rate at -0.0128%; shorts have not retreated.
🎯Direction: Long
⚡Entry/Limit order: 1.131495 - 1.134900
🛑Stop-loss: 1.078155
🚀Target 1: 1.220017
🚀Target 2: 1.262576
🛡️Trade management:
- Execution strategy: After reaching Target 1, reduce the position by 50% and move
post-image
BTC+0.28%
ETH+1.75%
SOL+3.89%
I did nothing—just went to the restroom, and when I came back, the candlestick chart had already done the work for me. During the repeated intraday swings, $UNI pulled back to a key level. It didn’t break through, and every dip was pulled back up by buying pressure. Once it held the retest, I judged that this was the opportunity and entered directly around 4.490. It then took off.
For a trade I’m not confident in, taking a look is clear-headed, but buying even one unit is foolish. I understood this trade, so I was able to hold it. The current price is 7.053, with returns reaching +2582.3%. It
post-image
UNI+11.95%
ADA+1.67%
ETH+1.73%
$BULLA closes with a doji today, then surges past 0.1 after midnight. Did the whales see this script? Thank you for sparing me.
post-image
BULLA+29.31%
Everyone’s watching the 1H RSI—but the 15M just flashed 63.6. That’s your tell before SNDK drops.

SNDK/USDT - SHORT

Trade Plan:
Entry: 1789.47 – 1793.59
SL: 1811.33
TP1: 1776.68
TP2: 1766.78
TP3: 1751.92

Why this setup?
Why now?
- The 4H bias is SHORT, but the 1D is stuck in a range—so this is a scalp, not a trend.
- Entry at 1791.53 sits right under rejection; TP1 at 1776.68 is only 0.8% away, offering a fast 1:1.8 risk-reward before the daily range caps upside.
- Don’t chase the long—the 15M RSI is overheated, and ATR (8.25) means volatility is tight enough to snap back to mean.
SNDK+1.47%
This was purely the market being in a good mood and casually tossing out some gold coins—one just happened to hit me on the head. 🤔 While everyone else was running, I instead spotted a shorting opportunity on $MOVR —a drop isn’t panic; a low-volume rebound is the real bull trap, and insufficient buying support is the shorts’ best fuel.

I opened a short position around 0.995, and before long, the market had moved down to 0.816, with the account showing +216.35%. Those who got on board should be laughing in their sleep—the price dragged its feet for ages on the way up, then came down cleanly
post-image
MOVR+0.62%
BTC+0.27%
ADA+1.67%
ZEN’s move peaked at nearly 7.3 within more than ten hours, with the market expanding by nearly 30%. But what is truly worth looking at is not how much it rose afterward.
It is why my AI quantitative system caught it when the move first started, and why it was able to capture this upside.
At 17:08 Beijing time, the system generated this strategy.
The strategy ID, model version, and risk tags were all recorded in the backend logs and database.
It captured ZEN based on more than just its price increase. At the time, the fund status had entered Sponsored Accumulation, indicating sustained capital
ZEN0.00%
BTC+0.28%
💰 Don’t let great content earn only likes! Have you activated Gate Social Subscriptions?
Share analysis in the Square or discuss market trends in livestreams—any content can be set as subscriber-only! Market reviews, trading strategies, market observations… Give subscribers access to deeper content while sharing and building a core following!
🔥 Set your own price with 0% revenue share! Activate now: https://www.gate.com/post
📖 Learn more: https://www.gate.com/help/community-center/moments/23369
GateSquare
💰 Don’t let great content earn only likes! Have you activated Gate Social Subscriptions?
Share analysis in the Square or discuss market trends in livestreams—any content can be set as subscriber-only! Market reviews, trading strategies, market observations… Give subscribers access to deeper content while sharing and building a core following!
🔥 Set your own price with 0% revenue share! Activate now: https://www.gate.com/post
📖 Learn more: https://www.gate.com/help/community-center/moments/23369
repost-content-media
  • 3
  • 1
#‌$NVDA NVDA AT $231: NVIDIA REMAINS ONE OF THE STRONGEST AI STOCKS — FULL MARKET ANALYSIS, NFP IMPACT & TRADING PLAN
NVIDIA remains one of the most powerful names in the global technology market, and in my view NVDA continues to deserve serious attention because the AI infrastructure story is far from finished. With NVDA around the $231 area, the stock is sitting in an important decision zone where momentum, fundamentals, AI demand, macroeconomic pressure and valuation are all coming together. The latest verified Friday close was approximately $230.36, after NVDA traded as high as $234.76 and
#Gate60MillionUsers
NVDA vs TSLA: Same tech universe, completely different momentum.
The latest session showed a clear split: NVIDIA held firm while Tesla suffered a heavy rejection.
Market Snapshot
$NVDA : $230.36 | +0.84%
• Volume: 135.35M shares
• Day range: $229.63–$234.76
• 52W high: $236.54
$TSLA : $354.08 | -5.92%
• Volume: ~65.0M shares
• Day range: $351.32–$364.69
• 52W range: $297.38–$498.83
Why It Matters
NVIDIA is still being supported by the AI infrastructure narrative. Its latest earnings showed $96B quarterly revenue, up 106% YoY, while guidance pointed to roughly $108B next
TSLA+0.31%
NVDA+0.34%
This profit is making me feel terrified, worried that the market will come to its senses tomorrow and blacklist me.

While everyone else was running, $TRUMP bounced back to the upper boundary at 2.481, but failed to break through after grinding along it for two K-lines, with clear resistance above. I’d be letting the chart down if I didn’t short at a level like this. After opening the short, it even gave plenty of room to breathe. Unfortunately, it was too lazy to even stage a bull trap, drifting down all the way to 2.345 and delivering a direct return of +411.51%.

I took 80% off the table
post-image
TRUMP-1.52%
BNB-1.08%
LAB-3.59%
Yesterday's $FONE trade closed with nice profit.
Right now structure still bullish, but momentum is weak. Lot of profit-taking was done.
Anyway it looks way more alive then few days ago.
Gonna open another long with lower amount from 0.015-0.16 zone.
Gonna keep monitoring chart to buy more if price will go for new ath or to close position if structure change to bearish again.
#FONE
FONE+57.60%
【$BULLAU Signal】Go long + 1H MACD bearish contraction
$BULLAU Order book depth imbalance -2.30%, buy orders are slightly thin, and the current price of 0.077148 is sitting just below the 1H Bollinger middle band. The 1H MACD histogram at -0.0019 continues to narrow, indicating weakening bearish momentum. The 4H MACD histogram is +0.0017, with bullish momentum still present but slowing. The price is trading above the 1H EMA20 at 0.0756, while the bullish EMA50 alignment at 0.0651 remains intact.
🎯 Direction: 【Go long】
⚡ Entry/Orders: 【0.07691656 - 0.07714800】
🛑 Stop-loss: 【0.07637652】
🚀 Ta
post-image
#GateEventContractTradeSharingChallenge
The Real Edge Isn’t the 5 USDT Rebate — It’s How Efficiently You Earn It.
Gate’s Event Contract Trade Sharing Challenge offers attractive incentives, including 5 USDT rebates and lucky draws. But smart traders know that the headline reward is only one side of the equation.
The real question is:
How much does it actually cost to complete a qualifying trade?
That’s where execution friction becomes critical.
🔍 1. Spread vs. Rebate
A 5 USDT rebate sounds attractive until spread and slippage consume most of it. Before entering a qualifying trade, check the
BTC returns to $78,000! The market rebounds after finding suppor
live-cover
LIVE1,777
The payouts are disappearing from the distribution wallet but seems like no one's getting any $ZEC tokens
What's happening here? @LaunchOnSF
Can we have some explanation?!
ZEC+16.78%
$SOL Long】4H momentum expansion + buy-side depth dominance
$SOL 1H RSI 67.8, order book BID/ASK 1.78, 4H MACD histogram expanding at 0.4612. Clear support exists in the 106.38-106.70 range, with a 0.01% funding rate and no overheating on the buy side.
🎯Direction: Long
⚡Entry/limit order: 106.380 - 106.700
🛑Stop-loss: 105.633
🚀Target 1: 108.301
🚀Target 2: 109.101
🛡️Trade management: - Reduce the position by 50% after reaching Target 1, and move the stop-loss up to breakeven. If the price falls back to the entry level, exit automatically to protect the principal.
The 4H Bollinger Bands are
post-image
SOL+3.85%
BTC+0.28%
ETH+1.75%
Load More

Join 40 M users in our growing community

⚡️ Join 40 M users in the crypto craze discussion

💬 Engage with your favorite top creators

👍 See what interests you

View More