Square
Following
Hot
News
Profile
Share your thoughts
placeholder
Article
Financial News, Crypto Updates, Real Trading Strategies
live-cover
LIVE880
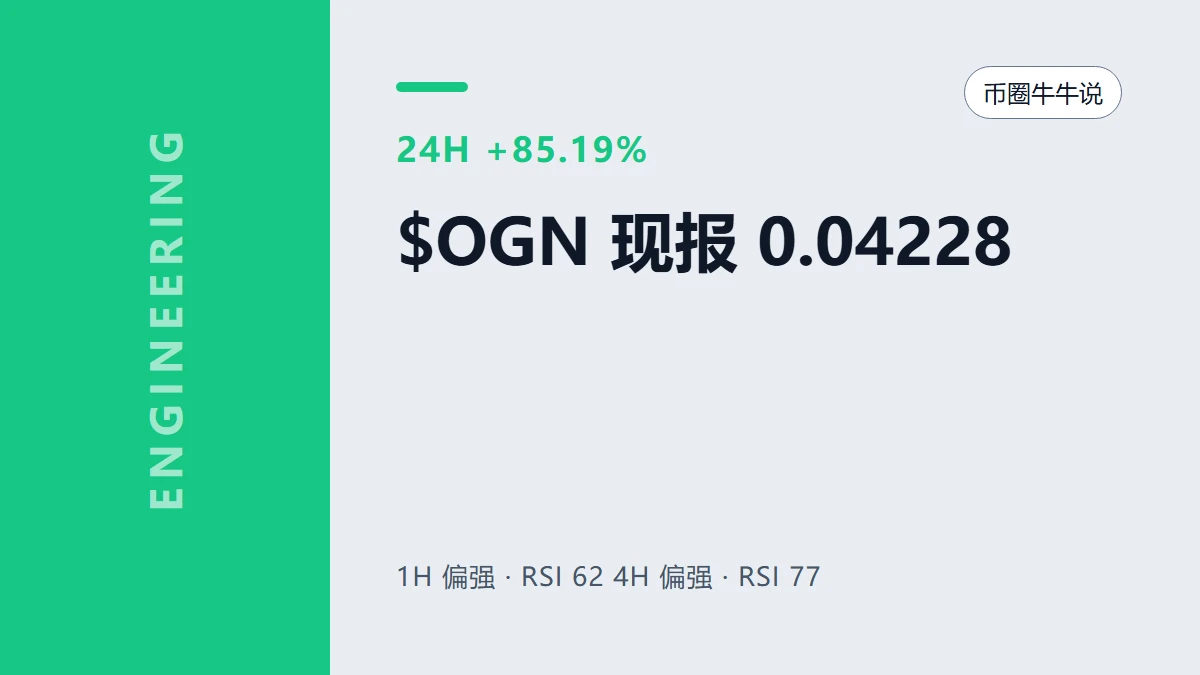
$OGN ’s strength remains, and so does the rising crowding risk
$OGN 24-hour +85.19%, current price 0.04228. The 1-hour and 4-hour RSI are 62 and 77, respectively. The strength is real, and so is the crowding. The question is not whether it can continue moving higher, but who will be willing to catch it on the first pullback.
The bears also have clear invalidation lines. A break below the 1-hour support at 0.02243 would mean short-term buying support has failed the test; if the 4-hour support at 0.02034 is also broken, the previous assessment of strength or recovery must be rewritten. Views can
post-image
OGN+80.96%
$SOL
Seeing this price action, I’m laughing so hard it looks worse than crying😅 But don’t panic—the on-chain data is still holding up; it’s just a shakeout. Once this wave of panic passes, SOL can still bounce back to new highs. Hold tight, don’t get shaken out—the real show is just beginning🚀
post-image
SOL-6.28%
I did nothing—just went to the restroom, and when I came back, the candlestick chart had already done the work for me.

I was watching $HOOKED while it was bottoming out intraday. It held after the pullback, and buying pressure was clearly strengthening. My bullish call was simply to wait patiently for confirmation. While others were still doubting, I had already written out the plan: hold if it doesn’t break down; accept it if it does. At levels like this, impatient people get nothing—only the steady-handed get their share. I don’t guess the top or the bottom; I only trade the move after con
post-image
BNB-4.86%
SNDK-4.98%
$ZEC
This ZEC move is absolutely insane—one short after another happily got back to breakeven, while I just had to get wiped out at 1678 in one sweep, right at the very top! So frustrating😭 Watching everyone else hold on until they recovered their losses, I didn't even get the chance to hold on.
post-image
ZEC-10.02%
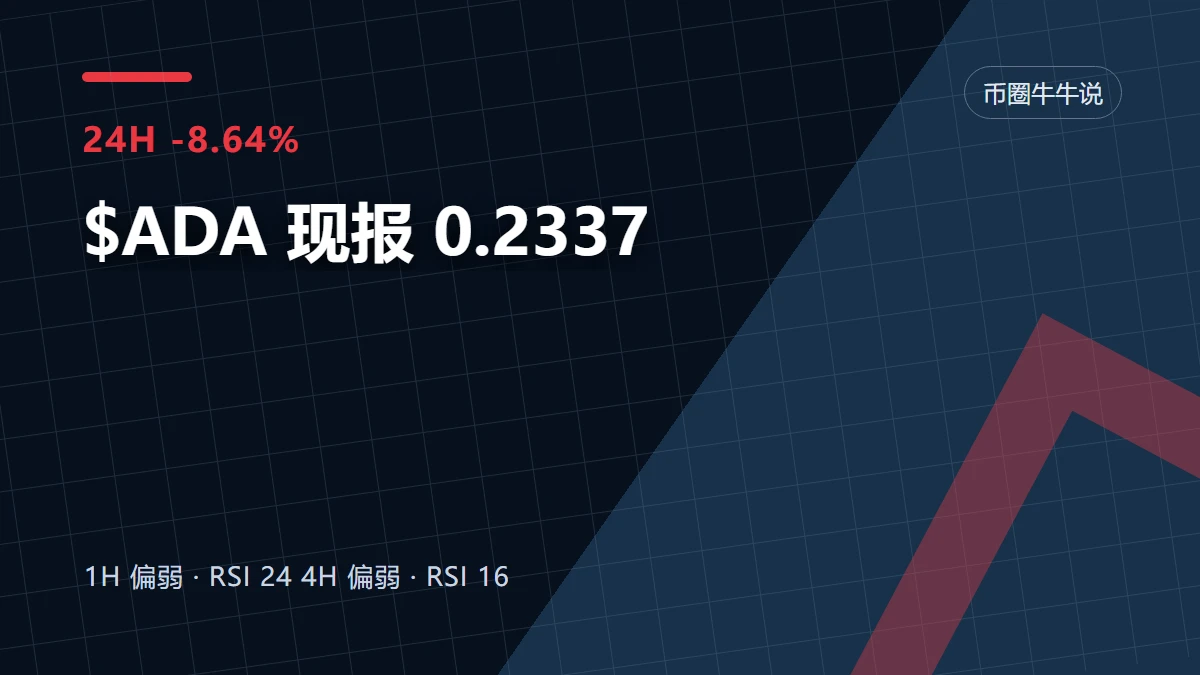
$ADA has entered oversold territory, but “it should rebound” and “it has bottomed” are completely different things. I would rather lay out the bearish case first.
Bears are focused on the risk of breaking below 0.2238, while bulls need to prove that buyers remain after a breakout above 0.2582. Current volume is 0.26x.
The current price is 0.2337, about 4.24% from the 1-hour support at 0.2238 and about 10.48% from the resistance at 0.2582. The position determines which side is more anxious, so stop guessing the bottom for now and wait for a new support structure.
It is more reliable to let the
post-image
ADA-9.03%
SOL one-hour timeframe: After bottoming out following the earlier sharp decline, the price staged a recovery rebound, but insufficient volume follow-through left it under pressure and unable to rise after touching the Bollinger middle band. Funds continue to flow out net, selling pressure remains, and rebound momentum is gradually fading. The overall larger trend remains downward, while weak correlation with BTC is weighing on the token’s performance. The middle band is clearly capping the upside, leaving limited room for a short-term rebound.
Trading recommendation: Short at 111-116, target 1
post-image
BTC-1.74%
$KORU Looking back at this trade, I entered too late and exited too early—emotions replaced the plan. Next time, set the stop-loss first before taking action.#Gate.io 📈 #每周来晒
KORU-12.28%
10/09 07:00 Market Brief|Coinbase 24h
All three fell; falling less does not mean they have strengthened. BTC -1.64%, SOL -4.94%, a difference of 3.30 percentage points.
SOL is currently $110.23, 5.60% below its 24h high. This is relative performance, not a breakout signal.
#Crypto
post-image
BTC-1.74%
SOL-6.28%
$JCT Quickly, quickly, open a short! This is a selling opportunity from the top,
I’ve already entered a short with 1 thousand—come on, let’s make profits!Target: 0.0020
post-image
JCT+45.37%
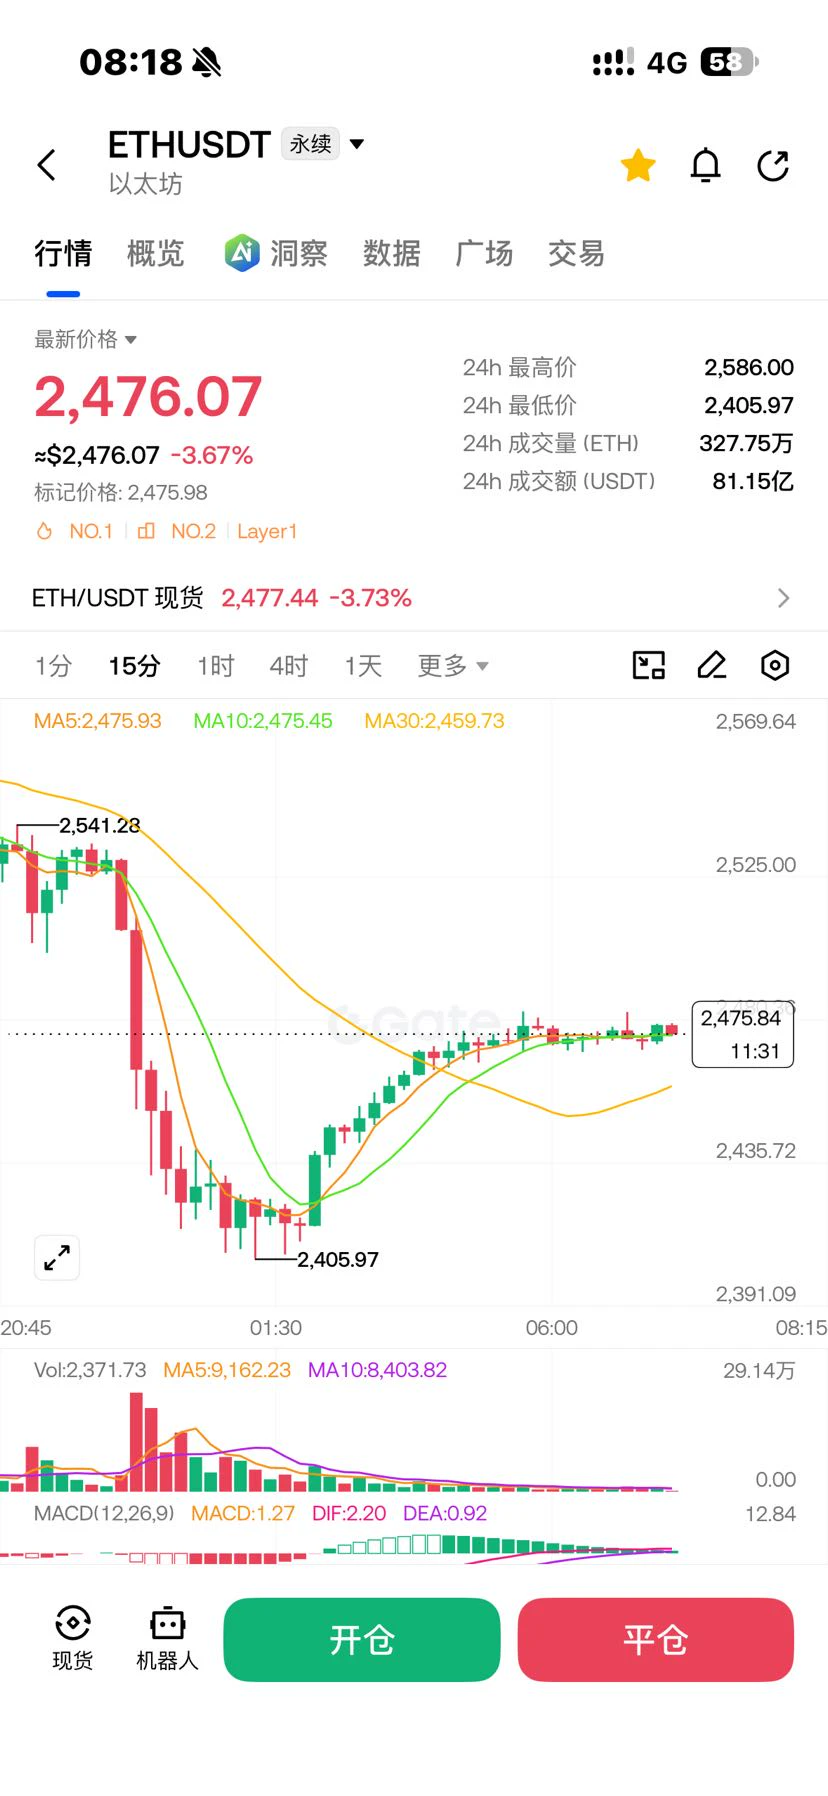
ETH rose 0.91% within a 15-minute window, marking a technical rebound after a sharp drop: short-term RSI was deeply oversold and a hammer candlestick appeared, but ETH spot ETFs have recorded net outflows for seven consecutive trading days, while whales’ $252 million in long positions are nearing liquidation prices. Buying support is limited, with the rebound coexisting with pressure.
post-image
ETH-3.58%
Market update
live-cover
LIVE83
I just opened a quick short trade on $JCT
. The risk is extremely high. Entry now: sell at 0.002650 or 0.002800. First target: 0.002500. Second target: 0.002400. Third target: 0.002300. Final target: 0.002200++. Stop loss above 0.002950.
post-image
JCT+45.37%
$Lobster, awesome, stoic, taking off,
post-image
龙虾+24.63%
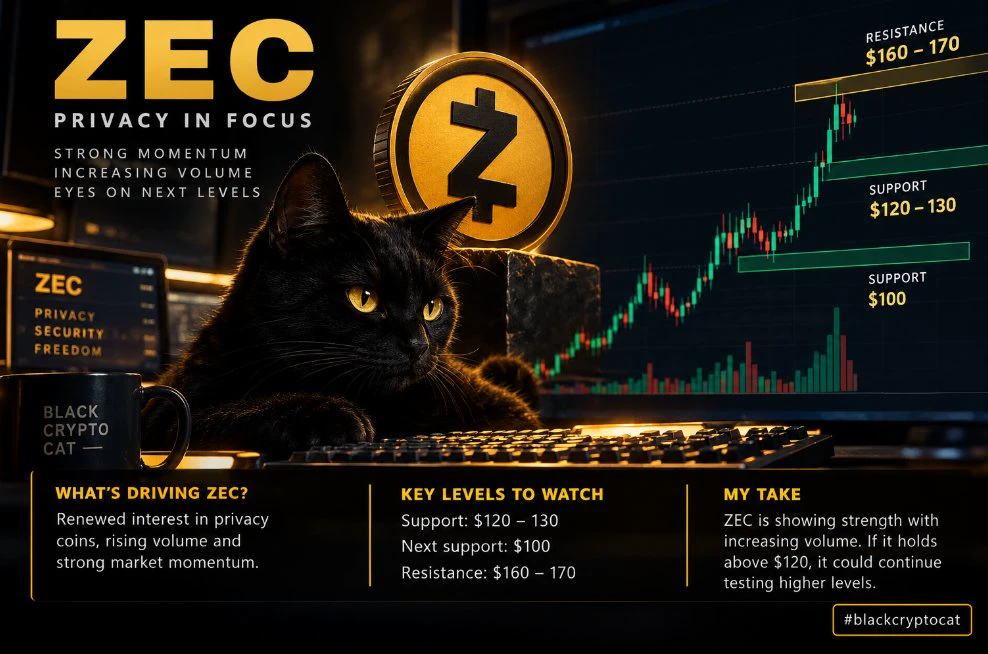
ZEC is down 14.5% in 24h after a strong rally.
A sharp correction raises one question: healthy profit-taking or fading momentum?
I'll watch volume and support levels before calling a reversal.
Volatility creates opportunities, but confirmation matters.
#ZEC #blackcryptocat
post-image
ZEC-10.07%
$HYPE is starting to look terrible. Something has to be done ASAP, or 40s ride in pretty quickly.
HYPE-4.57%
Sister U 10.9 Friday $BTC Strategy
Entry conditions: Revisit the 80700–89999 range, with the 4-hour candlestick closing with a long lower wick indicating a halt to the decline, accompanied by increased buying volume providing support; after confirming stabilization, cautiously enter a small long position.
Stop-loss: If the price decisively falls below 80000 and the support is completely broken, immediately abandon the long bias and exit.
First take-profit target: 82800
Second take-profit target: 84000
Market logic: The market has continued to retreat from the high of 87239, and after bearish
post-image
BTC-1.74%
I lost all my savings over the past two days. After cutting my losses at 1.50 yesterday, I went to sleep, and I still had to go to work at seven the next morning. When I woke up at 6.35 this morning, I saw that everything had pumped. I lay in bed, completely drained of strength. Sigh—what is meant to be yours will eventually be yours, and what is not meant to be yours should not be forced; there is nothing to do but grieve in vain.
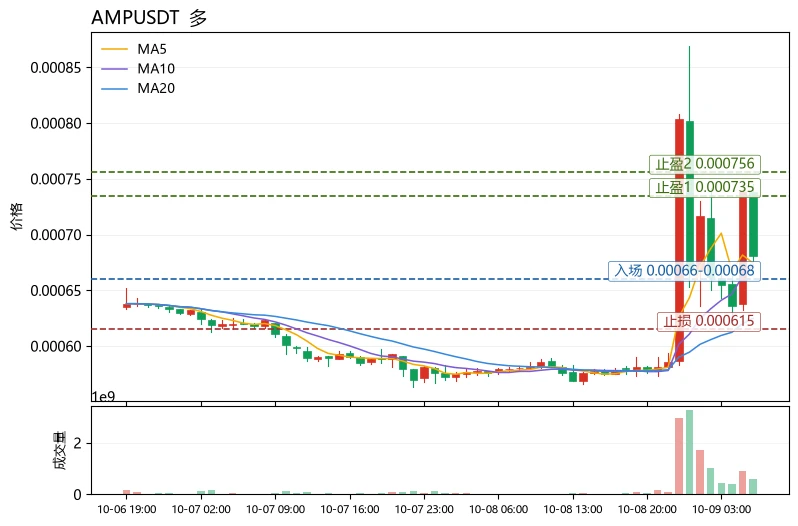
The entire sector is broadly up, so why is AMP more worth watching?
The answer lies in the mismatch between relative strength and volatility elasticity. $AM is up 17.65% over 24h, outperforming $PYTH at +14.11% and $AERO at +3.99%, yet its RSI is only 55.4, the lowest among the three—AERO has reached 60.9, while PYTH is as high as 66.5 and nearing the Bollinger upper band at 0.08389. AMP, meanwhile, is currently at 0.00068, still above the Bollinger middle band, with approximately 11% room remaining to the upper band at 0.00075698. This means AMP combines “leading gains with non-overheated
post-image
AERO+4.17%
  • 1
Load More

Join 40 M users in our growing community

⚡️ Join 40 M users in the crypto craze discussion

💬 Engage with your favorite top creators

👍 See what interests you

Trending Topics

Gate Money Officially Launches

3.45k Views12.87k Discussing

Gate officially launches Gate Money, a global integrated financial services app that brings digital assets, fiat, stocks, ETFs, gold, bank accounts, and payments into one Gate App. Users can manage assets, invest, send and receive funds, convert currencies, and make payments — all from a single account. Which use case are you most excited about? [👉 Learn more](https://www.gate.com/announcements/article/102094)

Fed September Minutes Lean Hawkish

64.16k Views2.72k Discussing

Samsung Q3 Operating Profit Surges 782.5%

36.91k Views1.93k Discussing

View More