


Square
Following
Hot
News
Profile
Share your thoughts
placeholder
Article
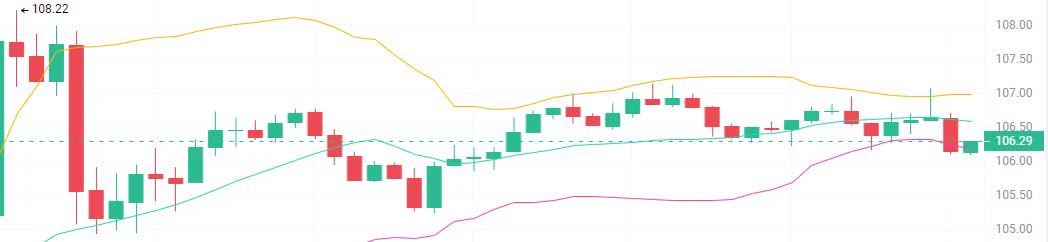
Everyone, $AVA is showing signs of rejection after a sharp rally, with resistance strengthening around $0.383–$0.400. If sellers take control, a deeper pullback may follow.
$AVA — Short entry: $0.3830–$0.3900 Take-profit 1: $0.3600 Take-profit 2: $0.3400 Take-profit 3: $0.3142 Stop-loss: $0.4112 Will AVA pull back further, or break back above resistance?
post-image
AVA+37.16%
Sunday, October 18 [Macro]
✅The US postpones imposing a new round of large-scale sanctions on Russia
✅The ECB warns that geopolitical conflicts are driving up inflation risks
📅Sunday, October 18 [Geopolitics]
✅Strait of Hormuz: Iran opens fire to intercept vessels in violation, and an oil tanker hits a mine and catches fire
✅Ukraine: Ukraine and the US may begin a new round of talks as early as next week
✅Egypt says it can provide security protection at Saudi Arabia's request
Trenches
AGT
A
bade
b
AGT
0x5d...e274
Market Cap
$
Change
.
24h Vol
$.
Holders
.
CNPY
C
bade
b
CNPY
0xc6...ddd2
Market Cap
$.
Change
.
24h Vol
$.
Holders
.
COVENANT
C
bade
b
COVENANT
0xcd...de79
Market Cap
$.
Change
.
24h Vol
$.
Holders
.
Q
Q
bade
b
Q
0xc0...0589
Market Cap
$.
Change
.
24h Vol
$.
Holders
.
Gato
G
bade
b
Gato
55A3...pump
Market Cap
$.
Change
.
24h Vol
$.
Holders
.
$STRK This 12.86% plunge is a high-risk game, so I placed a limit order at 0.0635 and picked up the first batch. First, a position update: I’m currently flat and waiting for an entry. I closed yesterday’s short from 0.0710 at 0.0652 to take profit, capturing most of this drop. The 24h low of 0.0631 landed right at the lower edge of a previous high-volume trading zone. Turnover of 148.9M is clearly up, suggesting that some buyers are picking up coins amid the panic selling. But the large bearish candle from 0.0747 to 0.0631 had no meaningful rebound, so short-term sentiment remains bearish.
My
STRK-11.68%
I think the current crypto market is in the early recovery phase after the cycle low, currently pulling back and waiting for secondary confirmation:
• BTC at around $81,500, down about 35% from its October 2025 ATH of $126,000
• This cycle’s low was around $58,000 in June-July 2026 (a drawdown of about 54%, relatively shallow historically)
• Q3 total market cap rose 39.6% to nearly $3T, with ETFs returning to net inflows
• Fear & Greed Index at around 53 (neutral)
• BTC dominance at around 59-60%
Institutional consensus: the bear market is over, and the market is transitioning from acc
post-image
ETH-0.88%
BTC-0.21%
#DOGE DOGE ETF switches from consecutive net inflows to redemptions! Can the $0.08 support hold?
Dogecoin fever cools! ETF funds flee, with $0.08 becoming a crucial line in the sand🐶
Once wildly popular Dogecoin (DOGE) is now facing a subdued market atmosphere. Dogecoin ETFs had previously seen three consecutive weeks of inflows, but the trend completely reversed in October as institutional funds began to pull out, putting considerable pressure on the price.
📉ETF funds see $540k in outflows over two days.
According to SoSoValue data, spot Dogecoin ETF flows were virtually flat from October 1
post-image
ThisIsTranslateContent:
#DOGE DOGE ETFs switch from consecutive net inflows to redemptions! Can the $0.08 support hold?
Dogecoin hype cools! ETF funds flee, with $0.08 becoming a make-or-break line🐶
Dogecoin DOGE, once hugely popular, is now facing a subdued market atmosphere. Dogecoin ETFs had previously seen three consecutive weeks of inflows, but the trend completely reversed in October as institutional funds began to pull out, putting significant pressure on the price.
📉ETF funds see $540,000 in outflows over two days.
According to SoSoValue data, from October 1 to 9, flows in and out of Dogecoin spot ETFs were virtually flat, with no funds entering or leaving. Instead of a turnaround, a wave of redemptions followed. Around $400,000 flowed out on October 12, followed by another $138,600 on the 13th, bringing total outflows to $540,000 in just two days.
Fund net assets also shrank from nearly $17 million at the start of the month to $14.44 million. The retreat of institutional funds is a major headwind DOGE must now face.
📊The price continues to weaken, with bearish technical indicators.
DOGE is down 14% overall this month. It was still holding at $0.095 at the start of the month, but slid steadily after October 7 and is now trading at around $0.0800.
Although it briefly rebounded to a high of $0.088 on the 12th, the recovery was short-lived, and the price quickly fell again, touching a low of $0.08. Technical indicators are also unpromising: the RSI has fallen below its signal line, while the CMF money flow indicator briefly dropped to near -0.90 and has now recovered to -0.30, indicating that the overall trend of capital outflows remains unchanged.
⚖️Futures market sees a tug-of-war between bulls and bears, with bullish positions weakening.
Signals from the derivatives market are mixed. DOGE open interest first surged to $652 million, then fell to $598 million before edging back up to $609 million. The funding rate remains positive at 0.0088%, indicating that the market still retains some long positions, with bulls continuing to pay fees to bears. However, the overall decline in open interest means bullish momentum in the futures market is weakening.
📌Market Summary and Key Points to Watch
$0.08 is a key short-term support level for DOGE. If it breaks decisively below this level, pressure on bulls will intensify sharply, and the price could fall further. The market is currently weak overall, and the rebound lacks strength, so it is unwise to blindly buy the dip. Watch closely to see whether the $0.08 support holds.#WCTCS9
repost-content-media
DOGE-1.74%
#KOSPIJumps3.3% #ShareWeekly
KOSPI Rebounds After a 7.6% Crash: Is the Semiconductor Sell-Off Over, or Is More Volatility Ahead?
The Asian stock market experienced a dramatic shift on October 15–16, 2026, as semiconductor stocks came under heavy selling pressure before staging a partial recovery. South Korea’s KOSPI index suffered a sharp 7.6% decline on October 15, dropping to 5,554 points and triggering a circuit breaker. The index touched its lowest level since April, highlighting how quickly market sentiment can change when inflation concerns, interest-rate expectations, and uncertainty s
SK Hynix+0.79%
JPN225+0.29%
NAS100-0.53%
CXMT-1.78%
My friend shorted $AGT , $Q and $BTW today. All three. Same day.
His logic was solid: “It’s already up 65%. It can’t go higher.”
$AGT hit 0.1048 and kept going.
Then he said, “Okay, $Q is up 119%. That’s insane. Now THIS one has to dump.” It printed another green candle while he was typing the order.
By then he was angry, so he went for the third one: “$BTW is only up 34%, there’s still room for a clean short.” The chart made a new high and he made a new lesson.
The funny part is that Q’s funding was negative. Shorts were paying longs to stay in the trade. He literally paid a fee to be wrong
post-image
AGT+30.54%
Q+116.61%
BTW+26.10%
  • 1
$CT I took the full -12.73% hit on this move: entered at 0.385, cut at 0.34, down 11 points. The post-mortem is simple: greed. Before the Fed minutes, I clearly saw $CT 24h volume shrink to just over 20M and large on-chain transfers start flowing out, but I still fantasized that dovish minutes would spark a rally. Instead, the minutes were hawkish, and $CT plunged straight through 0.35, hitting a low of 0.3155. I set my stop at 0.34 and at least stuck to my discipline, but the entry thesis itself was wrong—loading up on a small-cap token ahead of a macro event; correlation is no excuse, I was
CT-14.32%
Hong Hao: The current market has entered oversold territory and is in the final stages of the sell-off. All risk assets are oversold, and a rebound is highly likely before the end of the year.
post-image
If you had invested $10k in the best-performing assets a month ago, the difference in returns would be astonishing...=> $NEA
=> $AD
=> $LIN
post-image
LIN+1.04%
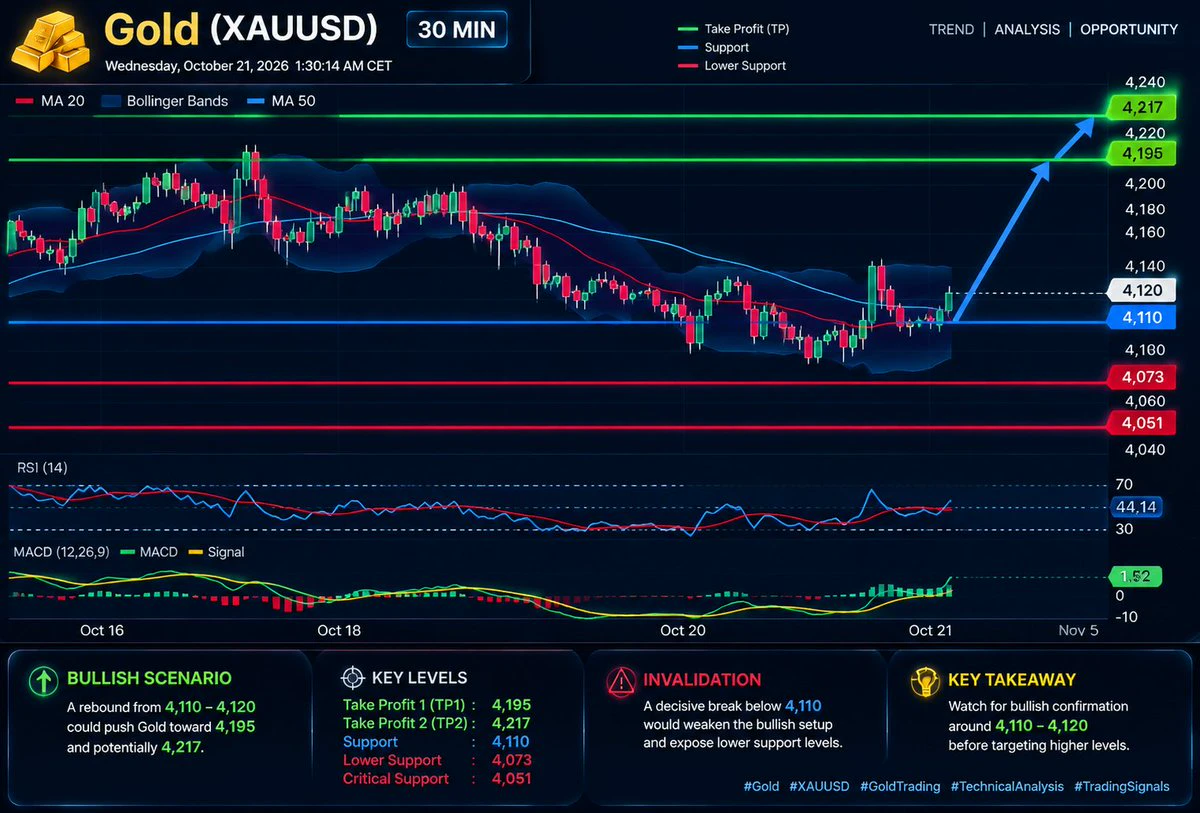
Let’s start with a term: weekend gold prices.
The $XAU on screen isn’t gold moving now; it’s quotes with no takers shifting around.
Only 5.97 million traded in the last hour, compared with 150 million in a single hour a few days ago.
“Breaking above 4205 means a new rally.”
I’ve heard that twice in the past three days. Here are the numbers:
1. 4205.65 was touched only once, at 10-16 22:00, and it hasn’t gone higher since.
2. Since then, over the past 34 hours, it has steadily ground back to 4164.07.
3. The 24-hour range is 4157.36 to 4173.66, a spread of 0.39%.
With a range this narrow, it’s
post-image
XAU-0.19%
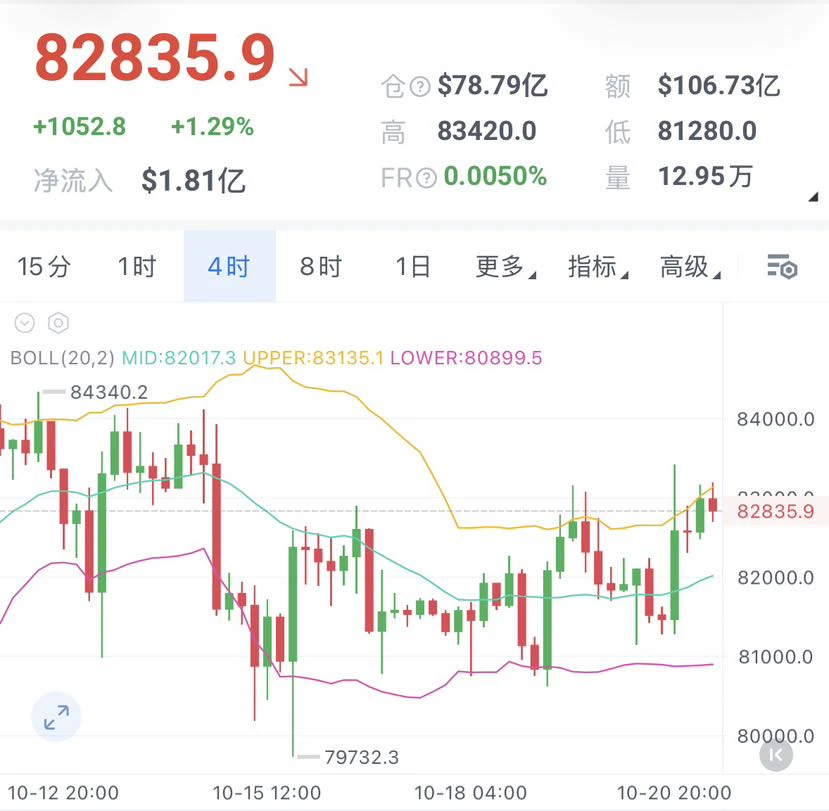
Bitcoin at $81,500: Bulls and Bears in a Standoff
Bitcoin is trading around $81,500 on Saturday, October 17, 2026, caught in a notable technical standoff where short-term bearish moving averages clash with a significantly healthier long-term structure.
With a market cap of roughly $1.639 trillion, daily trading volume of $13.967 billion, and a 24-hour range of $81,108.80 to $81,733.01, the market has settled into a narrow consolidation phase, leaving traders to decide whether the latest accumulation is the start of a recovery or just a pause before support gets tested again.
⚠️ Personal market
post-image
BTC-0.21%
$UNI has reached 7.185 USDT, but one-hour trading participation is only 0.66x, showing some weakness. The price is approaching the one-hour resistance at 7.36, but whether it can truly break through and hold remains to be seen. This looks more like a tentative breakout than a genuine hold.
The price has reached the threshold, but touching, breaking through, and holding are three different things. If $UNI can decisively break above 7.36 and stay above that level, it would be a positive signal. But if the price fluctuates repeatedly around 7.36, or even falls back to the one-hour support at 6.99
post-image
UNI-1.69%
#USMemoryStocksExtendLosses
#ShareWeekly
US MEMORY STOCKS UNDER PRESSURE: IS THE AI MEMORY BOOM LOSING MOMENTUM OR CREATING A NEW BUYING OPPORTUNITY?
The recent selloff in memory and storage stocks has created a major debate across the technology sector. Micron Technology (MU), SanDisk (SNDK), Western Digital (WDC), and Seagate Technology (STX) are facing renewed selling pressure after an extraordinary rally driven by artificial intelligence infrastructure, data centers, and rising demand for high-performance storage.
However, I believe the most important question is not simply why these sto
MU-5.66%
SNDK-6.90%
WDC-6.91%
STX-7.45%
SK Hynix+0.79%
‍#每周来晒 #WCTCS9
Preview of Next Week’s Major Financial Events
2026-10-19 (Monday)
10:00 China’s Q3 GDP, September industrial value added, fixed-asset investment, and total retail sales of consumer goods
22:00 US October NAHB Housing Market Index
2026-10-20 (Tuesday)
09:15 China’s October LPR quotation 17:00 Eurozone October ZEW Economic Sentiment Index 20:30 US September housing starts and building permits
22:00 US September pending home sales index MoM
NVIDIA GTC conference (10.20–10.22)
2026-10-21 (Wednesday)
16:00 UK September CPI YoY
22:30 US EIA crude oil inventories for the week ending O
post-image
NVDA-1.42%
TSLA-2.17%
SPGI+1.13%
Something doesn't look right. $AVA is currently at 0.3957, up 34.73% in 24 hours, but look at this candle—the low was 0.2810, the high was 0.4226, a 50% swing, with $72.9M in trading volume. This isn't normal turnover; someone's aggressively sweeping up.
Three possibilities: first, someone positioned early in the derivatives market, with spot buying helping push the price up; second, low-priced holders have finished rotating their positions, and the whales are testing the selling pressure above; third, it's a pure sentiment-driven short squeeze, with 24-hour volume piling above $70M as short-
AVA+37.11%
PPI rises 6.3% year over year, highest since 2022; energy is “eating” the entire economy
Yesterday, when the PPI data came out, I was looking at Gate’s candlestick chart. The moment the numbers appeared, my first thought was, “I must be reading that wrong.”
September PPI rose 6.3% year over year, versus expectations of 5.4% and a previous reading of 5.4%. It rose 1.3% month over month, versus expectations of 0.6% and a previous reading of 0.4%. Core PPI rose 5.0% year over year, versus expectations of 4.4%. Core PPI rose 0.7% month over month, versus expectations of 0.3%. All figures significa
MU-5.66%
What Warsh Said—and Didn’t Say: Reading Between the Lines of His IMF Fireside Chat
At 11:30 this morning, Fed Chair Warsh had a fireside chat with IMF Managing Director Georgieva at the IMF annual meeting in Bangkok. I watched the livestream from start to finish, looking for clues in his wording about an October rate hike. In the end, he said almost nothing.
Warsh’s exact words were: “I don’t prejudge the decision at any meeting. I don’t think it’s appropriate to preview what actions I might take at the remaining meetings this year.” He only made one remark while looking back at September’s ra
AAPL+0.43%
Market anylysis today BTC and other coin 👛🪙
live-cover
LIVE1,724
Load More

Join 40 M users in our growing community

⚡️ Join 40 M users in the crypto craze discussion

💬 Engage with your favorite top creators

👍 See what interests you

Trending Topics

USSeptemberPPIBeatsExpectations

91.35k Views1.93k Discussing

US September PPI came in at 6.3% YoY, well above the 5.3% market expectation, pointing to renewed producer-side inflation pressure. Weekly jobless claims were 199K, broadly in line with forecasts. Could hotter inflation further reduce room for rate cuts, and what does it mean for $BTC, US stocks, and gold?

GateWCTCS9GlobalTradingCompetition

37.87k Views6.68k Discussing

GateBTCAndETHFuturesVolumeRanksTop3

53.8k Views1.81k Discussing

View More