
$XAU
#TradFiCFDGoldMasters
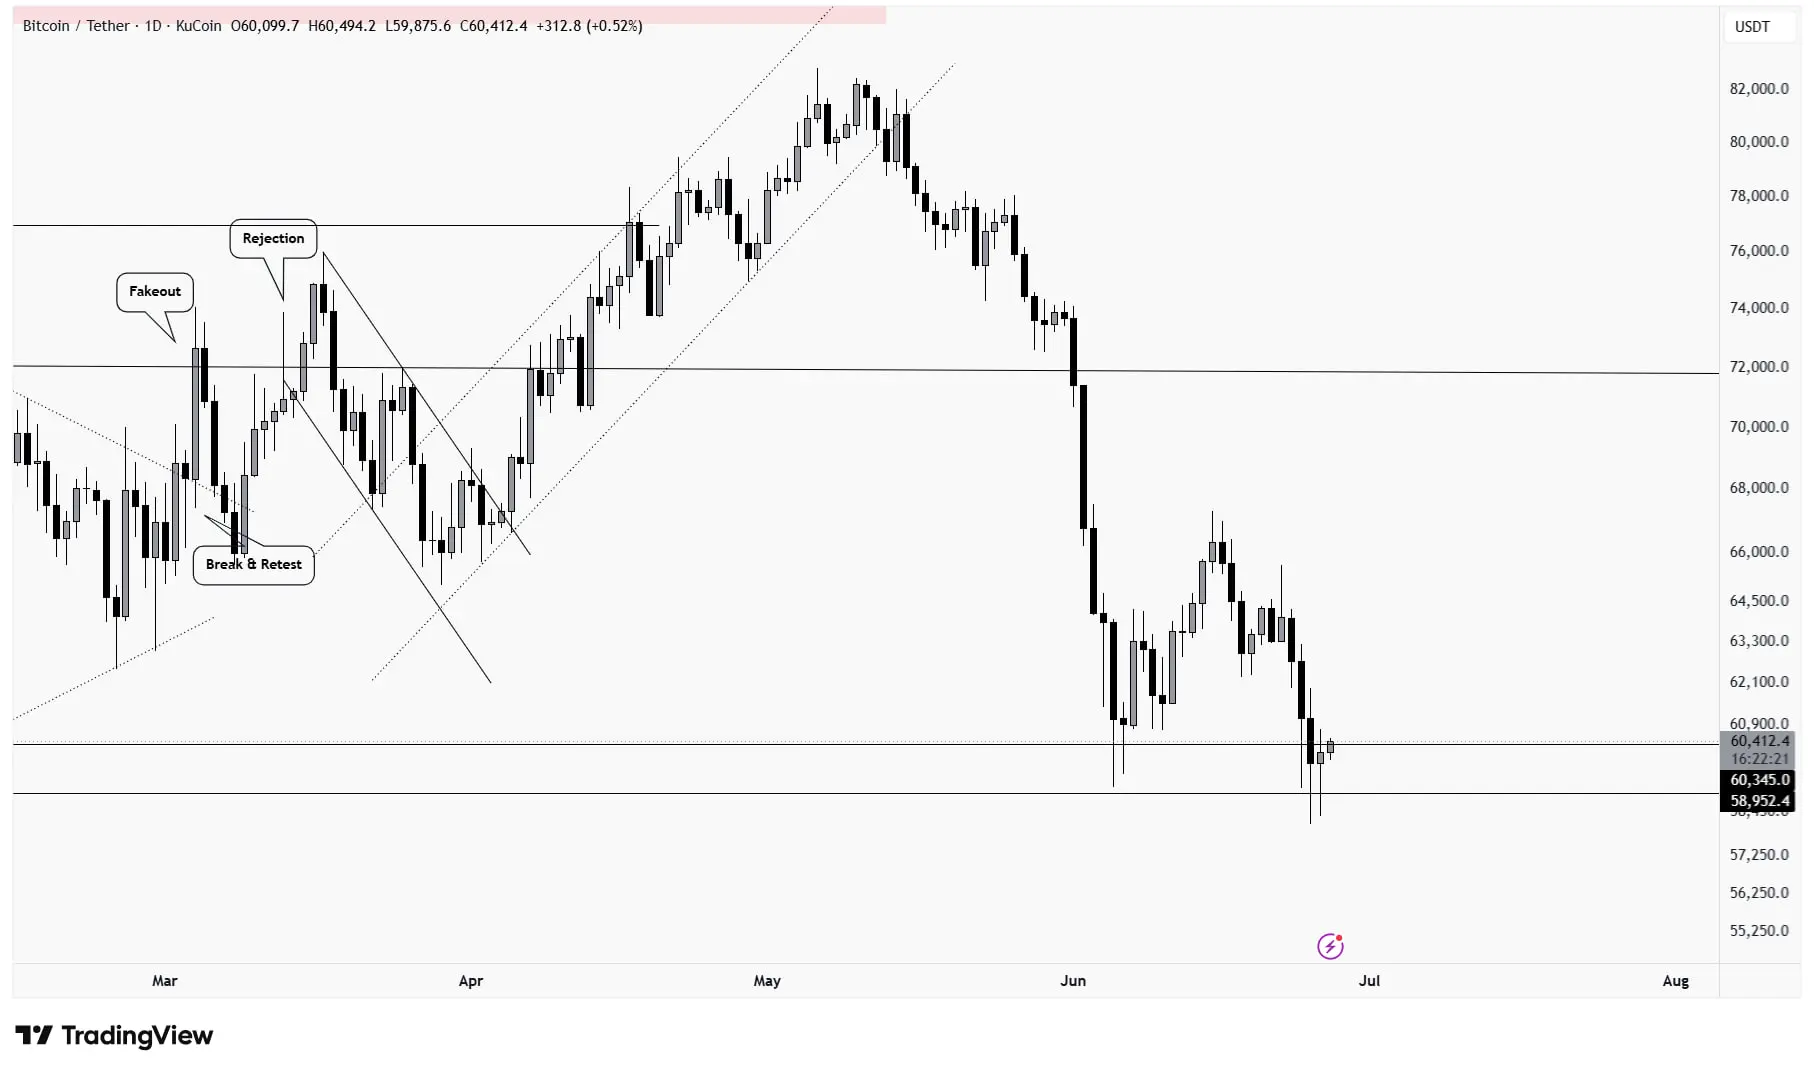
Gold has experienced a dramatic reversal, breaking below the psychologically significant $4,000 level for the first time since November 2024. As of June 26, 2026, spot gold is trading around $3,982 per ounce, representing a decline of over 1.7% in recent sessions. This move has caught many momentum traders off guard and is creating significant opportunities for CFD traders who understand the technical landscape.
The breakdown below $4,000 is technically significant. Gold had been trading below its 200-day moving average for approximately 13 consecutive sessions, and the decisive break of the $4,006-$4,098 support zone has accelerated selling pressure. The 38.2% Fibonacci retracement level from the September 2022 low sits at $4,079, and gold has now violated this key technical marker. For CFD traders, this opens potential short opportunities with targets at $3,900 and $3,850, while stops above $4,040 provide logical risk management.
The fundamental drivers behind this selloff are multifaceted. The U.S. dollar has strengthened to its highest level in over 13 months, making dollar-denominated gold more expensive for foreign buyers. Expectations of Federal Reserve rate hikes have been repriced aggressively by markets, with Treasury yields climbing and reducing the opportunity cost of holding non-yielding assets like gold. Additionally, ETF outflows and rotation into AI-driven equities have removed significant capital from precious metals.
However, experienced CFD traders should note that gold has now reached a critical technical juncture. The $3,980-$4,000 zone represents major structural support, and any sustained move below $3,980 could accelerate momentum toward $3,800. Conversely, a reclaim of $4,020-$4,040 would signal potential exhaustion of selling pressure. The gold-silver ratio has expanded to 68.6-to-1, historically a level that precedes silver outperformance once sentiment stabilizes.
For CFD positioning, current conditions favor disciplined range-trading strategies. The volatility expansion offers enhanced profit potential, but risk management is paramount. Traders should monitor the 10-year Treasury yield near 4.4% and dollar index strength as leading indicators for gold's next directional move.
#TradFiCFDGoldMasters
Gold has experienced a dramatic reversal, breaking below the psychologically significant $4,000 level for the first time since November 2024. As of June 26, 2026, spot gold is trading around $3,982 per ounce, representing a decline of over 1.7% in recent sessions. This move has caught many momentum traders off guard and is creating significant opportunities for CFD traders who understand the technical landscape.
The breakdown below $4,000 is technically significant. Gold had been trading below its 200-day moving average for approximately 13 consecutive sessions, and the decisive break of the $4,006-$4,098 support zone has accelerated selling pressure. The 38.2% Fibonacci retracement level from the September 2022 low sits at $4,079, and gold has now violated this key technical marker. For CFD traders, this opens potential short opportunities with targets at $3,900 and $3,850, while stops above $4,040 provide logical risk management.
The fundamental drivers behind this selloff are multifaceted. The U.S. dollar has strengthened to its highest level in over 13 months, making dollar-denominated gold more expensive for foreign buyers. Expectations of Federal Reserve rate hikes have been repriced aggressively by markets, with Treasury yields climbing and reducing the opportunity cost of holding non-yielding assets like gold. Additionally, ETF outflows and rotation into AI-driven equities have removed significant capital from precious metals.
However, experienced CFD traders should note that gold has now reached a critical technical juncture. The $3,980-$4,000 zone represents major structural support, and any sustained move below $3,980 could accelerate momentum toward $3,800. Conversely, a reclaim of $4,020-$4,040 would signal potential exhaustion of selling pressure. The gold-silver ratio has expanded to 68.6-to-1, historically a level that precedes silver outperformance once sentiment stabilizes.
For CFD positioning, current conditions favor disciplined range-trading strategies. The volatility expansion offers enhanced profit potential, but risk management is paramount. Traders should monitor the 10-year Treasury yield near 4.4% and dollar index strength as leading indicators for gold's next directional move.