Share crypto content and earn up to 60% commissions through content mining.
placeholder
gatefun
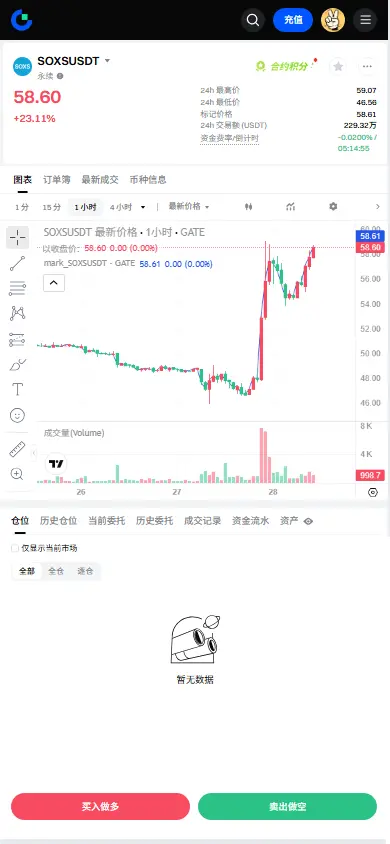
$SOXS Signal | 1H momentum continuation + negative funding rate, bulls hunting
$SOXS The 1H MACD histogram keeps expanding, and the price is moving up while stepping on the Bollinger mid-band. Buy-depth is 1.92x stronger than sell pressure, which is being quickly absorbed. The 4H RSI is 69, not yet in an extreme zone, but the 1H RSI is 75.89, so short-term momentum feels a bit crowded. A negative funding rate of -0.0377% combined with stable OI means the intention to support prices is clear; the risk-reward here is still acceptable.
🎯Direction: Long
⚡Entry / Place orders: 58.9626 - 59.1400
🛑
View Original
post-image
  • Reward
  • Comment
  • Repost
  • Share
SPOT PREDICTION MARKET
gate liveLIVE
1,782
live-coin
  • Reward
  • Comment
  • Repost
  • Share
JUST IN: US spot BTC ETFs logged net outflows ($11.6M) while spot ETH ETFs posted net inflows ($11.7M) yesterday, led by BlackRock on ETH side. Net flows hint shifting demand between BTC and ETH ETFs. $BTC $ETH
post-image
  • Reward
  • Comment
  • Repost
  • Share
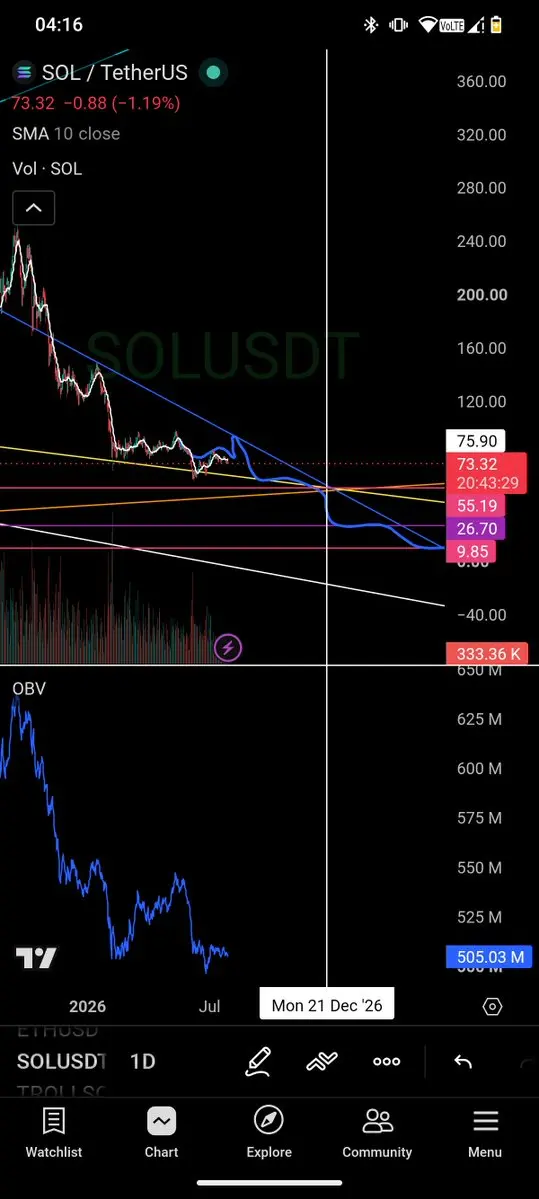
U can keep your $eth
I'll dance with $sol here
post-image
  • Reward
  • Comment
  • Repost
  • Share
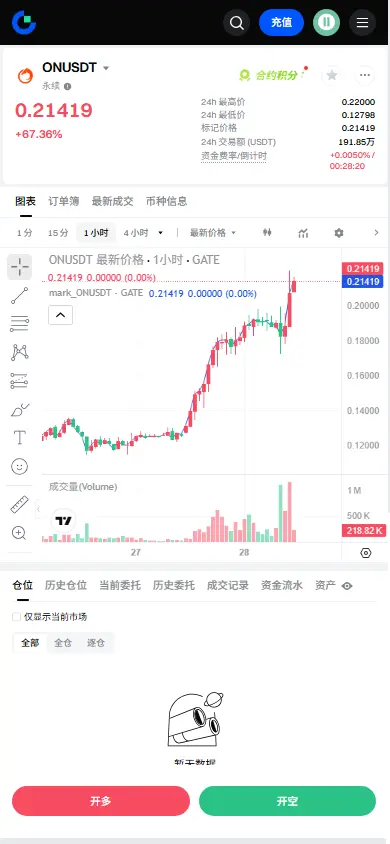
【$ON Signal】1H bulls continue + funds steadily pushing up
After $ON breaking above 0.217 on the 1H timeframe and falling back to the 0.212 area, buy-side depth at 1.31 shows strong support. The 4H Bollinger Band upper rail at 0.202 has already been broken, and the current price is above the 1H Bollinger midline at 0.186. RSI on 1H is 79.65 at a high level but has not formed a bearish divergence at the top. MACD on 1H golden cross continues, and the 4H MACD histogram at 0.0085 is still expanding. The funding rate is 0.0619%, moderate, with no overheating signs.
Current short-term momentum has
View Original
post-image
  • Reward
  • Comment
  • Repost
  • Share
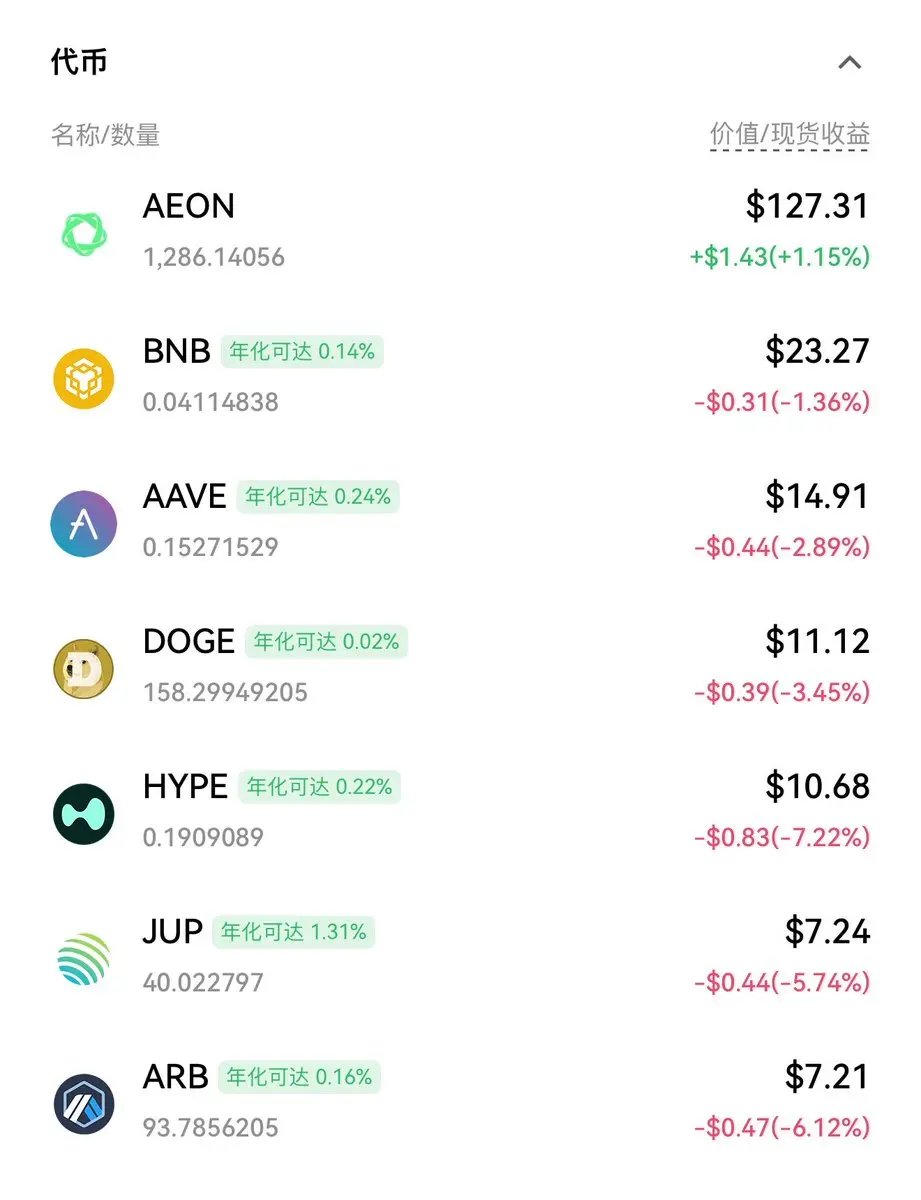
Bought $100 $AEON with no reason
I just think it’s a dark horse; currently up 30%
View Original
post-image
  • Reward
  • Comment
  • Repost
  • Share
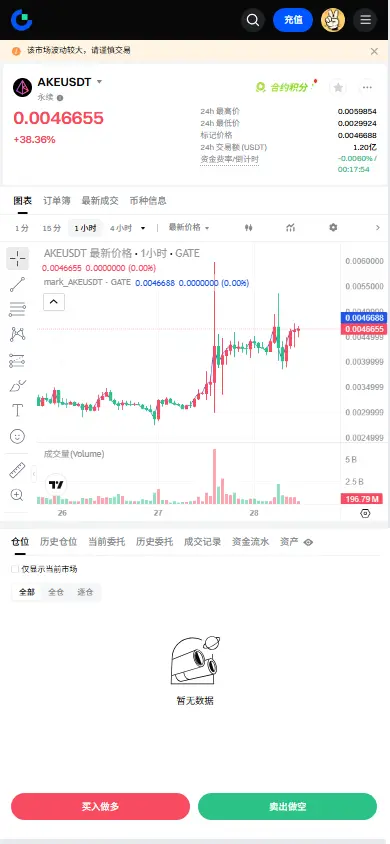
$AKE Signal】Go long | Buy pressure depth crushes, pushing up with a quick stab
$AKE Buy pressure depth is 3.80, and sell pressure is rapidly absorbed. The 4H MACD bullish histogram keeps expanding; the 1H MACD histogram shrinks, but the fast and slow lines remain above the zero axis. RSI on 1H at 61.46 is not overheated; on the 4H Bollinger Bands, there is dense positioning of chips near the upper band around 0.0046. Stop loss is only 2.1%; the buy orders are thick, and the value for short-term trading is still acceptable.
🎯 Direction: Go long
⚡ Entry / place orders: 0.004573438 - 0.004587
AKE36.99%
View Original
post-image
  • Reward
  • Comment
  • Repost
  • Share
JUST IN: SK Hynix (SKHX) saw a 17.9% flash crash on Hyperliquid driven by a single oversized pre-market trade, triggering liquidity gaps and rapid arbitrage across exchanges. $SKHX
post-image
  • Reward
  • Comment
  • Repost
  • Share
#CLARITYActEntersFinalCriticalStage
#CLARITYActEntersFinalCriticalStage marks one of the most important moments for the digital asset industry in recent years. As blockchain technology continues to expand across global finance, payments, tokenization, decentralized applications, and Web3 innovation, the demand for a clear and consistent regulatory framework has become stronger than ever. Reaching this critical stage represents more than legislative progress—it reflects the growing recognition that digital assets are becoming a permanent part of the modern financial system.
For years, regulato
post-image
post-image
  • Reward
  • 1
  • Repost
  • Share
HighAmbition:
2026 GOGOGO 👊
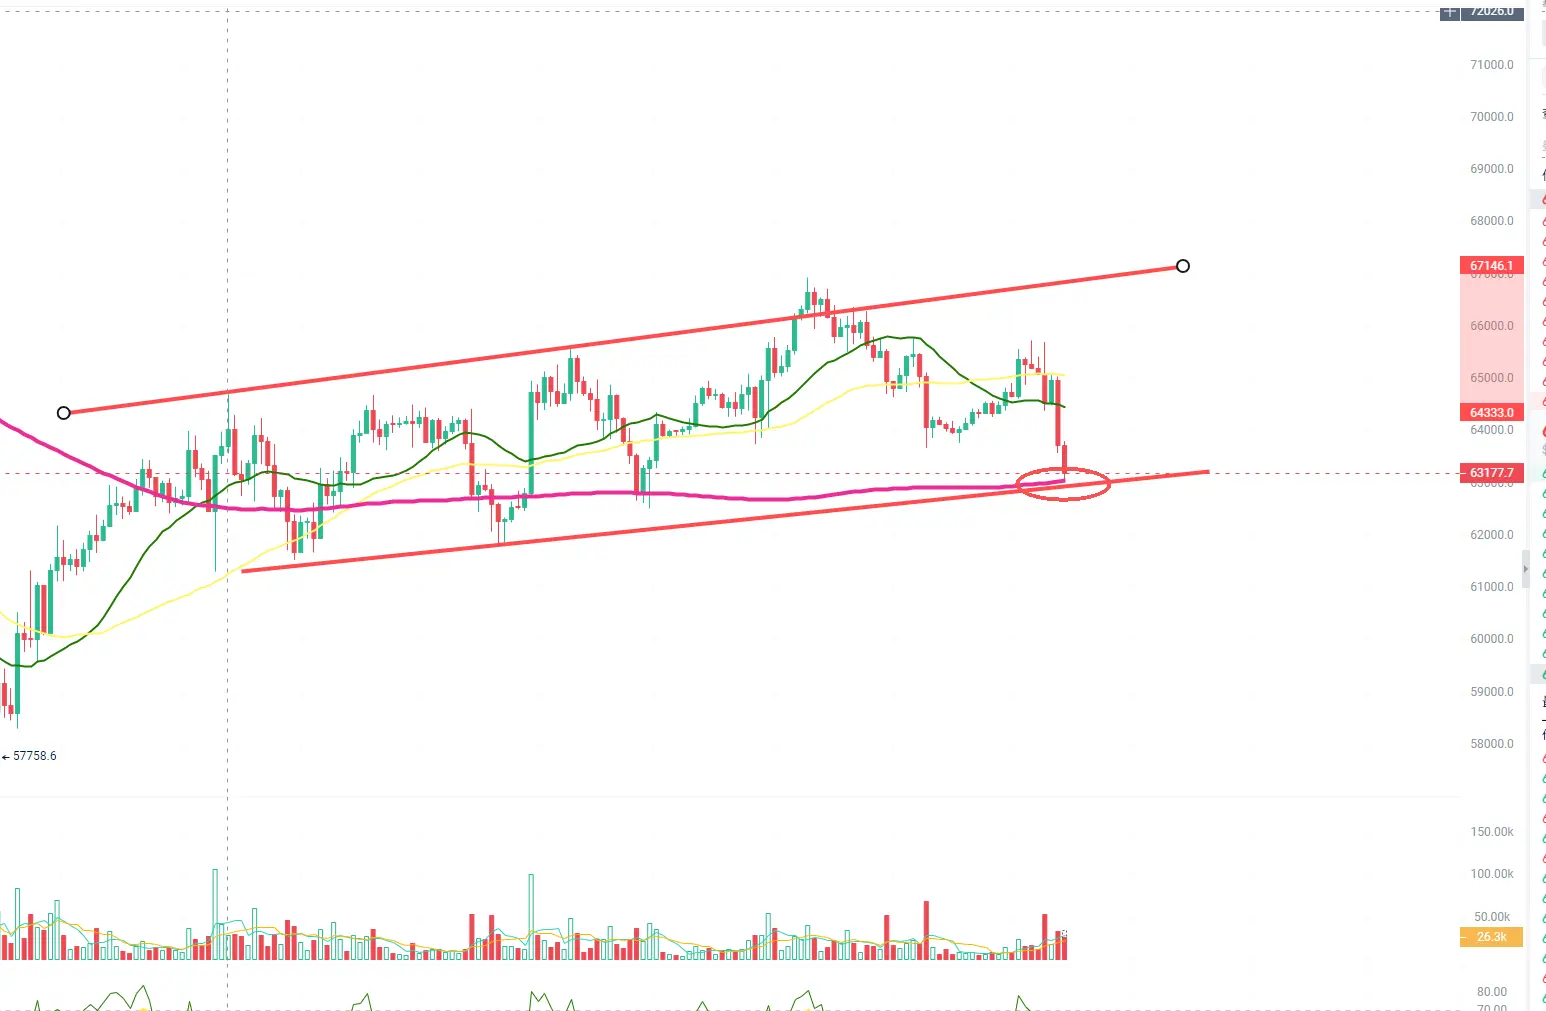
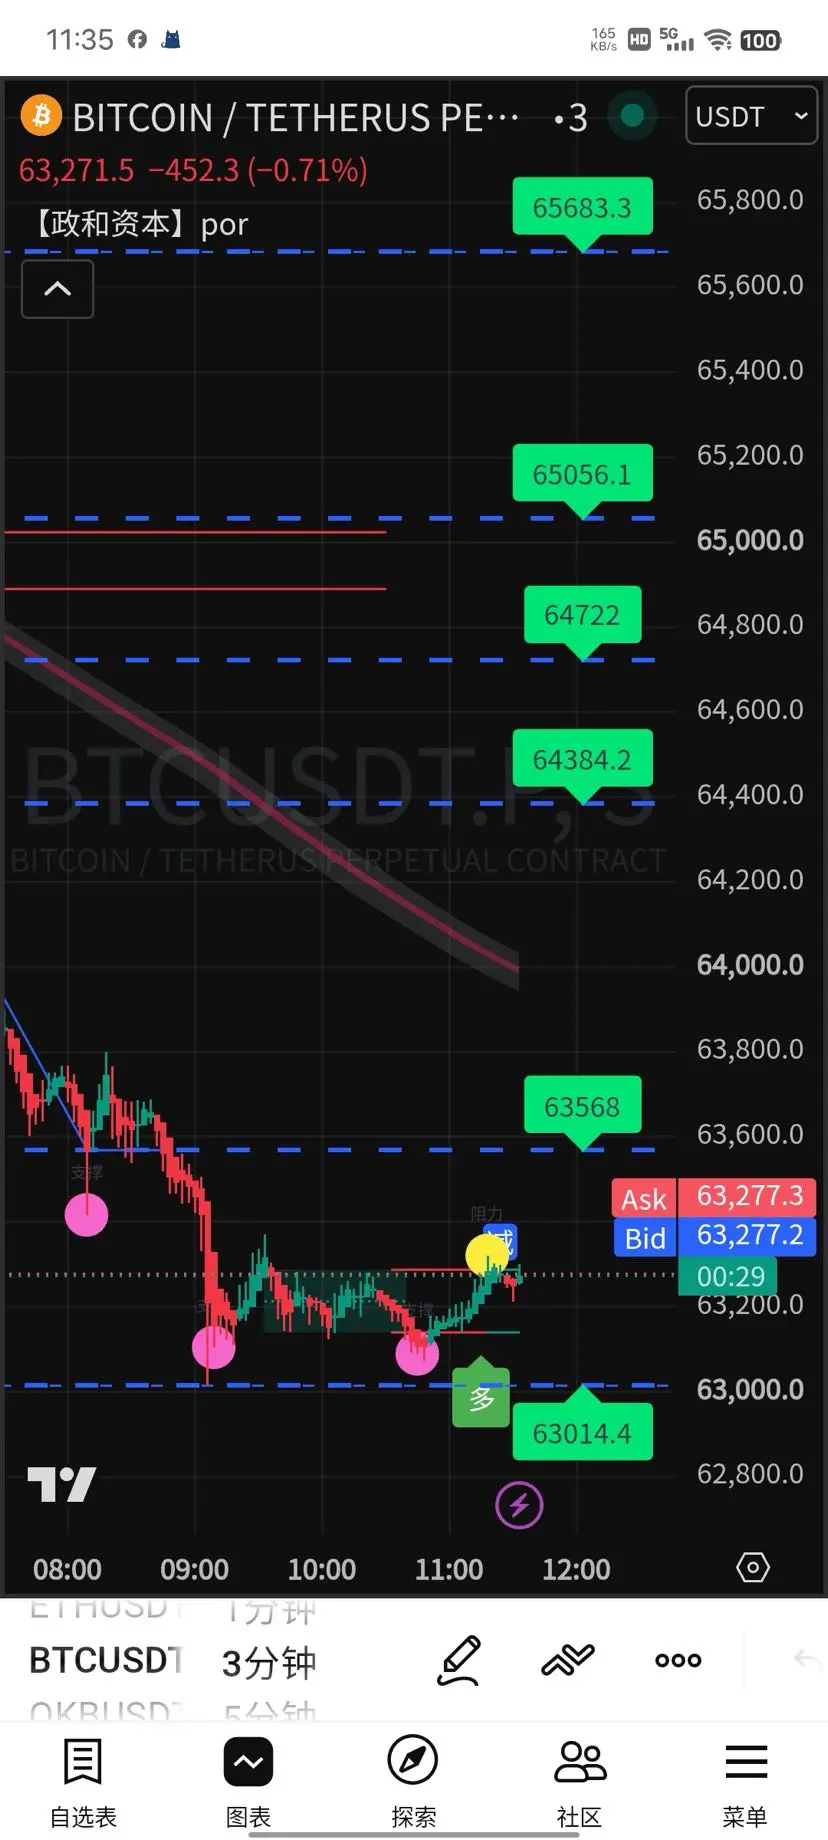
BTC is now around 6.31w, still trading within the channel and has not broken down. On the 4-hour timeframe, it has already fallen to major support—this line has been tested several times before, but it hasn’t been truly broken through. The support strength is still there.
At this level, don’t rush to take action first. Wait and see the result of this test. If this test also holds, it means the “buyers catching the dip” power below is still strong enough, and you can consider going long according to the plan. If this time it directly breaks below, it means the lower edge of this channel can’t h
View Original
post-image
  • Reward
  • Comment
  • Repost
  • Share
hyperscalers trading as if they're about to miss earnings
semiconductors/memory trading as if they pumped a thousand percent prior [they did]
yields trading as if there's a rate hike incoming
Korea trading as if they caught aids
VIX & USD/JPY trading as if we all about to die
post-image
  • Reward
  • Comment
  • Repost
  • Share
Nobody goes broke because the chart is red.
They go broke because they hit sell on the red.
Hold, and it is a dip. Fold, and it is a loss.
post-image
  • Reward
  • Comment
  • Repost
  • Share
GM. Jersey Mike's Direct IPO allocation calculation begins today — anyone here participating? Let me know if you get a piece.
post-image
  • Reward
  • 4
  • Repost
  • Share
Crypto_Buzz_with_Alex:
Good morning 🌄
View More
Short the market in the morning—perfect retracement! Execute decisively, refuse to be a bystander in the market! $BTC $ETH #Strategy首次回购STRC
BTC-3.10%
ETH-3.39%
View Original
post-image
post-image
post-image
  • Reward
  • Comment
  • Repost
  • Share
BlackRock expands AI infrastructure investment! Will BTC & ETH benefit from stronger market confiden
gate liveLIVE
362
live-coin
  • Reward
  • Comment
  • Repost
  • Share
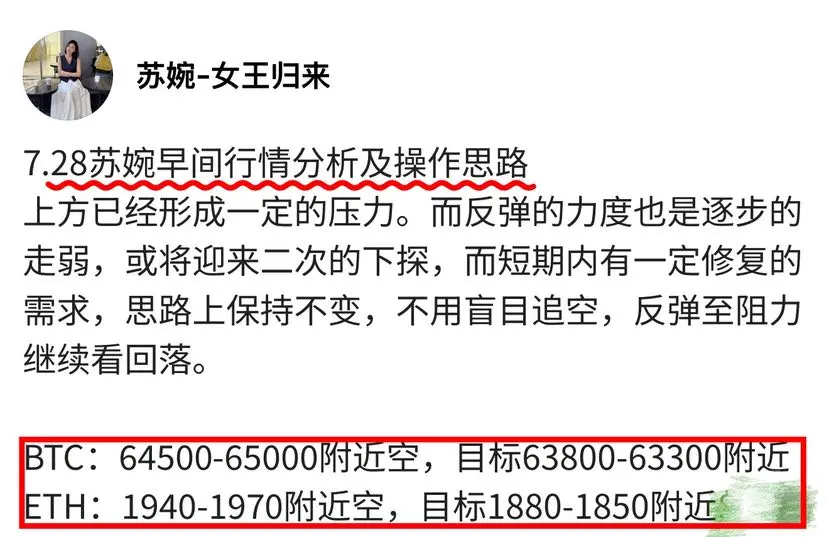
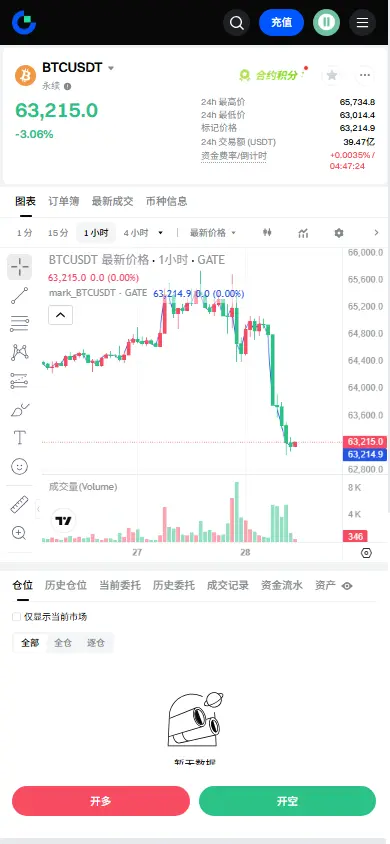
7.28 BTC analysis
Analysis: Around 630, go long lightly; target 640.
Short-sell on any rebound in the 640–645 area; defend at 650; if it moves from 630 to 620, be careful.
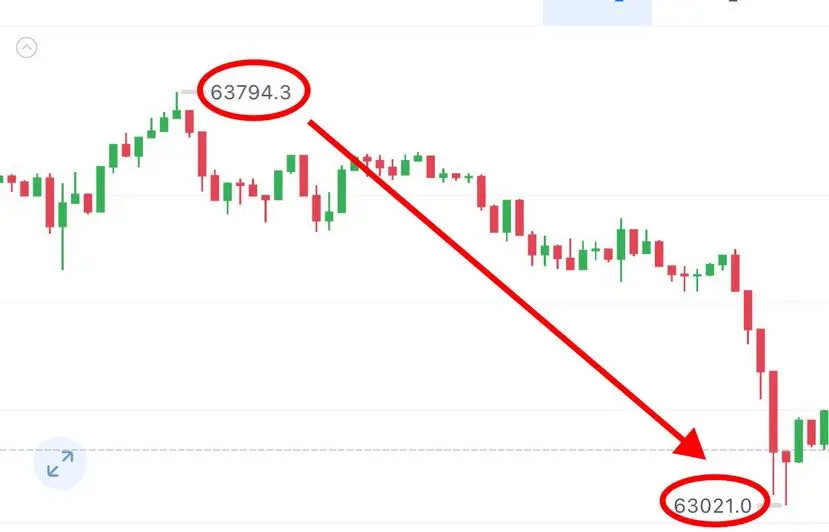
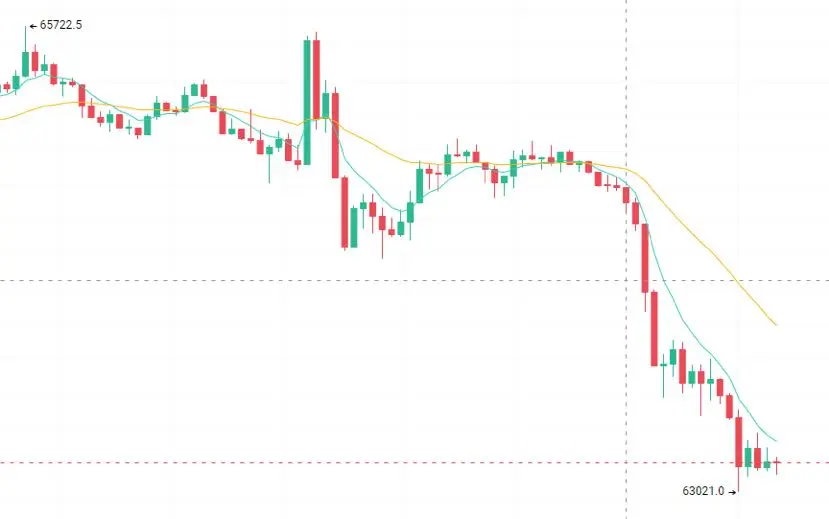
Looking at BTC on the 1-hour chart: after yesterday surged to 65780, it quickly pulled back, with the lowest wick around 63021. The current price is consolidating and trading in the 63200 area. In the short term, the price has broken below the moving-average support, and bearish power is being concentrated and released. However, around 63000, buy support is relatively strong; this level is the key defensive zone for bulls
BTC-3.10%
View Original
post-image
  • Reward
  • Comment
  • Repost
  • Share
July 28, 2026, Tuesday BTC/USDT Perpetual Futures Technical Analysis
I. Overall market tone
On Tuesday, market liquidity is abundant throughout the day, with increased activity from institutional funds. Following the historical pattern, Tuesday largely completes the price repair after Monday’s intraday spike, confirming short-term genuine long/short momentum. However, the daily and medium-to-long-term bearish pressure has not been fully lifted. In the short term, BTC is trading in a wide-range consolidation box of 63,800–65,800. The low point rising slightly is merely a technical rebound after
BTC-3.09%
View Original
post-image
  • Reward
  • Comment
  • Repost
  • Share
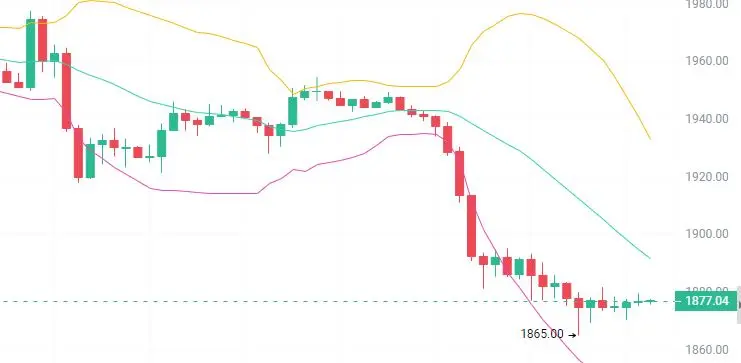
Today Erbing’s Morning Thoughts
**Actions:**
Go long near 1870-1860
First target: 1900-1930
Second target: above 1950
Short: near 1950-1960, take a light short, take good care of your hedging, target: 1880-1860
Currently, this is reduced-volume, tight-range consolidation, and there hasn’t been panic selling—so there’s no basis for a violent oversold rebound. Going long requires patience: wait for the price to break out above the top of the short-term trading range with volume, and confirm it has firmly held before following with a light position. The targets are only for a pullback int
View Original
post-image
  • Reward
  • Comment
  • Repost
  • Share
【$BTC Signal】Breakdown in the 1H oversold zone accelerates; capital defends passively
$BTC Depth imbalance -94.55%, buy orders on the book are essentially useless. 1H RSI 23.73 has entered an extreme oversold zone, but the MACD green histogram is still expanding; downside momentum has not yet exhausted. The 4H Bollinger lower band at 63373 has been broken, the bands are widening, and the bears are taking control of the pace.
🎯 Direction: short
⚡ Entry / limit orders: 62997.85 - 63173.00
🛑 Stop loss: 64048.76
🚀 Target 1: 61859.35
🚀 Target 2: 61202.53
🛡️ Trade management: after reaching t
View Original
post-image
  • Reward
  • Comment
  • Repost
  • Share
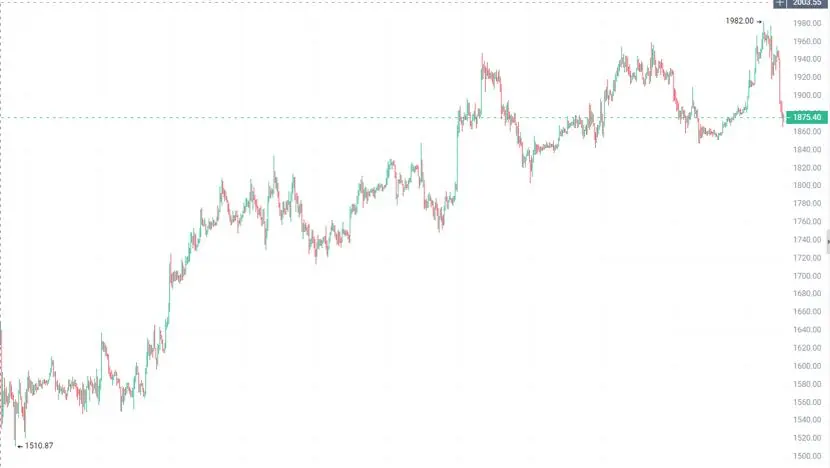
Key resistance above: 1920-1940. Daily Bollinger midline + EMA dual suppression. A breakout and hold = bulls recover cash, target 1983-2000.
Key support below: 1850-1860. 4-hour Fibonacci 38.2% support. A breakdown = bears take over, target 1820-1800.
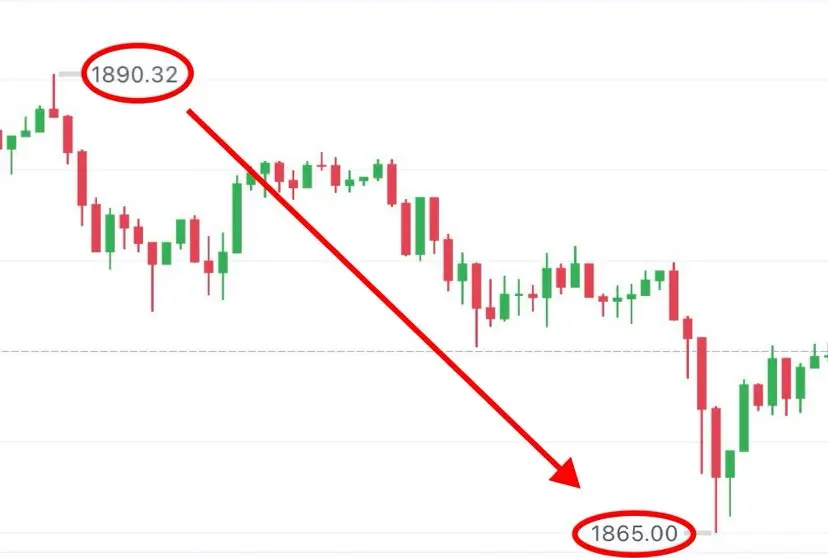
After ETH surged to 1983 then rolled over and kept dumping down to 1866, it fell more than 3% over 24 hours. On the daily level, it’s still range-bound at high levels, and upside momentum is clearly slowing. With the US-Iran ceasefire diplomacy window opened, oil prices crashed more than 8%, once pushing ETH back to 1983; but the FOMC rate decisi
ETH-3.40%
View Original
post-image
  • Reward
  • 1
  • Repost
  • Share
SwingDancer:
The ETH rally driven by the Iran–Israel ceasefire and the oil price crash is only a fleeting moment. A 4-hour death cross combined with weaker BTC correlation means the 1,850–1,860 level is crucial; once it breaks below, upside room opens. But institutions are still accumulating, so for the long term you can test a long position with a small size; for the short term, wait for signals.
Load More

Join 40 M users in our growing community

⚡️ Join 40 M users in the crypto craze discussion
💬 Engage with your favorite top creators
👍 See what interests you
  • Pinned