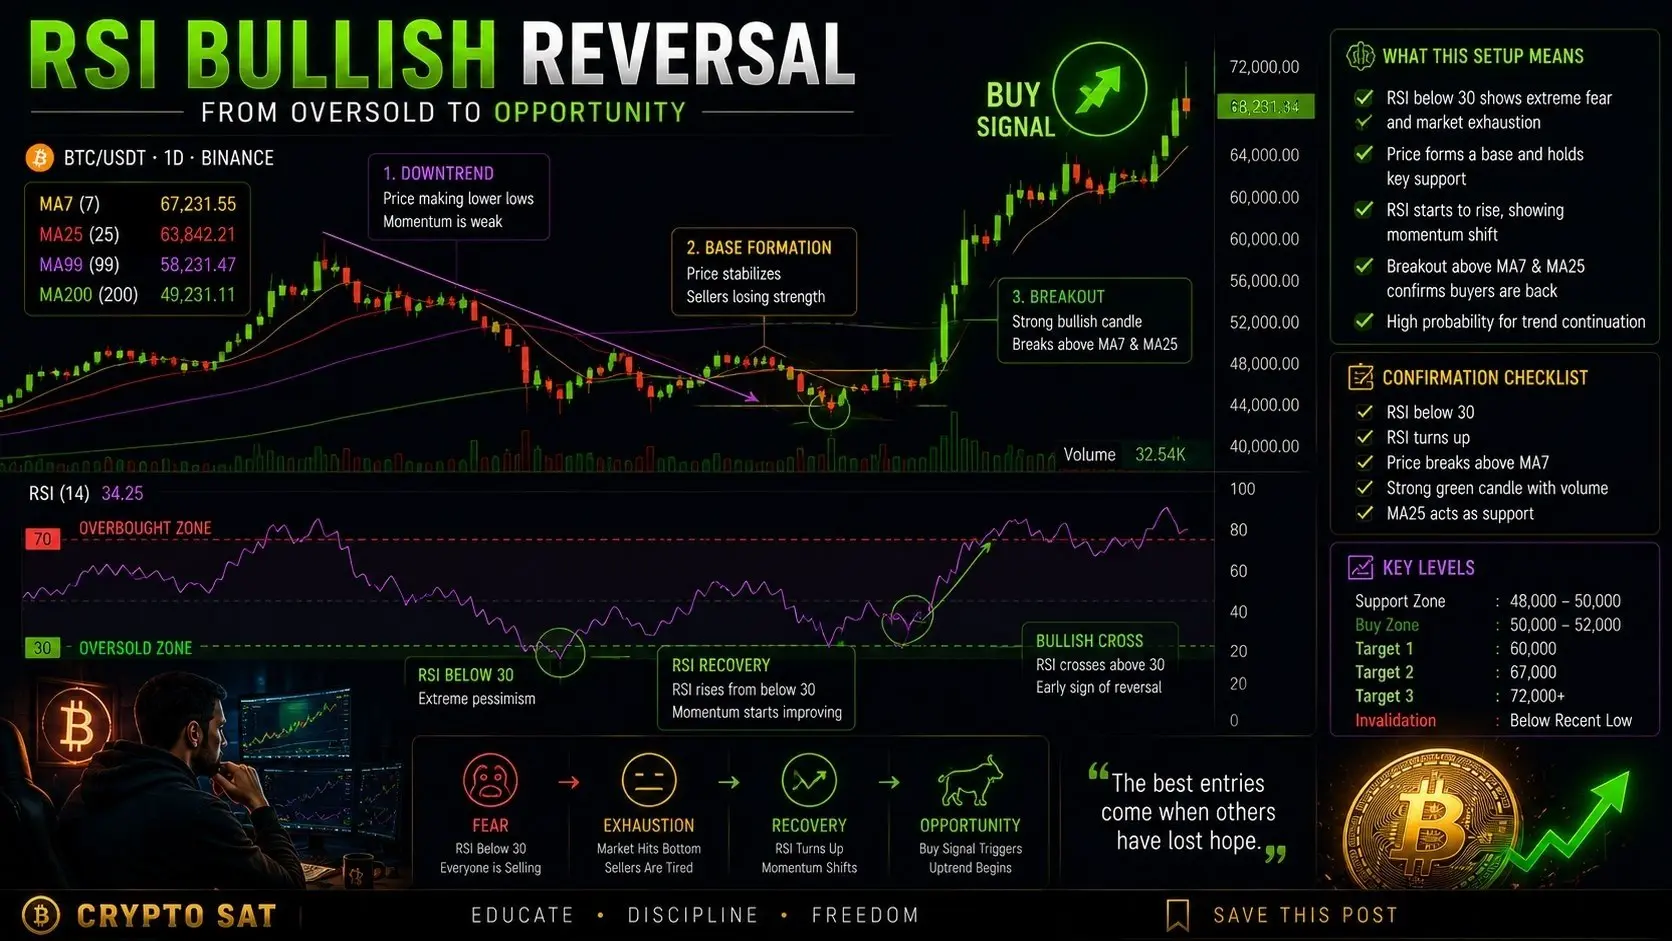


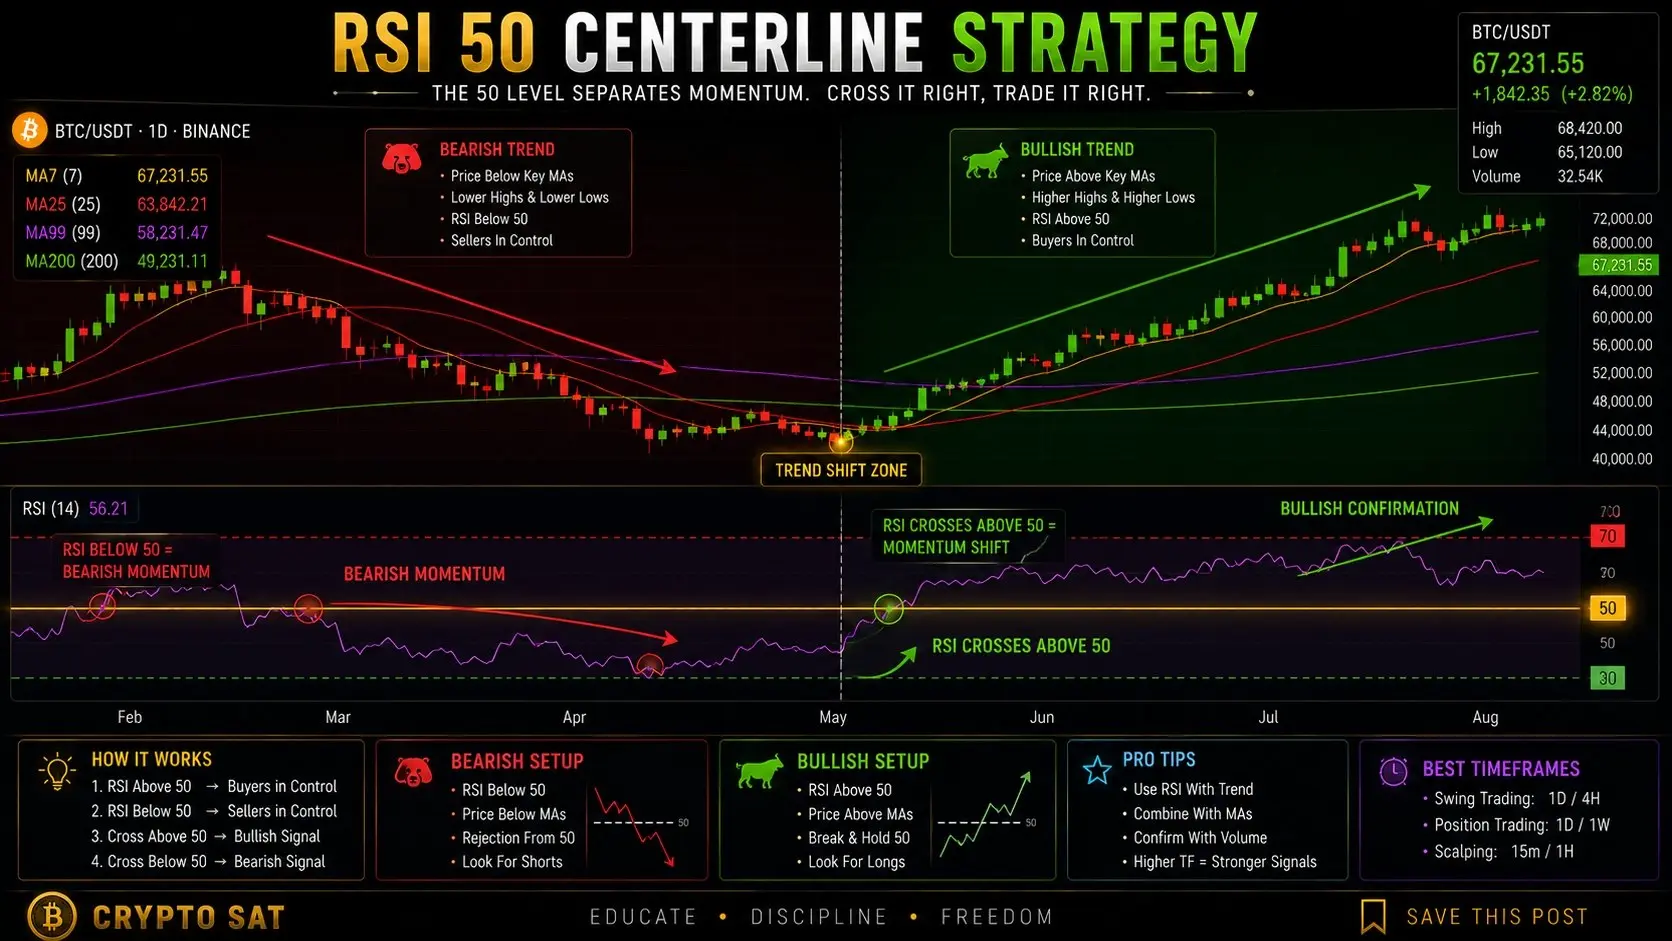
One of the most powerful uses of RSI isn't finding overbought or oversold conditions.
It's identifying potential reversals.
But here's the catch:
RSI alone doesn't reverse the market.
Price does.
RSI simply gives us clues that momentum may be changing.
🔴 Oversold Bounce
When RSI falls below 30, selling pressure has become extremely aggressive.
Fear usually takes over.
You'll see traders on social media calling for lower and lower prices.
Then suddenly…
$BTC stops falling.
A bullish candle appears.
Volume starts increasing.
Momentum begins to recover.
This is where oversold bounces often begin.
But remember:
RSI below 30 is not a buy signal.
It's an alert to start paying attention.
🟢 Overbought Rejection
The opposite happens when RSI moves above 70.
Buying momentum becomes extremely strong.
FOMO spreads.
Everyone becomes bullish.
Then momentum starts slowing down.
A rejection candle appears.
Volume weakens.
Price struggles to make new highs.
This is often the first sign that buyers may be losing control.
Again…
RSI above 70 is not an automatic sell signal.
It's simply a warning that conditions may be changing.
🎯 Confirmation Methods
Professional traders never trade RSI in isolation.
They look for confirmation:
▪️ Support and resistance levels
▪️ Bullish or bearish candlestick patterns
▪️ Market structure shifts
▪️ Moving Average reactions
▪️ Divergence signals
The more confirmations present, the higher the quality of the setup.
📈 Why Volume Matters
Volume often reveals whether a reversal has real conviction.
For example:
▫️ RSI below 30 + strong buying volume
= Higher probability of a meaningful bounce.
▫️ RSI above 70 + increasing selling volume
= Greater chance of a deeper correction.
Without volume, many reversals simply become temporary pauses.
📌 RSI reversal signals are not predictions.
They are early warnings that momentum may be shifting.
The best traders don't blindly buy oversold conditions or short overbought markets.
They wait for the market to confirm the story first.
Because in trading…
Patience often pays better than prediction.
It's identifying potential reversals.
But here's the catch:
RSI alone doesn't reverse the market.
Price does.
RSI simply gives us clues that momentum may be changing.
🔴 Oversold Bounce
When RSI falls below 30, selling pressure has become extremely aggressive.
Fear usually takes over.
You'll see traders on social media calling for lower and lower prices.
Then suddenly…
$BTC stops falling.
A bullish candle appears.
Volume starts increasing.
Momentum begins to recover.
This is where oversold bounces often begin.
But remember:
RSI below 30 is not a buy signal.
It's an alert to start paying attention.
🟢 Overbought Rejection
The opposite happens when RSI moves above 70.
Buying momentum becomes extremely strong.
FOMO spreads.
Everyone becomes bullish.
Then momentum starts slowing down.
A rejection candle appears.
Volume weakens.
Price struggles to make new highs.
This is often the first sign that buyers may be losing control.
Again…
RSI above 70 is not an automatic sell signal.
It's simply a warning that conditions may be changing.
🎯 Confirmation Methods
Professional traders never trade RSI in isolation.
They look for confirmation:
▪️ Support and resistance levels
▪️ Bullish or bearish candlestick patterns
▪️ Market structure shifts
▪️ Moving Average reactions
▪️ Divergence signals
The more confirmations present, the higher the quality of the setup.
📈 Why Volume Matters
Volume often reveals whether a reversal has real conviction.
For example:
▫️ RSI below 30 + strong buying volume
= Higher probability of a meaningful bounce.
▫️ RSI above 70 + increasing selling volume
= Greater chance of a deeper correction.
Without volume, many reversals simply become temporary pauses.
📌 RSI reversal signals are not predictions.
They are early warnings that momentum may be shifting.
The best traders don't blindly buy oversold conditions or short overbought markets.
They wait for the market to confirm the story first.
Because in trading…
Patience often pays better than prediction.