Share crypto content and earn up to 60% commissions through content mining.
placeholder
gatefun
After trading for a long time, you’ll notice that in a downtrend, the most obvious signals are often not the big bearish candle itself, but the fact that each rebound is weaker than the last. This is the detail I focused on most this time.
$XRP This trade was recorded starting from 1.1661. The price later moved to 1.1137, and the short position closing/execution rhythm went smoothly. The +418.51% change also matched my expectations.
There weren’t no fluctuations in the middle, but price kept facing pressure from above throughout, and the capital follow-through wasn’t active enough. My trading
XRP0.38%
BTC-0.23%
ETH2.00%
View Original
post-image
  • Reward
  • Comment
  • Repost
  • Share
Honestly, this market is really going to mess with people! 📉😎 A few days ago in the afternoon $NIL it was still pretending to be strong up there—moving sideways and refusing to come down. A lot of people see it not dropping and want to chase, but what I’m seeing is a push higher without volume, with clear suppression overhead.

When it was grinding at the high level during the session, I watched NIL’s every rebound. I found that each time it just surged and then got weak—the buy pressure couldn’t keep up, and there wasn’t enough support. I don’t like hard-charging from that kind of positio
NIL2.10%
BTC-0.23%
ETH2.00%
View Original
post-image
  • Reward
  • Comment
  • Repost
  • Share
I feel so awful, wuwuwuwu…
Big brothers, could you give me a follow to help me feel better? #韩国KOSPI暴跌5%触发熔断
View Original
post-image
post-image
  • Reward
  • Comment
  • Repost
  • Share
TODAY MARKET UPDATES
gate liveLIVE
688
  • Reward
  • Comment
  • Repost
  • Share
This sell-off just gave the answer—$PIPPIN being under pressure at the high end wasn’t a false move. The earlier rebound looked brutal, but each time it surged up, there was no follow-through. A lot of people got carried away by surface-level fluctuations—the real weakness was actually hidden in how fast the price pulled back.
I was watching whether $PIPPIN could hold the key level. As it broke down, the rebound lacked strength, showing that the shorts started taking control of the rhythm. Enter short positions near 0.0210—the logic is simple: as long as the upper key level isn’t reclaimed, tr
PIPPIN0.61%
BTC-0.23%
ETH2.00%
View Original
post-image
  • Reward
  • Comment
  • Repost
  • Share
$BILL A 22% plunge within 24 hours—those who chased yesterday are hurting badly now. Entering at 0.0399 and it instantly got halved. Can you hold through this dip?
Bullish reasons: 1) Trading volume is still 68 million, and liquidity hasn’t died; 2) Buy orders around 0.03 hold it up, and it hasn’t broken the previous low; 3) After a shakeout, there may be a rebound, and there are no signals the maker has run.
Bearish reasons: 1) Daily chart has a bearish arrangement—if 0.03 breaks, it heads for 0.025; 2) In the past 24 hours there’s been no rebound, and selling pressure keeps releasing; 3) Mem
MEME-0.14%
View Original
post-image
post-image
post-image
  • Reward
  • Comment
  • Repost
  • Share
USDT Isn't Meant to Stay Idle Put It to Work While Staying Ready to Trade
As the crypto market moves through mid-July 2026, capital efficiency has become increasingly important. With Tether (USDT) maintaining a market capitalization near record highs and continuing to power global crypto trading, earning yield on USDT while keeping funds available for trading has become an attractive strategy for many market participants.
Gate's Holding-Earn Ecosystem
Gate's Holding-Earn (持币生息) feature now supports more than 20 digital assets, including:
USDT
BTC
ETH
SOL
FLR
ATOM
The system works across both s
BTC-0.21%
ETH1.98%
SOL-1.25%
FLR-0.58%
post-image
  • Reward
  • 1
  • Repost
  • Share
HighAmbition:
thank you for information
This candlestick move is way too “unruly”—it flips its face faster than turning a book page ~📉🔥
A few days ago, in my last glance before sleeping, $AVAX surged upward pretty aggressively, but I could still tell the overhead pressure was stubbornly hard. The volume didn’t keep up, and the follow-through was weak. I reminded myself right then not to get tricked into getting in by that sudden spike—the short idea is clearer 👀
From 9.375 down to now 6.696, the chart has already given the answer: +2026.86% in hand. That down move—eating this drop “meat” feels genuinely great 🎯💰
This is the rh
AVAX-0.24%
BTC-0.23%
ETH2.00%
View Original
post-image
  • Reward
  • Comment
  • Repost
  • Share
ONDO short signal appears—are you bold enough to follow it?
$ONDO /USDT - SHORT
Trading plan:
Entry: 0.3677 – 0.3713
SL: 0.3925
TP1: 0.3523
TP2: 0.3408
TP3: 0.3235
Why watch this structure?
- Current price 0.3695: the 4H trend is clearly bearish, confidence 77.4.
- RSI on 15M is 56.61, not oversold—still room for downside.
- 1H ATR is only 0.00737, low volatility—good for setting up in advance.
- Targets: TP1 0.3523, TP2 0.3408, stop loss 0.3925—risk is controllable.
Discussion:
Will this leg of the bears hit TP1 first, or will it be a bull trap pullback? Did you place your orders?
ONDO15.30%
View Original
post-image
  • Reward
  • Comment
  • Repost
  • Share
As soon as the market display flipped, short positions started getting feedback. This drop in $PIPPIN isn’t happening suddenly—earlier, at the high levels, it kept getting repeatedly capped from above by selling pressure I couldn’t break through, and I felt something was already off here.

My short entry reference was 0.0197. Now the price is at 0.0165. After I got out for +319.83%, the rhythm became very clear. Most people are still waiting for a strong rebound, but the stronger the rebound looks, the weaker and more hollow it becomes. Volume is rising, yet it can’t be absorbed—this indicate
PIPPIN0.61%
BTC-0.23%
ETH2.00%
View Original
post-image
  • Reward
  • Comment
  • Repost
  • Share
$XRP is trading at $1.1150, up 0.38%, after rebounding strongly from $1.0528. The 24-hour range stands between $1.1013 and $1.1298.
On the 4H chart, XRP is holding above the MA10 at $1.1116 and MA30 at $1.0954, while sitting directly on the MA5 at $1.1150.
🔥 A breakout above $1.1298 could accelerate the rally—while $1.1013 remains the key support.
XRP0.36%
post-image
  • Reward
  • Comment
  • Repost
  • Share
Woke up and instantly felt sharp! 📢📉 A few days ago, in the afternoon, it was still pretending to be strong at high levels—but today the market chart directly gave the answer. The short side’s kick into the downside was clean enough.
Back then, while everyone was still watching, I saw that $CHZ every time it surged, it was just a step short—there wasn’t enough follow-through, and the volume didn’t keep up. I don’t like chasing longs from a position like that. I followed the plan and issued a long prompt; the entry reference was 0.03576. That’s the rhythm. 🎯👀
Now it’s moved from 0.03576 do
CHZ1.26%
BTC-0.23%
ETH2.00%
View Original
post-image
  • Reward
  • Comment
  • Repost
  • Share
#ETHStandsAbove1900
Ethereum is trading at $1930 on July 16, 2026, maintaining strong positioning above the crucial $1900 support level. This position represents a constructive signal for ETH, as $1900 was a psychological barrier that has provided support multiple times in the past. The market has now established bullish sentiment, and traders are attempting to build momentum above this level.
Current Market Position and Technical Analysis
ETH's current price of $1930 is approximately 1.58% above the $1900 level. The 20-day EMA sits at $1718, serving as short-term support, while the 100-day E
post-image
post-image
post-image
  • Reward
  • 7
  • Repost
  • Share
CryptoZyra:
2026 GOGOGO 👊
View More
What caught my attention here is that the rebound hasn’t continued. The price seems to be trying to correct, but the strength is clearly insufficient—rather, it looks like it’s giving the shorts time to recharge.
My take is: once attempts to break through at the high keep failing multiple times, you should be on guard that the momentum is weakening. $BIO I started tracking this position at 0.03045; when it moved to 0.02816, the order-book feedback was already pretty clear, with a return rate of +540.61%.
For this kind of profitable drop, the biggest risk is getting carried away emotionally an
BIO-0.54%
BTC-0.23%
ETH2.00%
View Original
post-image
  • Reward
  • Comment
  • Repost
  • Share
Woke up and immediately felt energized! 📉😎 In the morning I opened the chart, and this move in $PEPE finally gave the answer. A few days ago, at the early-morning hours, it was still grinding at the highs, teasing again and again—yet each time it tried to push up, it just lacked that last bit of momentum.
What I saw at the time was simple: an endless surge, insufficient follow-through, and persistent overhead pressure. Before the chart had fully started, it already signaled to open a long, with the entry around 0.000003530 📌👀
Now it’s at 0.000002777, and the return is up to +1517.6%. This
PEPE-1.18%
BTC-0.23%
ETH2.00%
View Original
post-image
  • Reward
  • Comment
  • Repost
  • Share
Don’t say—this round really gives face. 🔥📉 A few days ago, my last look before sleep was still grinding the upper range. Many people looked like they were about to break through, but I saw it more like a rebound with no strength—there was basically nobody stepping in up there.
Before the order book fully got going, $IN several pushes were pushed back down. The volume didn’t back it up, and the follow-through was weak as well. I told you at the time: open longs, reference entry 0.09365. If you understand, execute—don’t hesitate at the last step. 🎯👀
Now it’s at 0.04579. Short position profi
IN-0.67%
BTC-0.23%
ETH2.00%
View Original
post-image
  • Reward
  • Comment
  • Repost
  • Share
Bitcoin Market overview
gate liveLIVE
1,282
live-coin
  • Reward
  • Comment
  • Repost
  • Share
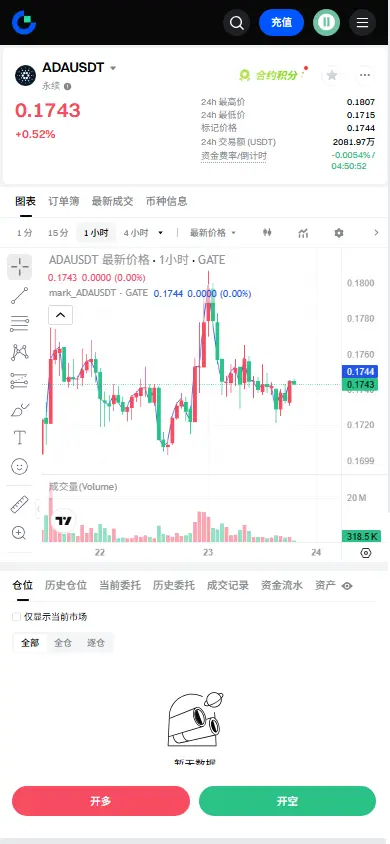
This dump immediately exposed the truth on the chart! 📉🔥 When I opened the chart in the morning, $ADA had already been pressing down from the highs. The stubborn “hard-pushing” feeling from a few days ago—right up until when I went to bed—finally produced results. At first it looked like it could rebound, but in reality, every time it tried to push up there was no real follow-through, and the volume couldn’t keep up.
Before the chart was fully underway, I watched the rebound strength of ADA and found that the moment price bumped into the overhead area, it turned soft—once it went up, nobody
ADA-0.30%
BTC-0.23%
ETH2.00%
View Original
post-image
  • Reward
  • Comment
  • Repost
  • Share
This short position finally moved out. The chart gave it very decisively—no annoying, choppy micro pullbacks. Instead, after pressure at the top, it released space directly.
When $AIXBT surged earlier, a lot of people were still chasing the hype. At the time, I wasn’t focused on whether it could keep pumping—I was watching whether, once buy volume at the top couldn’t be sustained, it would actually crash down. What really caught my attention was that the price repeatedly got stuck around 0.03358, couldn’t push through, the bounces kept getting weaker, and the structure clearly changed.
After e
AIXBT0.74%
BTC-0.23%
ETH2.00%
View Original
post-image
  • Reward
  • Comment
  • Repost
  • Share
US Concludes Latest Strikes on Iran Markets Shift Toward De-Escalation
The United States has officially ended its latest military strikes targeting Iranian-linked assets, creating a temporary easing in geopolitical tensions. For financial markets, this development offers an important signal as investors reassess global risk conditions and the outlook for major asset classes.
Overview of the Situation
The US military conducted precision strikes against Iranian-affiliated targets following earlier attacks involving US personnel and regional infrastructure. According to the Pentagon, the planned
BTC-0.21%
post-image
  • Reward
  • 7
  • Repost
  • Share
CryptoSpecto:
To The Moon 🌕
View More
Load More

Join 40 M users in our growing community

⚡️ Join 40 M users in the crypto craze discussion
💬 Engage with your favorite top creators
👍 See what interests you
  • Pinned