Square
Following
Hot
News
Profile
Share your thoughts
placeholder
Article
$WULF had an intraday recovery of +20% which is pretty significant. It was down -65% from its high of $29 at some point today which still isn't as bad as the pullback in April 2025 where it saw -75% drawdown, but I'd say the sentiment in the space was just as bad
It almost seems irresponsible to show this chart. But it's currently forming a handle in this cup & handle pattern.
I don't make the fibs either, price currently found support around the 0.707 fib and if we get back above 0.786 and 0.887 fib then the upside targets could get wild. I don't see them happening anytime soon. For no I'd e
post-image
WULF+9.27%
Everyone watching SYMBOL long is about to get blindsided by a sharp drop.

$MU /USDT - SHORT

Trade Plan:
Entry: 927.98 – 934.84
SL: 964.38
TP1: 906.68
TP2: 890.19
TP3: 865.47

Why this setup?


Debate:
Are we testing TP2 or is 994.50 about to flip this setup?

⚠️ Personal market analysis only. NFA — manage risk and DYOR.
Educational content, not investment advice or a recommendation to buy, sell, deposit, or withdraw any asset. No paid promotion or referral/affiliate links.
MU+2.12%
Everyone, $ICNT ’s price movement was exactly as I predicted, breaking through my 0.1270 take-profit target…‼️…I hope everyone can secure their profits and earn handsome returns…‼️
post-image
ICNT+23.50%
Many people see the funding rate turn positive and MACD turn green and automatically assume “the bulls are back,” then chase in with oversized positions—this is the most common position-sizing mistake: treating indicator direction as an entry signal while ignoring the moving-average structure and volatility levels. $BERA is a textbook example of this trap.
First, the structure: current price 0.2284, MA5=0.2311 remains below MA20=0.231595, and the short-term moving average has not crossed above, meaning the bearish alignment has yet to be repaired; RSI=47.3 is stuck in the neutral-to-weak zone
post-image
BERA-6.12%
BTC UPDATE
live-cover
LIVE88
$ENA Right now it feels like a multiple-choice question with no standard answer, but the answer will not be hidden in emotions.
First, let’s copy the full question: $ENA is currently at 0.2051, up 4.32% over 24 hours. The 1-hour support is 0.1825, resistance is 0.2069, and current volume is 0.43 times the average volume of the past 20 candles. The 1-hour trend is strong, with RSI at 80; the 4-hour trend is strong, with RSI at 46.
The angle I’m watching is that $ENA remains strong, while the crowded positioning is already on the table. I acknowledge that the trend is strong, but what matters ne
post-image
ENA+4.73%
$FIL the big move by gateio has begun, where everyone who believed in and invested in these ETF tokens literally gets screwed 🤡🤯
post-image
FIL+8.61%
Wow 😮 everyone is getting instantly rich 🤑 from this coin solana:DFMt2FyLpB6ekPNAzVErLXgpSnJ9CRf1VnxBAkTLpump
Probably backed by @elonmusk
Gaurantee to make you rich 🤑 100%
Nobody loses it goes up forever ♾️
DFMt2FyLpB6ekPNAzVErLXgpSnJ9CRf1VnxBAkTLpump
post-image
SOL+1.16%
$NEAR NEAR Breaks Out of a 4-Year Descending Channel: TP1: $11
NEARUSDT
Weekly Time Frame:
NEAR (1W, log scale) is breaking out of the descending channel that has defined price action since the 2022 top, and the weekly candle is now pushing above the upper boundary.
What the chart shows:
After the 2022 high (~20.6), price spent years in a descending channel, bottoming around the 0.9 area in early 2026.
Since that low, price has risen sharply and is now trading at ~5.4, above the channel’s upper trendline.
The breakout is happening at the 2024 volume profile POC (~5.2), so the trendline and a h
post-image
NEAR+10.47%
( new streamer) market overview
live-cover
LIVE12
$ZEC The altcoin king is a money printer—stay steady, hold spot through the bull market. It feels incredible
ZEC+9.10%
We are getting closer to $4M in fees per day on Hyperliquid again.
Add the $500k from the yield reserve and we are already there
post-image
HYPE+1.43%
The answer is always hidden in the process that time brings. I’ve already made it extremely clear—the hints have been laid out plainly. Since June, it has felt exactly like hitting whatever I aim at and winning every battle; there’s only one word for it: “awesome”!
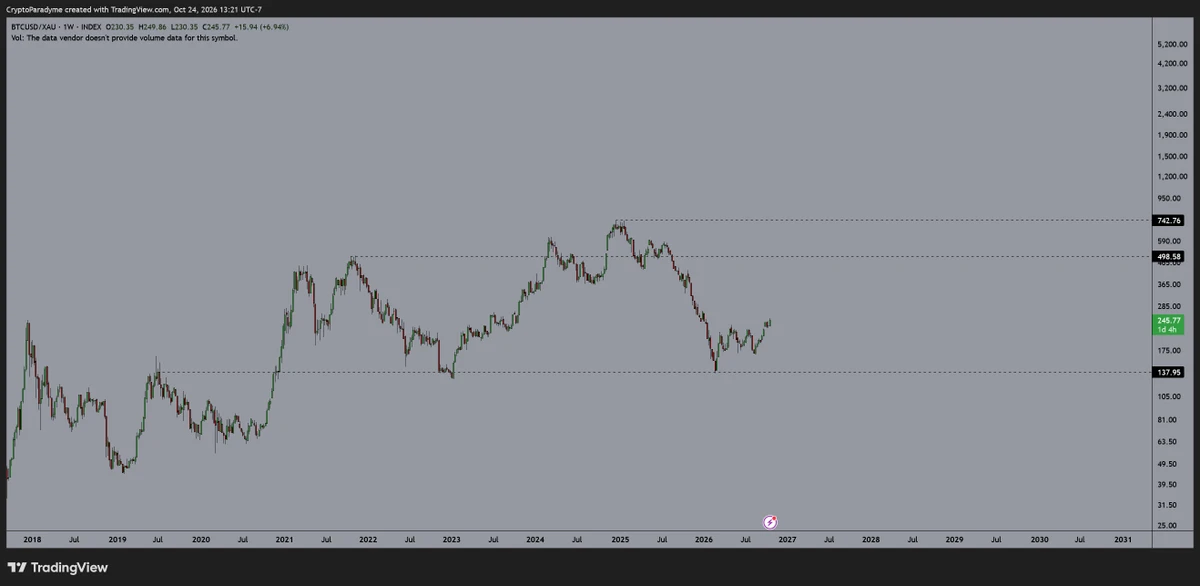
$BTC #美国9月CPI超预期
BTC+0.47%
$ICNT Investment trade: Looking back at the content published earlier, Target 2 has now been reached. We still have room to 0.15–0.20.😎$KORU
post-image
ICNT+23.50%
KORU-6.59%
I make about $29k a month with options.
NO Day trading
NO Swing trading
NO Covered calls
NO Cash secured puts
NO BS
INSTEAD, I DO THIS:
Build base portfolio
Sell portfolio secured puts (not cash secured)
Buy LEAPS with the premium from sold puts
BUY shares with the premium from sold puts
Keep ratios in check
I can explain it to a 13 year old & I will likely outperform 95% of people that read this.
Simple wins.
post-image
$BERA Current price 0.2275, 24h -5.88%, trading volume only 5.6M USDT, MA5 at 0.23092 has crossed below MA20 at 0.23155, RSI at 46.6 is weak, the MACD histogram at -2.941e-05 remains bearish, and the Bollinger Bands are [0.214696, 0.248404], with the 30-candle amplitude at approximately 17.58%. The funding rate is -0.0001%, with bears slightly dominant but not at an extreme, and the Fear & Greed Index is neutral at 53—this is a typical low-volume, gradual decline structure rather than panic selling, meaning downside may open slowly instead of being released all at once.
Directional view: Beari
post-image
EPIC-7.69%
Which step is $CRCLB’s latest rally most likely to fool you on?
$CRCLB There is a very typical debate right now: one side uses +8.96% over 24 hours to prove the direction, while the other counters with key levels. I’m not taking sides based on the rise or fall for now, because $CRCLB remains strong, while the crowded positioning is already out in the open and has yet to provide a complete answer. I acknowledge that the trend is strong, but what matters next is not how much higher it can surge, but whether anyone steps in during the first pullback.
Laying out the chart, the current price is 86.
post-image
This is not a game... ✅️
Everything is fine!
🔥🐶🔥
Load More

Join 40 M users in our growing community

⚡️ Join 40 M users in the crypto craze discussion

💬 Engage with your favorite top creators

👍 See what interests you

Trending Topics

USSeptemberPPIBeatsExpectations

91.35k Views1.88k Discussing

US September PPI came in at 6.3% YoY, well above the 5.3% market expectation, pointing to renewed producer-side inflation pressure. Weekly jobless claims were 199K, broadly in line with forecasts. Could hotter inflation further reduce room for rate cuts, and what does it mean for $BTC, US stocks, and gold?

DrLinHanSpeaksAtOxfordUnion

135.63k Views1.86k Discussing

JapanAndKoreaStocksPlunge

47.27k Views1.76k Discussing

View More