Square
Following
Hot
News
Profile
Share your thoughts
placeholder
Article
$OGN ’s two charts are giving opposite answers: the short term has already turned, but the larger cycle refuses to acknowledge it.
This time, I’m not looking at the gainers and losers ranking, only at the levels. The current price is 0.03504, about 5.14% from the 1-hour support at 0.03324 and about 25.00% from the resistance at 0.0438.
My criteria are simple: only a breakout above 0.0438 followed by continuation would count as an upward handoff; a break below 0.03324 invalidates the original judgment. The 1-hour timeframe is weak while the 4-hour timeframe is strong, with RSI at 54 and 52, res
post-image
OGN-9.22%
South Korea Blocks 27 Crypto Exchange Websites — What Happens to Liquidity?
South Korea is restricting access to 27 websites linked to unregistered crypto exchanges.
The bigger question is where trading activity goes next. Liquidity may shift to compliant platforms, but the impact on the broader market remains uncertain.
My take: This is a regulatory development, not an automatic bearish signal for $BTC . The real test is whether enforcement changes trading flows or simply redirects them.
Will tighter regulation strengthen crypto adoption or push traders elsewhere?
#Bitcoin #Crypto #MarketAnal
post-image
BTC+0.54%
#WillYouBuyDipInKoreanStocks $SAMSUNG ‌ $SKHY
#韩股大跌你会抄底吗
#每周来晒
South Korean stocks are facing strong selling pressure, with SK Hynix falling more than 9 percent and Samsung Electronics dropping around 7 percent. Since both companies are closely connected to the global semiconductor industry, weakness in these stocks can also affect overall market sentiment.
My view is that this could be a correction, but I would not call it a confirmed buying opportunity just because prices have fallen sharply. The key question is whether buyers are ready to defend important support levels or sellers st
post-image
SAMSUNG-7.58%
SKHY-3.34%
$W Every rise is meant to lead to an even harder fall, please continue
post-image
W-22.74%
$S Shifts Short-Term—So Why Has the 4-Hour Chart Still Not Capitulated?
$S 24-hour change: -3.13%, current price: 0.05604. On the surface, this is merely a rise and fall, but the real conflict is hidden in the timeframes: the 1-hour chart is weak, while the 4-hour chart is strong. When two charts give opposite answers, the least useful thing to do is choose the one you like and believe it unconditionally.
On the event front, the platform’s latest announcement mentioned “Gate Research: U.S. Stocks Extend Gains, Moscow Exchange to Launch Regulated Crypto Trading.” This is verifiable background i
post-image
There is no belief in the market.
Last week, we had a relatively small drop to $80k, and the fear on the timeline increased greatly.
We then closed the weekly back above the May high, including securing 4x weekly closes above the 50SMA.
In addition, the 2W candle also closed above.
All within a bullish Weekly Supertrend.
The data is telling us, very clearly, that Bitcoin has reversed and is bullish.
Yet, the market is very much consumed by Fear and PTSD.
What this tells me, at least, is not very many people are positioned in a strong position.
We either have people sidelined, or people that ha
post-image
BTC+0.54%
People who chase coins that double in a single day often mistake “strength” for “safety.” $GNS Current price: 0.754, 24h gain: 106.58%, with the amplitude over 30 candles at approximately 67.95%—this is not the start of a trend, but a one-time release after volatility was compressed to an extreme. At this moment, the Bollinger upper band at 0.7415 has already been left beneath the price, RSI 78.4 is deep in overbought territory, and the divergence between MA5 at 0.6668 and MA20 at 0.4478 is excessive, leaving the moving-average system severely disconnected. The Greed Index is 57; combined wit
post-image
INJ+7.49%
Floki all time high hype ath go
post-image
FLOKI-2.79%
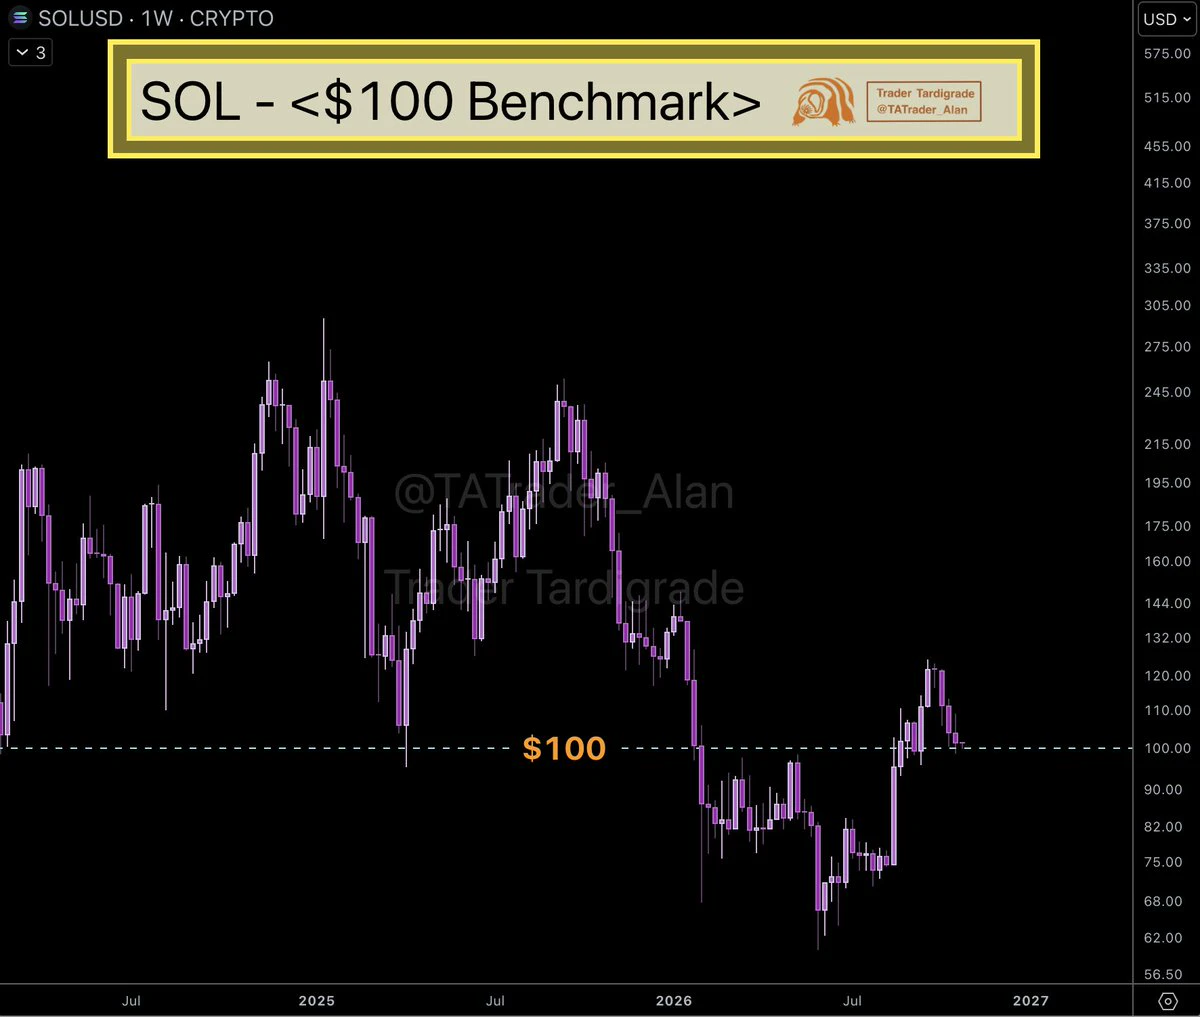
SOLANA $SOL REJECTING MOVING AVERAGE RESISTANCE ARE BEARS TARGETING $100.51 NEXT?
Pair: $SOL /USDT
Direction: SHORT
Entry Price: 106.49
Target Levels (Take Profit)
TP 1: 104.25 2.10%
TP 2: 102.75 3.51%
TP 3: 100.51 5.61%
Stop Loss
SL: 109.48
Technical Breakdown
SOL ($106.45) attempted a minor recovery following an aggressive sell-off, but printed consecutive corrective red candles that struggle to break back above local overhead resistance. This price action confirms persistent seller defense and sets up a clean continuation toward lower targets.
Price action is capped directly below
SOL-0.55%
Analysis crypto coin
live-cover
LIVE1,942
[New Streamer] Whales Moves in Sync!
live-cover
LIVE35
The low around $NEAR is beginning to draw attention, but the feeling that it is cheap can never replace evidence of a bottom. I would rather lay out the bearish case first.
Bears see the risk after a break below 4.89, while bulls need to prove that buyers remain after a break above 5.541. Current volume is 0.44x.
The current price is 4.997, about 2.14% above the 1-hour support at 4.89 and about 10.89% below the resistance at 5.541. The position determines which side is more pressed, and the next level to watch shifts to 4.654.
Waiting for the boundaries to provide an answer is more reliable t
post-image
#ASMLTSMCQ3EarningsSoon
ASML and TSMC Earnings: The Next AI Boom Depends on Supply Chain Execution, Not Just Demand
The AI semiconductor story is entering a new phase. Demand for AI chips remains a major industry driver, but investors are increasingly focused on a more difficult question: Can the semiconductor supply chain deliver enough advanced equipment, manufacturing capacity, and packaging solutions to support the next wave of AI growth?
ASML and TSMC will be central to this discussion as investors examine their October 14–15 earnings updates. Their results could reveal whether the indus
CryptoChampion
#ASMLTSMCQ3EarningsSoon
ASML and TSMC Earnings: The Next AI Boom Depends on Supply Chain Execution, Not Just Demand
The AI semiconductor story is entering a new phase. Demand for AI chips remains a major industry driver, but investors are increasingly focused on a more difficult question: Can the semiconductor supply chain deliver enough advanced equipment, manufacturing capacity, and packaging solutions to support the next wave of AI growth?
ASML and TSMC will be central to this discussion as investors examine their October 14–15 earnings updates. Their results could reveal whether the industry is scaling efficiently or approaching new capacity constraints.
1. ASML: Equipment Orders Will Reveal the Strength of Future Investment
ASML plays a critical role in advanced semiconductor manufacturing by supplying lithography equipment, including extreme ultraviolet (EUV) systems used to produce leading-edge chips.
The company’s challenge is to expand manufacturing capacity while meeting increasingly demanding customer requirements.
In its previous outlook, ASML planned to increase its 2026 low-NA EUV production capacity of approximately 65 systems by 30% in 2027, while exploring another potential 30% increase for 2028. Its DUV immersion capacity was also expected to rise approximately 30% in 2027 from around 130 systems in 2026.
These figures represent capacity plans, not guaranteed deliveries.
I will focus on order intake, equipment shipments, customer commitments, and service revenue. Strong orders would support the view that chipmakers are preparing for sustained AI-related investment. However, weaker bookings could raise questions about the timing of future spending.
2. TSMC: Advanced Packaging Could Become the Critical Bottleneck
TSMC occupies another essential position in the AI supply chain. It manufactures advanced chips and provides packaging technologies that integrate complex processors with high-bandwidth memory.
One technology attracting particular attention is Chip-on-Wafer-on-Substrate (CoWoS), which helps combine multiple components into high-performance semiconductor packages.
As AI accelerators become more sophisticated, packaging capacity becomes increasingly important. Even when chip designs and wafer production are available, insufficient packaging capacity can delay finished products.
During TSMC’s October 15 earnings update, I will watch for details about CoWoS expansion, advanced-node demand, customer production commitments, and the pace at which new capacity becomes operational.
The key question is whether packaging capacity can grow alongside wafer production without creating additional delays or excessive costs.
3. Capital Expenditure: Opportunity or Financial Risk?
TSMC raised its 2026 capital-expenditure forecast in July to $60 billion–$64 billion, compared with its previous range of $52 billion–$56 billion. Its investment plans also include expanding U.S. manufacturing operations through its Arizona facilities.
This spending reflects the scale of the semiconductor industry's ambitions, but large investments do not automatically guarantee attractive returns.
Factories, equipment, and packaging facilities require substantial upfront capital. Their profitability depends on utilization rates, customer demand, production efficiency, and pricing power.
I believe investors should examine whether planned spending is supported by visible demand rather than assuming AI growth will remain exceptionally strong indefinitely.
4. Three Signals That Could Move Semiconductor Stocks
The bullish scenario would include strong ASML bookings, continued progress in TSMC's packaging expansion, and confident guidance supported by sustainable customer demand.
The cautious scenario would emerge if equipment orders weaken, capacity expansion moves ahead of actual demand, or management highlights rising costs and pressure on margins.
A third possibility is that both companies report solid results but their shares experience volatility because investors have already priced in ambitious AI growth expectations.
My View: Follow the Entire Supply Chain
For October 14–15, I will compare ASML's order momentum and production plans with TSMC's advanced-node outlook, packaging capacity, and capital-spending commitments.
These indicators can provide a clearer picture of the industry's health than revenue growth alone.
The next phase of the AI boom will depend not only on how many chips the world wants, but also on how efficiently the industry can manufacture, package, and deliver them.
Strong AI demand creates the opportunity. Execution, capacity discipline, and investment returns will determine whether that opportunity becomes sustainable profit.
#ShareWeekly #内容挖矿 #weeklyshare #PlanYourTradesThisWeek @Gate_Square $ASML $TSM
repost-content-media
TSM-0.42%
It's over for Bitcoin.
The 4 year long period of true dominance has come to an end.
This is a very important chart to understand the overall market setup, right now.
The top chart is Bitcoin Dominance without stables - the purest form of Bitcoin to Altcoin dominance.
We can see that it has broken below its 4 year trend, for the first time.
With us now being 105 days from the Bitcoin bottom.
If we jump backwards on the chart we can see that this exact setup happened in 2020.
BTCD. breaks trend, 105 days from the Bitcoin bottom.
The setup from 2020 is extremely similar... and yet, so many people
post-image
BTC+0.54%
✨ Strategy's capital allocation signals a structural shift in its funding approach.
🔹 Michael Saylor's Strategy acquired 250 BTC for approximately $21.5 million between October 5 and 11, at an average price of $86,194 per coin. Total holdings now stand at 848,250 BTC, representing roughly 4.04% of Bitcoin's fixed maximum supply. The cumulative acquisition cost reached $64.0 billion, with an average purchase price of $75,444 per coin.
📊 The capital flows behind the headline:
🔹 Bitcoin purchase: $21.5 million, funded primarily through MSTR at-the-market sales (125,183 shares for $21.0 million
BTC+0.54%
MSTR-0.51%
  • 3
Many people rush to buy the dip when they see a large bearish candle, but never ask: Is the trend structure still intact? Take $KORUB
as an example: it fell 8.41% over 24h, with the current price at 14.48, but MA5=14.404 is still above MA20=14.0535, and the bullish moving-average alignment remains intact—this is the dividing line between a “decline without a breakdown” and a “trend reversal.” A reusable way to assess whether the trend is healthy is to check three things: first, the relative position of the moving averages; second, the direction of the momentum histogram; third, the price’s po
post-image
OSMO-21.21%
#WillYouBuyDipInKoreanStocks
WillYouBuyDipInKoreanStocks? 🇰🇷
South Korean Stocks Are Falling Sharply — Is This the Golden Buying Opportunity or a Warning Sign for Investors?
The South Korean stock market is facing a major test of investor confidence. On October 13, 2026, the benchmark KOSPI index closed at 6,035.35, down 5.46% in a single trading session, after briefly falling below the 6,000 level. The sell-off extended the market’s losing streak to five consecutive sessions, putting technology and semiconductor stocks under significant pressure.
This sharp correction has raised an importa
$TRUTH is surging‼️‼️
Can bulls push it to $0.020❓Entry price: $0.0180–$0.0183Take-profit 1: $0.0188 | Take-profit 2: $0.0193 | Take-profit 3: $0.0200Stop-loss: $0.0174
post-image
TRUTH+30.60%
✨ DeepSeek's Financing: A Structural Leap in AI Capital Formation
🔹 Multiple reports indicate DeepSeek's latest funding round has locked in at least 80 billion yuan, with the final size potentially approaching 100 billion yuan — double the initial target of roughly 50 billion yuan.
📊 The data behind the round:
🔹 Lead investors: Tencent and CATL are leading, with new and existing shareholders investing roughly equal amounts.
🔹 Pre-money valuation: Approximately 500 billion yuan.
🔹 First round: Completed in June 2026 with over 50 billion yuan raised at a 350 billion yuan valuation.
🔹 IPO p
post-image
TENCENT-0.14%
CATL-1.94%
  • 2
  • 1
$BTC is rising, but I think the exact opposite is true. The Ethereum spot ETF’s capital flows are the real variable: prices go wherever the money flows. Stare at the charts for too long, and you start seeing what you want to see. The lines on the chart represent the past; the money in the ledger represents the future. The Fibonacci retracement levels are right there. If a key support level breaks, those holding should first consider whether they can withstand it. Set your own stop-loss.
post-image
BTC+0.54%
ETH-0.52%
Load More

Join 40 M users in our growing community

⚡️ Join 40 M users in the crypto craze discussion

💬 Engage with your favorite top creators

👍 See what interests you

Trending Topics

DrLinHanSpeaksAtOxfordUnion

134.47k Views1.84k Discussing

Gate Founder & CEO Dr. LinHan has been invited to speak at the Oxford Union, a 200-year-old debating society that has hosted Einstein, Hawking, and Churchill. He will discuss crypto, the future of money, and what Gate Money means for global value movement. First trading platform on this stage. Nov 12 at Oxford. [👉 Learn more](https://oxford-union.org/event-6845310)

GateWCTCS9GlobalTradingCompetition

36.53k Views5.83k Discussing

GateTopsGlobalDerivativesMarketShareGrowth

161.08k Views2.69k Discussing

View More