Square
Following
Hot
News
Profile
Share your thoughts
placeholder
Article
The Overlooked “Third Culprit” Behind the Crash—The Technological Progress of Chinese Memory Manufacturers

Most analyses have focused on the higher-than-expected CPI and concerns over AI financing, but I believe one factor has been seriously overlooked—the technological progress of China’s ChangXin Memory Technologies.

When analyzing the reasons behind the plunge in Japanese and South Korean stocks on October 13, Ying Xiwen, head of the research department at Minyin International, cited three factors: the sharp overnight decline in the U.S. memory chip sector, warnings from the CEOs of Int
CXMT+1.74%
$BNB BNBUSDT: +3.4% bounce off $709 — $735 resistance decides next
BNB was the outlier in today's ~$1B liquidation cascade — while ETH fell 5%+ and BTC broke $81K, BNB finished the day green (+0.5%), bouncing 3.4% off its $709 cascade low to $733, a hair under its $735.3 24h high. The tension: genuine relative strength, or just a slower bleed in a market still digesting hot US inflation data?
Trend per timeframe
- Daily: Slid from the $745–747 zone (Oct 14) to a $709 cascade wick (Oct 15 02:00 UTC), then ground back to $733.2 — still ~1.6% below where the selloff began. The recovery reads corr
post-image
BNB+0.33%
On watch tomorrow $MSFT $GOOGL
post-image
MSFT+1.04%
GOOGL+0.37%
HYPERLIQUID $HYPE REJECTING MOVING AVERAGE RESISTANCE ARE BEARS TARGETING $78.06 NEXT?
Pair: $HYPE /USDT
Direction: SHORT
Entry Price: 81.62
Target Levels (Take Profit)
TP 1: 79.48 2.62%
TP 2: 78.06 4.36%
Stop Loss
SL: 84.47
Technical Breakdown
HYPE ($81.565) faced strong sell-side rejection following an impulsive upward push, printing a topping wick right at overhead structural resistance. This price action confirms persistent seller defense and sets up a clean continuation toward lower targets.
Price action tested areas above short-term moving averages before meeting heavy distribution
HYPE+1.72%
BREAKING: TSMC posts a record quarter as Nvidia, Apple, Broadcom and AMD compete fiercely for its wafer capacity.
TSM-1.82%
NVDA-1.92%
AAPL-0.31%
AVGO-0.64%
AMD-1.47%
An unpopular take: $INJ ’s current +10.99% gain is not as conclusive as it looks.
$INJ is currently at 8.423, up +10.99% over 24 hours. The 1-hour support is 7.061, resistance is 8.562, and current volume is 0.77 times the average volume of the past 20 periods. What is truly useful in these numbers is where 7.061 and 8.562 are containing the range.
This is where I currently stand: I acknowledge that the trend is strong, but what matters next is not how much higher it can surge, but whether buyers step in during the first pullback. The 1-hour trend is strong, with an RSI of 86; the 4-hour trend
post-image
INJ+11.20%
$DOGE About To Make Some Gains!?
Just locked into a long on $DOGE!
NFA, DYOR ⚠️
#Crypto #Trading #DOGE
post-image
DOGE-0.24%
Open a large long position on $WAL
! 🚀Entry range: 0.04995 - 0.05107Take-profit 1: 0.05335Take-profit 2: 0.05562Stop-loss: 0.04795The price is currently testing the 24-hour low of 0.05021, showing signs of stabilization on the 15-minute chart and potentially forming a double bottom. RSI(6) is 44.73, and with the funding rate negative, a short-term trade reverting upward toward the MA25 resistance at 0.05211 is currently the highest-probability strategy. Click here to trade 👇👇👇Other tokens: $SKHYNIX : Current price 981.58 - 24-hour change: -4.95%$AGT : Current price 0.032281 - 24-hour chan
post-image
AGT+114.87%
$NPC
There is no second best 🫡
20% bounce like nothing 🚀
@CryptoWizardd
post-image
NPC+8.03%
2026-10-15 20:14 UTC. Following clean target completions on BTC and SOL in the previous session, WAL/USDT rejected off its upper boundary and pulled back -4.87% from its 0.05385 peak. Price now sits around ~0.05123 USDT, resting in the lower third of its range just below its central equilibrium. Upper resistance is mapped at the SHORT ZONE (0.0535882 - 0.0537676 USDT), while lower demand holds the LONG ZONE (0.0498204 - 0.0499998 USDT) around the primary TARGET ZONE at ~0.052276 USDT. AKE/USDT also holds a clean structure (SHORT: 0.0367231 - 0.0370425 | LONG: 0.0300153 - 0.0303347 | TARGET: ~0
post-image
BTC+0.94%
SOL+1.25%
WAL-19.52%
AKE+18.84%
SNXX+0.52%
$BERA Current price 0.2275, 24h -5.88%, trading volume only 5.6M USDT, MA5 at 0.23092 has crossed below MA20 at 0.23155, RSI at 46.6 is weak, the MACD histogram at -2.941e-05 remains bearish, and the Bollinger Bands are [0.214696, 0.248404], with the 30-candle amplitude at approximately 17.58%. The funding rate is -0.0001%, with bears slightly dominant but not at an extreme, and the Fear & Greed Index is neutral at 53—this is a typical low-volume, gradual decline structure rather than panic selling, meaning downside may open slowly instead of being released all at once.
Directional view: Beari
post-image
EPIC-13.85%
SK Hynix Plunges 11%, but Gate’s Open Interest Accounts for 15.8% of the Total Market, Ranking Second—What Are Traders Thinking?

SK Hynix closed down 11.06% yesterday, hitting a new low since April this year and retreating 57% from its June high. Interestingly, the more volatile the market, the higher the trading attention related assets are receiving.

According to Odaily, CoinGlass data shows that open interest in SK Hynix contracts on Gate reached 147,300, accounting for 15.8% of the market and ranking second across the entire market. What does this mean? It means that amid the sharp dec
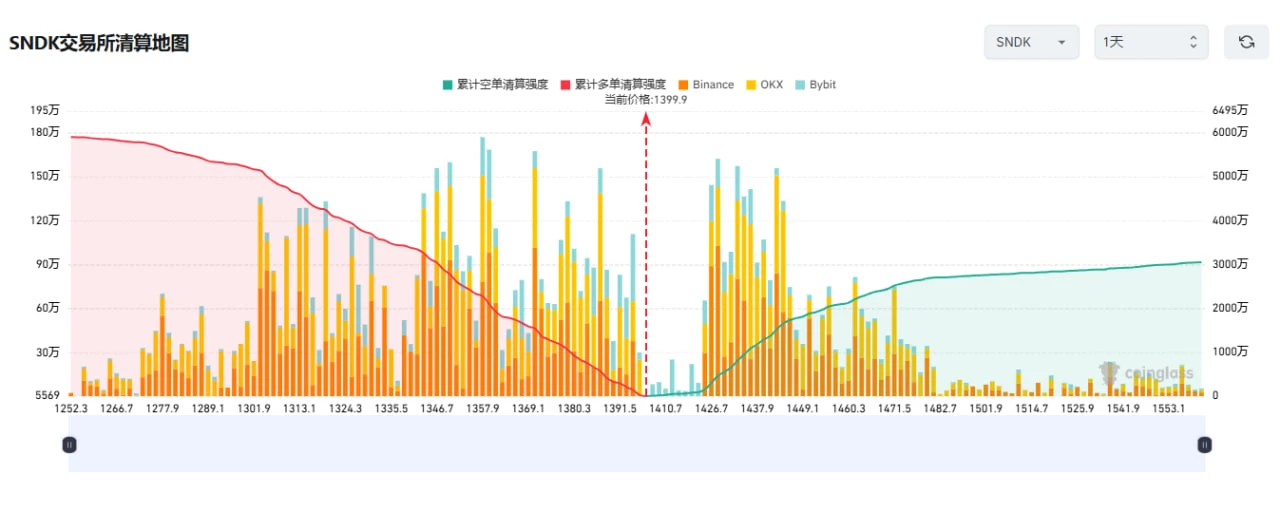
SNDK-0.56%
$TOLLY let’s go 5X
post-image
TOLLY-5.06%
Trade is actually an old script. In the 1980s, Japan’s economy was at its peak, with GDP reaching nearly 70% of the United States’, while its semiconductor industry was putting immense pressure on the US. Japan also wanted to improve relations with China and bring China in to counterbalance the US. What happened? The US launched a combination of measures: the 1985 Plaza Accord forced the yen to appreciate; the 1986 US-Japan Semiconductor Agreement forced Japan to open its market and restricted its exports; and the constraints of the US-Japan security alliance kept Japan firmly in line. From th
post-image
AAPL-0.31%
Careful, @crocat_x is an impersonator and most likely a rug!
Report.
The official crocat:native X is @CroCat_Token with CA 0x7Eb480c734eC5f6bd2B918F7393b59D59913DFFA
This is a good reminder as Cronos is getting more succesful, rugs and rats are also coming back.
Invest with eyes open, very easy to run in to these!
post-image
CRO+0.24%
Layout: Bitcoin, Ethereum, Dogecoin
live-cover
LIVE880
  • 4
What Does SanDisk’s $14 Billion Buyback Plan Signal After Its Plunge?

Today, let’s focus on SanDisk. The trigger for the plunge in Japanese and South Korean stocks was in Asia, but SanDisk, a leader in the NAND sector, was also hit hard. SanDisk fell more than 5% in premarket trading, quoted at 203.9 billion.‌

But amid this wave of panic, one signal has been overlooked by many: SanDisk’s board approved a $14 billion stock buyback plan, bringing its total remaining buyback authorization to $15.5 billion.‌

What does this figure mean? SanDisk generated $20.25 billion in revenue in fiscal
$FET took me through a trade like this: the hardest part is knowing when to exit.
This feels like a good spot. Close the position right here. Watching these two today: $SO and $BAT .
post-image
FET+4.54%
BAT+28.99%
Load More

Join 40 M users in our growing community

⚡️ Join 40 M users in the crypto craze discussion

💬 Engage with your favorite top creators

👍 See what interests you

Trending Topics

USSeptemberPPIBeatsExpectations

91.35k Views1.88k Discussing

US September PPI came in at 6.3% YoY, well above the 5.3% market expectation, pointing to renewed producer-side inflation pressure. Weekly jobless claims were 199K, broadly in line with forecasts. Could hotter inflation further reduce room for rate cuts, and what does it mean for $BTC, US stocks, and gold?

DrLinHanSpeaksAtOxfordUnion

135.63k Views1.86k Discussing

JapanAndKoreaStocksPlunge

47.27k Views1.76k Discussing

View More