Share crypto content and earn up to 60% commissions through content mining.
placeholder
gatefun
$XAU $XAUUSD
Gold remains in the fourth-wave correction and has not yet broken out. It is also clear that this is a bull-flag pattern. Gold still has an upside target in the fifth wave, so the strategy remains to buy on pullbacks!
XAU0.35%
XAUUSD-0.05%
View Original
post-image
post-image
  • Reward
  • Comment
  • Repost
  • Share
The global cryptocurrency market cap stands near $2.7 trillion with minor 24-hour consolidation, while major stock markets and tokenized equities show active sectoral shifts.
Cryptocurrency Market UpdateBitcoin (BTC): Trading around $79,400 – $79,600, experiencing slight downward pressure (~0.3% to 0.7% change) as it consolidates near the $80k threshold.Ethereum (ETH): Hovering near $2,490 – $2,500, down roughly 1.7% over the past 24 hours.Solana (SOL): Outperforming several top-caps, trading up near $106 with a ~1.8% gain.XRP: Moving around $1.42, seeing a mild pullback of under 1%.Market Sen
BTC0.00%
ETH0.06%
SOL0.24%
XRP-0.35%
CRWD20.34%
post-image
post-image
  • Reward
  • 5
  • Repost
  • Share
Leo_Kai:
1000x VIbes 🤑
View More
Today Crypto Markets News
gate liveLIVE
2,191
  • Reward
  • Comment
  • Repost
  • Share
🚀 NVIDIA ($NVDA) — AI Still Has the Spotlight
NVIDIA closed around $177.55, gaining about 1.68% in the latest session as AI demand continues to drive investor attention.
📍 Current: $177.55
🔥 Day range: $174.05–$178.42
🛡️ Support: $174
🚧 Resistance: $180
A sustained breakout above $180 could put $185–$190 in focus. But if $174 fails, traders could see a pullback toward $171–$168.
AI remains the big story — but at these levels, momentum and risk management matter.
🐂 NVDA bulls — are we seeing $180+ next?
#NVDA #NVIDIA #AI #USStocks $NVDA
NVDA8.55%
post-image
  • Reward
  • Comment
  • Repost
  • Share
🚨 $DRAM KEY LEVELS 🚨
These are the **important support & resistance zones** on the DRAM chart 👀📊
🟢 **Strong Support:** $45 – $50
➡️ Holding above this zone may trigger a bullish bounce.
🔴 **Strong Resistance:** $77 – $82
➡️ A breakout above $82 may signal further upside.
⚠️ Watch the key levels closely — rejection or breakout may decide the next move.
$DRAM | #DRAM #Stocks #StockMarket #harrycrypto
DRAM-3.99%
View Original
post-image
  • Reward
  • Comment
  • Repost
  • Share
AI Attack Capabilities Level Up! Cybersecurity Enters a Growth Period🔥
CrowdStrike CEO Speaks Frankly About the Current Situation:
As large models like Anthropic Mythos are deployed, hackers’ attack methods are becoming more complex and efficient, while the vulnerabilities in enterprises’ existing defense systems are being exposed.
To defend against AI-powered cyberattacks, enterprises continue to increase their security spending. The market has already responded: CrowdStrike and Palo Alto Networks have nearly doubled in stock price this year.
Computing power is the spear, while cybersecurity
CRWD20.34%
PANW12.79%
View Original
post-image
  • Reward
  • Comment
  • Repost
  • Share
HEAD & SHOULDERS BREAKOUTS ARE NOT ALWAYS REAL → HERE’S HOW TO SPOT THE TRAP 👀
post-image
  • Reward
  • Comment
  • Repost
  • Share
#Gate7DayNetInflowsTop3
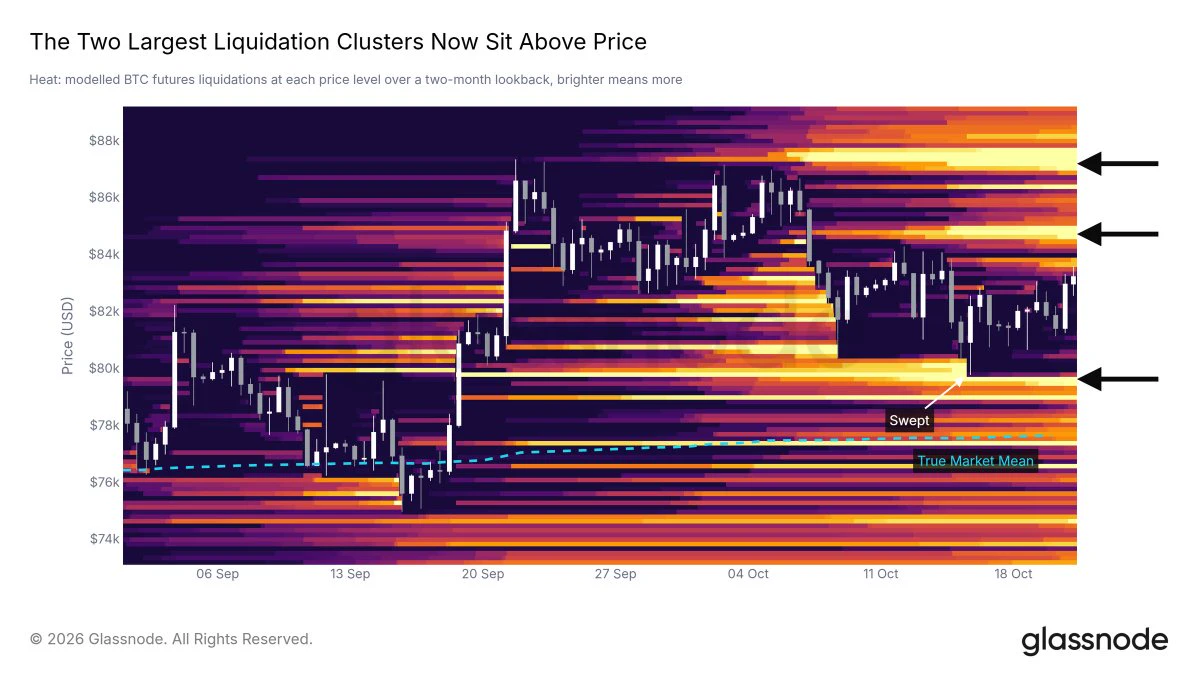
$201M+ in 7-Day Net Inflows — But the Real Crypto Story Is What Happens at BTC $80K and ETH $2.5K
The market is reaching a point where liquidity, volume and price are all colliding at the same time.
Gate recorded more than $201 million in net inflows over the past seven days, placing it among the top three centralized exchanges in the cited flow rankings. At the same time, trading activity across major assets has remained elevated.
That sounds bullish at first glance.
But capital flowing onto an exchange does not automatically mean prices are about to explode higher.
BTC0.00%
ETH0.06%
post-image
  • Reward
  • 4
  • Repost
  • Share
CryptoMishu:
To The Moon 🌕
View More
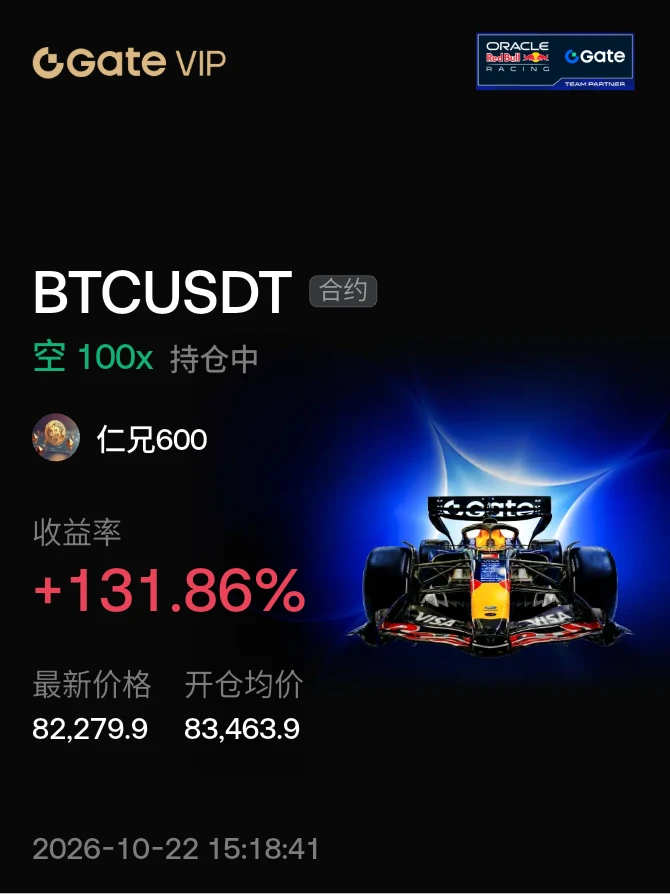
I was just about to go rant on the forum, but then I checked my balance and thought, forget it—the market is always right. A few days ago, before bed, I was still reviewing the chart. $BMT had been moving sideways at the bottom for several days, buying pressure was strengthening, and funds were quietly entering. It would have been hard to explain if this structure didn’t make a move. So I gave a bullish call and entered directly around 0.01893. When I checked this morning, it was at 0.0232, +451.66%—the sleepless nights paid off. This move has provided the answer, and the brothers on board sho
BMT9.12%
SNDK-6.73%
LAB11.60%
View Original
post-image
  • Reward
  • Comment
  • Repost
  • Share
HYPE 4-hour long/short divergence—is this trade’s win rate 95%?

$HYPE /USDT - Long LONG

Trade plan:
Entry: 83.205 – 83.771
SL: 80.773
TP1: 85.525
TP2: 86.882
TP3: 88.919

Why pay attention to this setup?
- The 1D trend is clearly bullish; trade with the trend on the 4H timeframe—no need to guess the direction.
- The current price of 83.488 is stuck at a key level, while 1H ATR is only 1.13. Volatility is contracting, and a breakout is imminent.
- RSI on 15M has returned to 50.35; the short-term shakeout is over, and bulls are back in control.
- Why now? 95% confidence doesn’t come every d
HYPE0.74%
View Original
post-image
post-image
  • Reward
  • Comment
  • Repost
  • Share
$SNDK Evening market: The 1400 level will decide everything; I’m choosing to watch more and trade less here
The market moved sideways in a narrow 1450–1480 range intraday. After retreating from 1827 all the way to now, the market has only one question: Is the drop over?
However, 1416 was the low formed by the sell-off a few days ago and has not been broken yet, indicating that some funds are buying here. To be honest,
I personally think SNDK rose too aggressively, climbing 37-fold in a year from $48 initially to $1,827 recently. A 30% pullback would not be considered much for any normal stock
SNDK-0.90%
View Original
post-image
  • Reward
  • Comment
  • Repost
  • Share
No trading, no analysis, just sheer luck—this performance is embarrassing even to talk about. Actually, it wasn’t entirely luck. During the repeated intraday fluctuations, $BEAT kept struggling around 3.2497; every upward push fell just short, and the trading volume was pitifully low. I judged it to be a paper tiger and went straight in with a long position. When I checked the market after lunch, the current price had already reached 0.1238, and the +49711.39% gain was safely in my pocket. The return makes me feel deeply apprehensive, worried that the market will figure it out tomorrow and bla
BEAT3.07%
ZEC1.48%
ETH0.01%
View Original
post-image
  • Reward
  • Comment
  • Repost
  • Share
I did nothing—just went to the bathroom, and when I came back, the candlestick chart had already done the work for me😏.

During the repeated intraday swings, $DRIFT was still hovering at high levels. The upward push was weak, while the selling pressure grew more intense with each wave. Seeing how weak the support was, I immediately opened a short at 0.03371. I wasn't expecting much, but when I came back to check the chart just now, the price had dropped straight to 0.01245, +625.21%? This short position really delivered huge profits🍗.

The market is won by waiting, and profits are made by
DRIFT1.80%
ADA-1.98%
DOGE-1.08%
View Original
post-image
  • Reward
  • Comment
  • Repost
  • Share
🏦 The Fed's Jackson Hole speech is coming—will U.S. stocks rise or fall?
The market is closely watching Jackson Hole for new signals on inflation and interest rates 👀
💬 Hawkish or dovish? Can tech stocks continue to rise?
⏳ The Gate Square Stock Insights Challenge ends today
Publish your original views, bring #GateStockInsightsChallenge and join the final day of the challenge
🎁 First-time participants are guaranteed to receive the first-post reward
🔥 Post daily to win USDT, Gate merchandise, and increased exposure
🌟 Keep participating to share the 10,000 USDT prize pool and receive VIP5
View Original
  • Reward
  • Comment
  • Repost
  • Share
$NVDA ‌thanks good very good very good
NVDA8.55%
  • Reward
  • Comment
  • Repost
  • Share
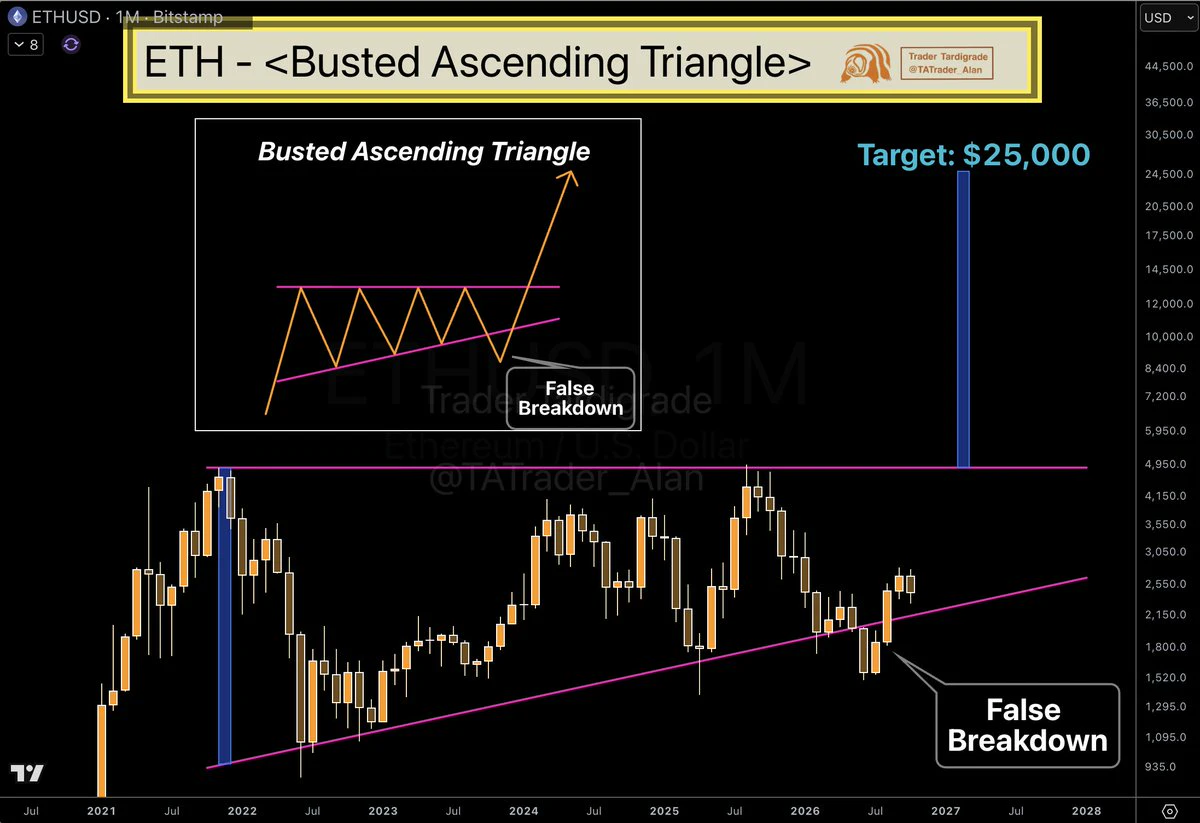
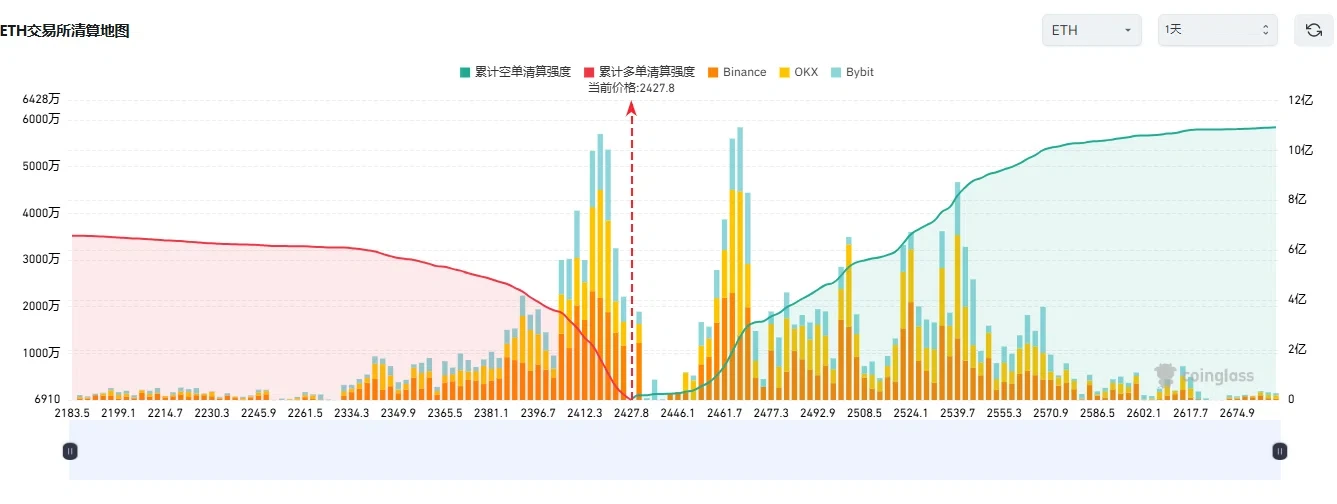
#eth Ethereum has firmly held the middle Bollinger Band on the four-hour chart and is now testing overhead resistance again. It looks like 2620 is coming soon. There is a speech tonight—let’s see whether it will surge during U.S. stock market hours.
ETH0.06%
View Original
post-image
  • Reward
  • Comment
  • Repost
  • Share
Chicago #PMI Data Takes the Pulse of the Markets
Immediately following the opening of US markets, the Chicago Business Barometer (Chicago PMI) data will be released on Friday, August 28, 2026, at 09:45 ET (16:45 GMT).
The Chicago PMI is a comprehensive indicator compiled by ISM-Chicago that measures business conditions in both manufacturing and service sectors in the region. Calculated from five sub-indices, including manufacturing, new orders, and employment, the data offers important clues about the direction of the national economy, although it is regional.
Expectations and Previous Data
Ma
post-image
post-image
  • Reward
  • 6
  • Repost
  • Share
YamahaBlue:
LFG 🔥
View More
The predictions on GT are still far too limited, with poor user traffic—not even as good as sports betting. The odds may be lower, but at least you can parlay them. The events selected are also really odd, and they can’t even get the buy and sell markets open.
GT-0.98%
View Original
post-image
  • Reward
  • Comment
  • Repost
  • Share
Load More

Join 40 M users in our growing community

⚡️ Join 40 M users in the crypto craze discussion
💬 Engage with your favorite top creators
👍 See what interests you
  • Pinned