Square
Following
Hot
News
Notifications
Profile
Share your thoughts
placeholder
Article
Rich are evacuating to safe places
post-image
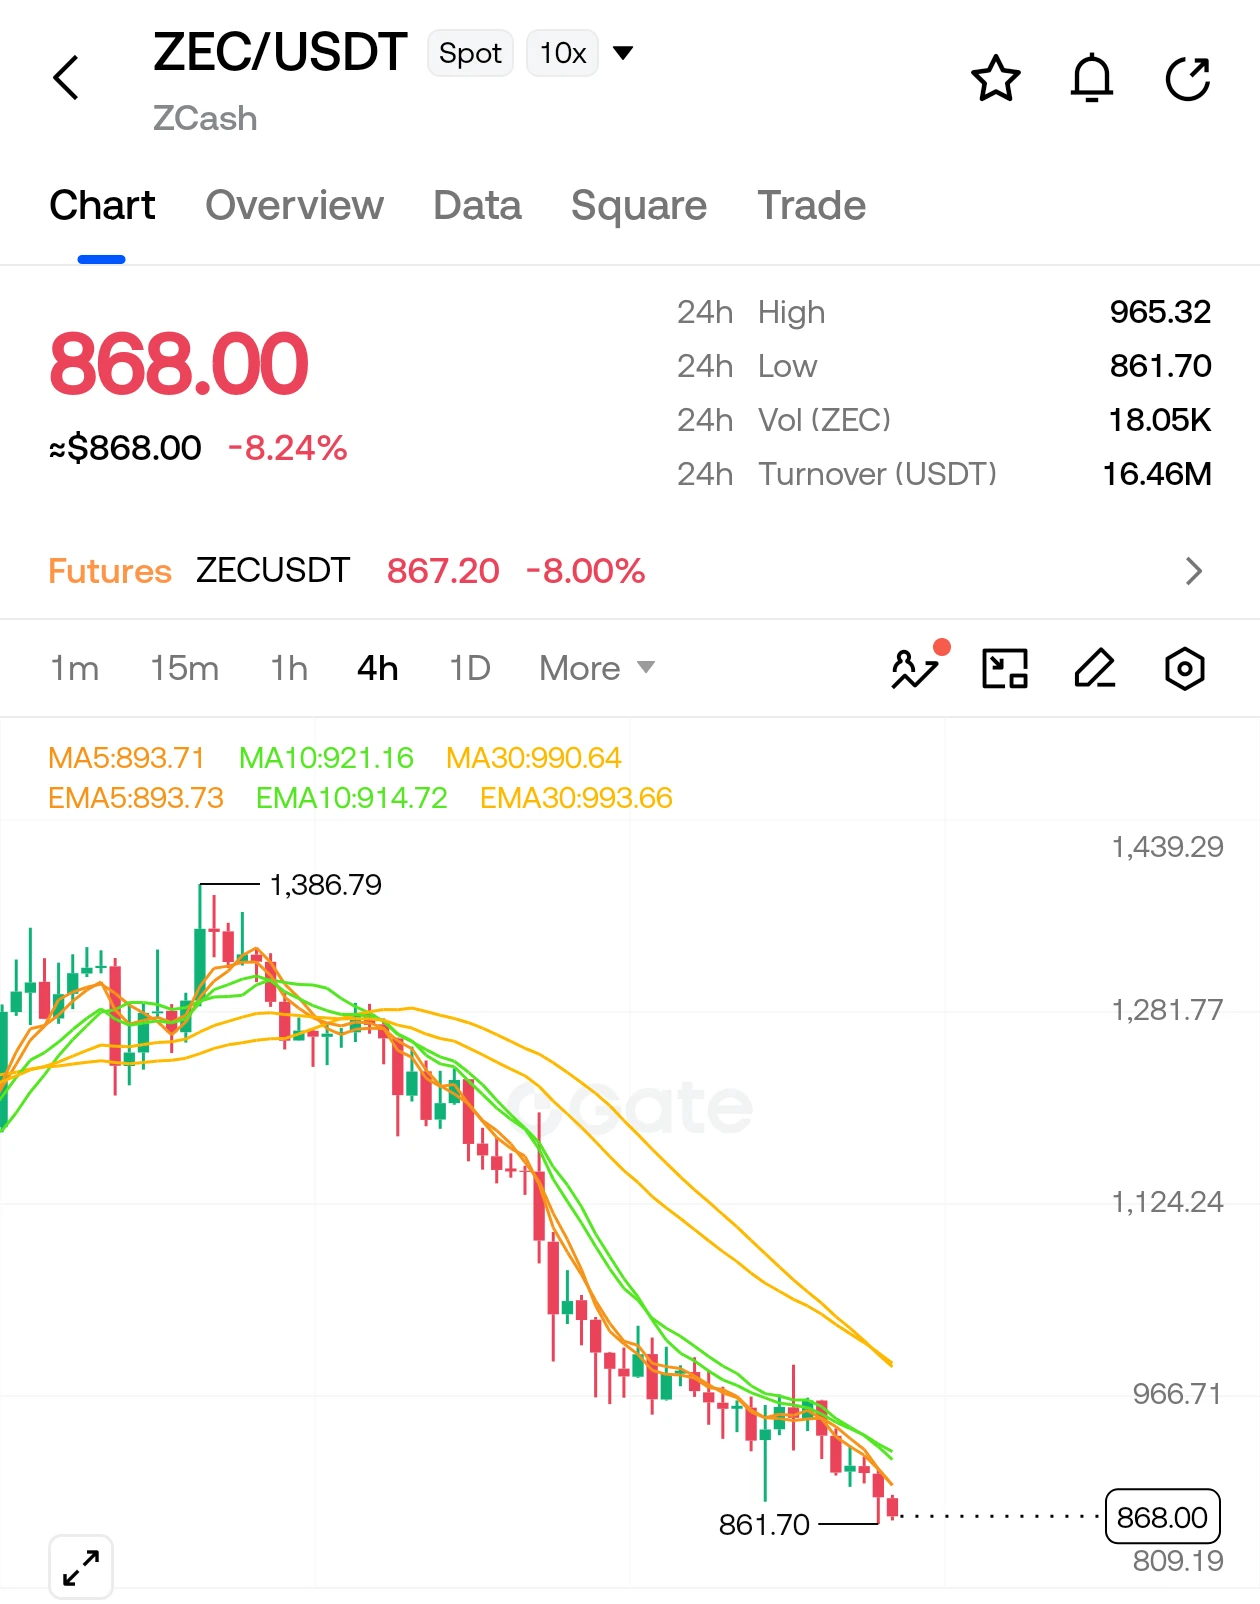
$ZEC is under heavy distribution on the 4H chart, trading at 868.00 (-8.24%) below all key moving averages. Following a tight consolidation phase beneath the 965.32 resistance ceiling, downward momentum accelerated and sliced cleanly through range support, testing the 861.70 demand floor.

The 860.00–862.00 zone is the final line of defense. Losing this level opens up serious breakdown risk toward the 809.19 liquidity pocket. Any dead-cat bounce faces stacked dynamic resistance at EMA5 (893.73) and EMA10 (914.72).

Smart money fades weak bounces here rather than catching falling knives. Lookin
post-image
ZEC+1.16%
Trenches
mihao
m
bade
b
mihao
4Cxj...pump
Market Cap
$.
Change
.
24h Vol
$.
Holders
.
IDOL
I
bade
b
IDOL
0x3b...ab07
Market Cap
$.
Change
.
24h Vol
$.
Holders
.
Snoopy
S
bade
b
Snoopy
7mEh...47Cn
Market Cap
$.
Change
.
24h Vol
$.
Holders
.
NIO
N
bade
b
NIO
7SL2...pump
Market Cap
$.
Change
.
24h Vol
$.
Holders
.
FOOD
F
bade
b
FOOD
FTu5...pump
Market Cap
$.
Change
.
24h Vol
$.
Holders
.
Spending weekends playing the game that I created 🥂
post-image
ethereum:native
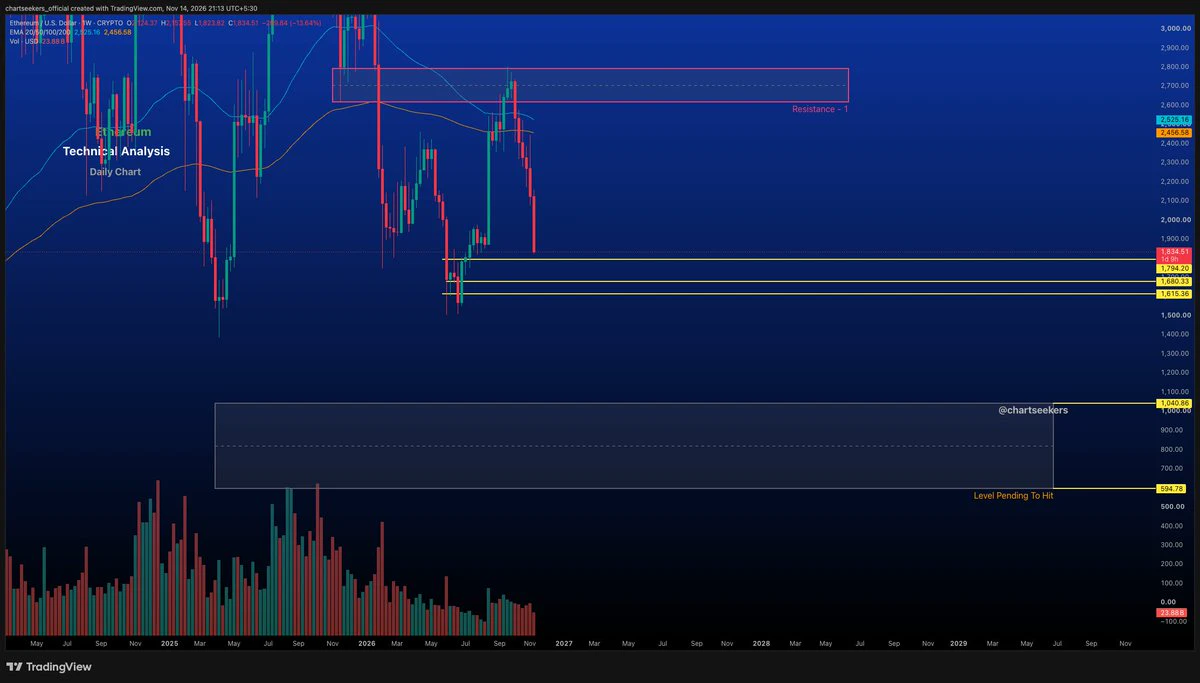
A retest of the support zone looks inevitable sooner or later. The real question is: Will we get a meaningful reversal from here?
Personally, I don't think so.
The larger wave structure still suggests further downside. ETH may need to complete its Wave C downside and the broader B-wave correction before a sustainable reversal can take shape.
Don't anticipate a reversal just because price reaches support. Let the wave structure confirm the move.
Read the structure, not the hope.
Chart Seekers — Let the Chart Speak.
post-image
ETH-1.26%
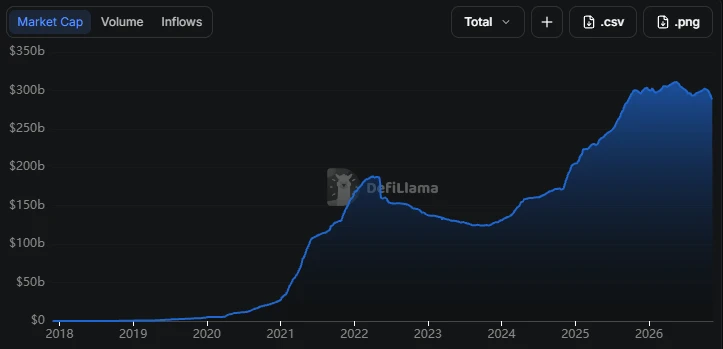
Stablecoin supply just dropped $17 billion in a month.
Biggest drop since 2022.
Think of stablecoins as the chips sitting on the poker table, guys. When people cash out, there's less money left to bet with.
Glassnode's read is simple. Bull markets need money coming in, and right now it's walking out the door.
So is this the final flush, or are we still early in the drain?
post-image
Playing out again and again, sinking deeper with every turn
In this uneven world, pain like gears bites tight into the heart
Day and night, year after year, turning and turning without end
post-image
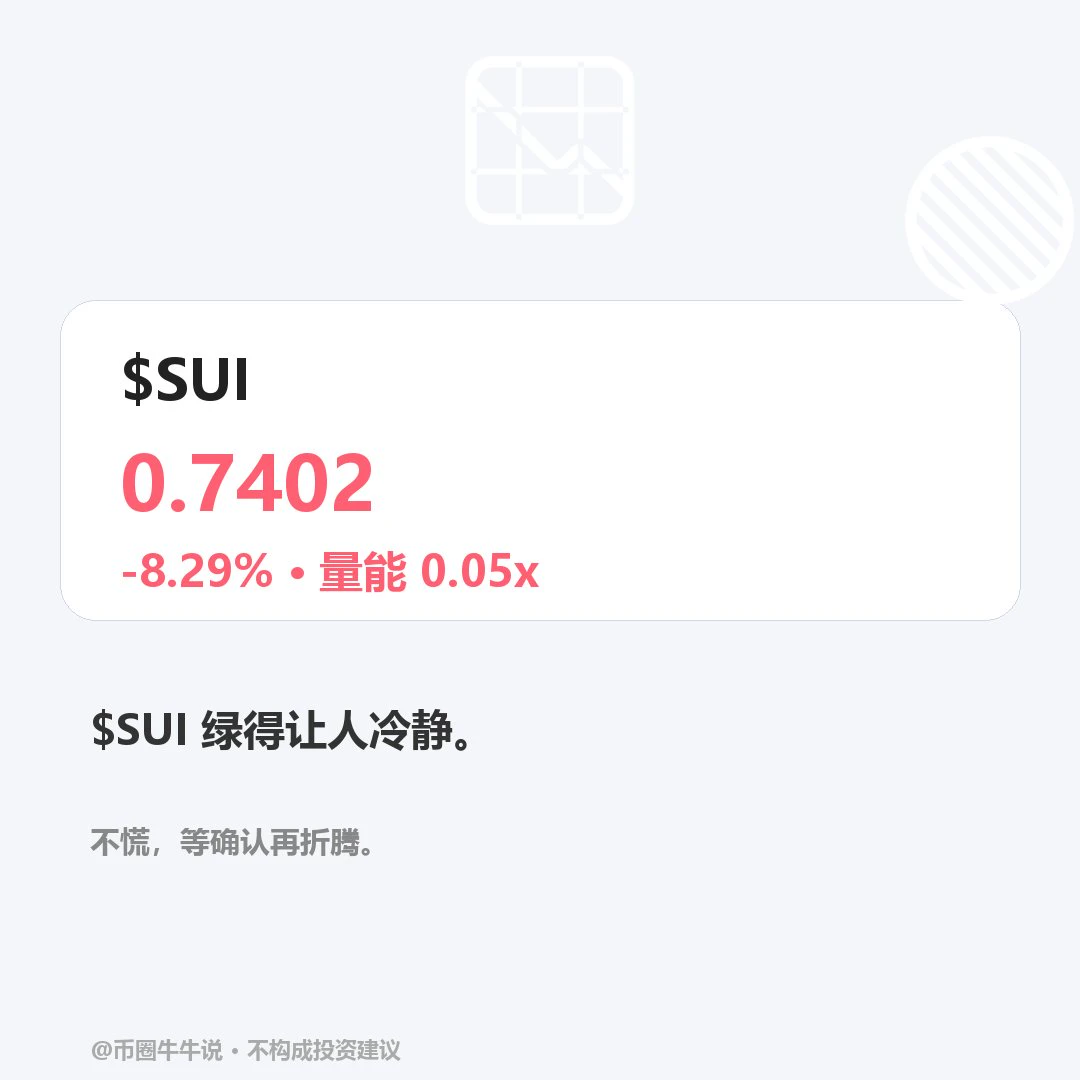
$SUI Currently trading at 0.7402, down 8.29% over 24H. The 1H trend is weak, with EMA20 at 0.770, RSI at 22.7, resistance at 0.8149, and support at 0.7339; the 4H trend is weak, with EMA20 at 0.791, RSI at 30.9, resistance at 0.8541, and support at 0.7339. If the price holds above the 0.8149 resistance level, a rebound is worth watching; a break below the 0.7339 support would mean continued weakness. In a follow-up review, check whether the price can hold above 0.8149 and reclaim 0.7339 after losing it. Trading volume is only 0.05x the average, so a single move across either level needs volum
post-image
SUI-1.05%
🚨 Shenzhen is about to become the focus of global capital markets! This meeting between China and the U.S. may be far more important than you think!
Many people think the meeting between Chinese and U.S. leaders in Shenzhen is just an ordinary diplomatic event.
But if you look closely, you’ll see that it could have implications for the repricing of trillions of dollars in global assets!
First, could there be a new turning point in the trade war?
The two sides are moving forward with tariff reduction arrangements covering about $60 billion in goods trade. If they are actually implemented, Chin
post-image
NVDA-1.92%
PAXG+0.37%
BTC-0.67%
Fear and Greed at 13, the coldest in the market; I'm bullish on $PUMP with a volume ratio of 0.618
$PUMP is at 0.002993, down 13.572% over 24h. The Fear and Greed Index is 13, sentiment across the market is frozen—I'm bullish at this level.

First, volume—24h trading volume is 10535571 USDT, just 0.618 of the 30-day average. The price is drifting down on shrinking volume, and panic sellers haven't driven up volume.

Second, open interest—OI is 16,079,875,254.00, up just 0.33% from the 2026-11-13 snapshot. Shorts haven't dared to add to their positions.

Third, positioning—the long/short accou
PUMP-1.06%
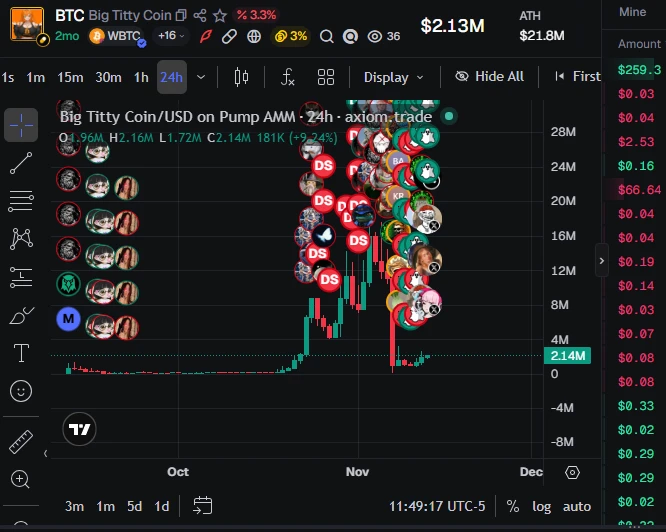
$btc & big crypto market caps collapsing the only thing that will save your portfolio now are #memecoins solana:C5xph2yL6gMdxmuLGxJBkGpmuDFfyi5fqkBNhvL6pump Big Titty Coin
C5xph2yL6gMdxmuLGxJBkGpmuDFfyi5fqkBNhvL6pump
people are saving their money in these things
post-image
BTC-0.67%
SOL-0.77%
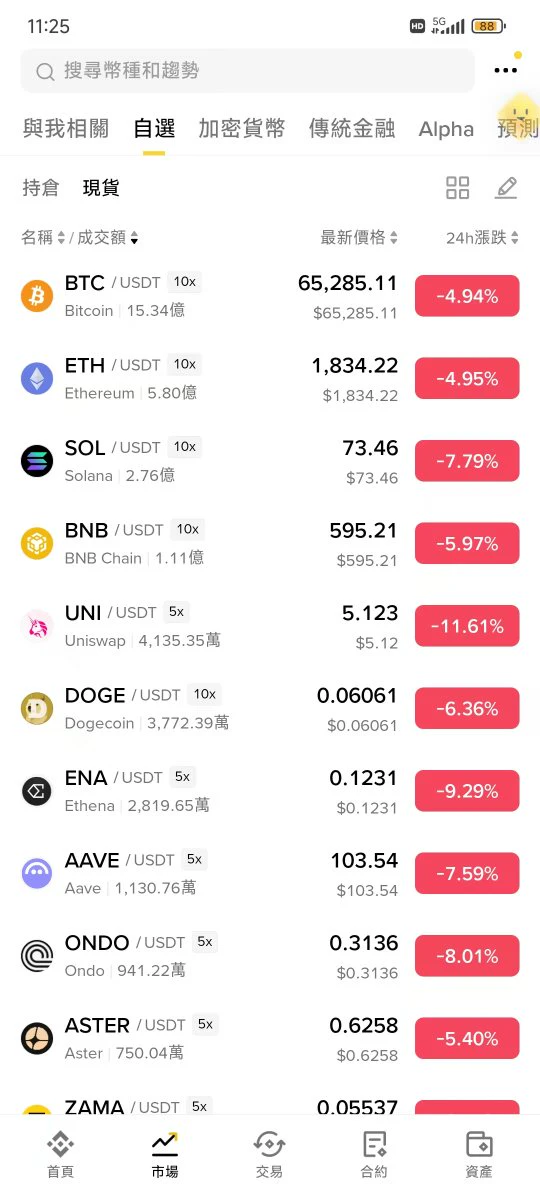
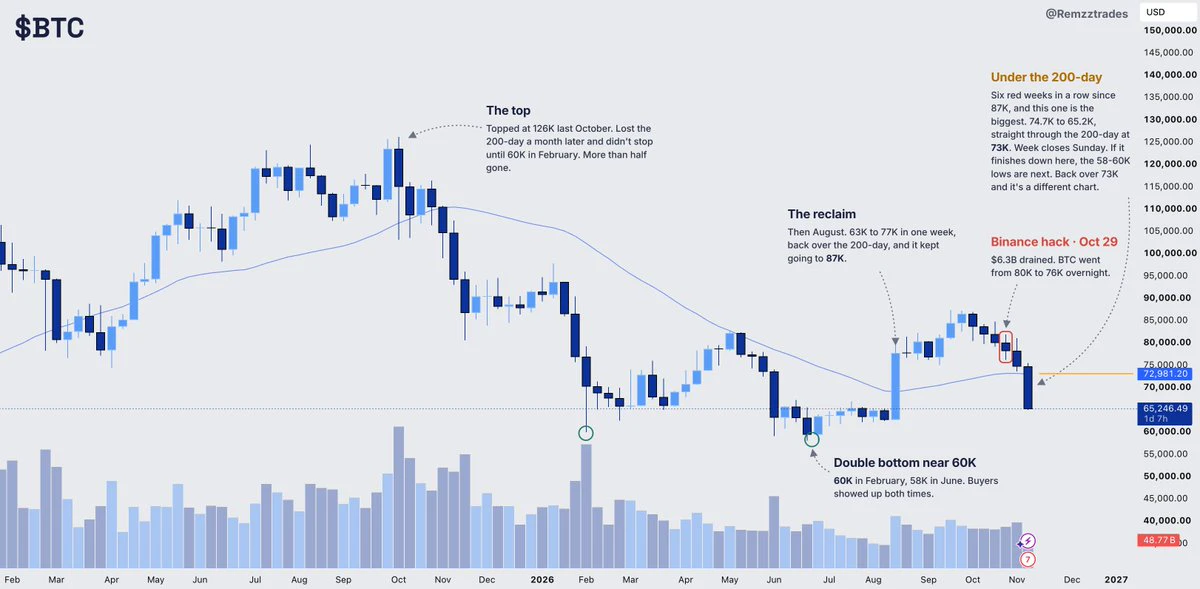
Bitcoin price loses $68K trendline: Can buyers defend $66K?

Bitcoin has fallen to around $67,200 on Nov. 14, losing more than 10% so far this week and slipping beneath its 200-week moving average as selling continues below $70,000.

TradingView’s $BTC /USDT charts show Bitcoin touching $66,456 before recovering toward $67,194 in the Nov. 14 snapshot. The daily candle was down 1.64%, while the weekly chart showed a 10.24% decline from an opening price near $74,851.

Bitcoin trades below its 200-week moving average

On the weekly chart, Bitcoin’s 200-week simple moving average stood at $67,992,
BTC-0.65%
Total cryptocurrency market capitalization exceeds $2.32 trillion, with Bitcoin dominance at 59.7
live-cover
LIVE1,973
$BTC
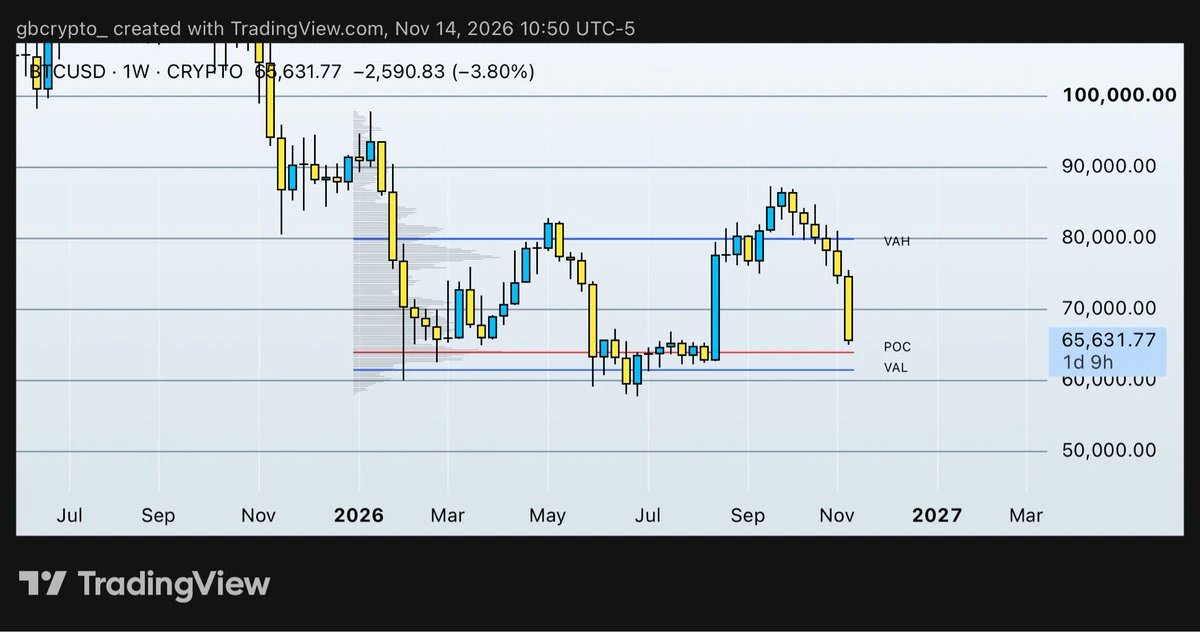
I’ve anchored a Fixed Range Volume Profile (FRVP) from the first weekly candle of 2026 through to the current week.
A few things stand out:
VAH (80K): Price has lost the upper boundary of the value area, signalling a loss of acceptance at higher prices.
POC (64K): We’re now trading around the Point of Control, the price level with the highest traded volume across this entire range. This is particularly important as it represents where the market has conducted the greatest amount of business and established its fairest value.
VAL (61.5K): The lower boundary of the value area and the next
post-image
BTC-0.67%
Weekend thoughts: Are markets preparing for a bigger selloff?
$BTC
Could Bitcoin be signaling something bigger for the broader markets?
I've used Bitcoin as a way to gauge overall market sentiment time and time again, and this time may be no different.
I'm by no means a crypto expert, but when a major risk-on asset is selling off this aggressively, I think it's something worth paying attention to.
Then again, it's entirely possible the stock market has decoupled from crypto and this ends up being a complete nothing burger.
Either way, I wouldn't ignore what Bitcoin is telling us right now, esp
post-image
BTC-0.67%
Is Tesla Ready to “Swallow” SpaceX?

As Elon Musk tries to bring two independent trillion-dollar giants together, the market may be far more interested in the spectacle than in the potential synergies.

Because SpaceX is privately held and has a unique share structure, Musk’s offhand merger idea instantly captured the market’s imagination after the company was kept out of the S&P 500.

But on closer inspection, is this a masterstroke of financial restructuring—or a bitter pill that must be swallowed to clear the index’s eligibility hurdles?

In practical terms, a Tesla–SpaceX merger is rife wi
post-image
TSLA-1.86%
James Wynn has left the chat
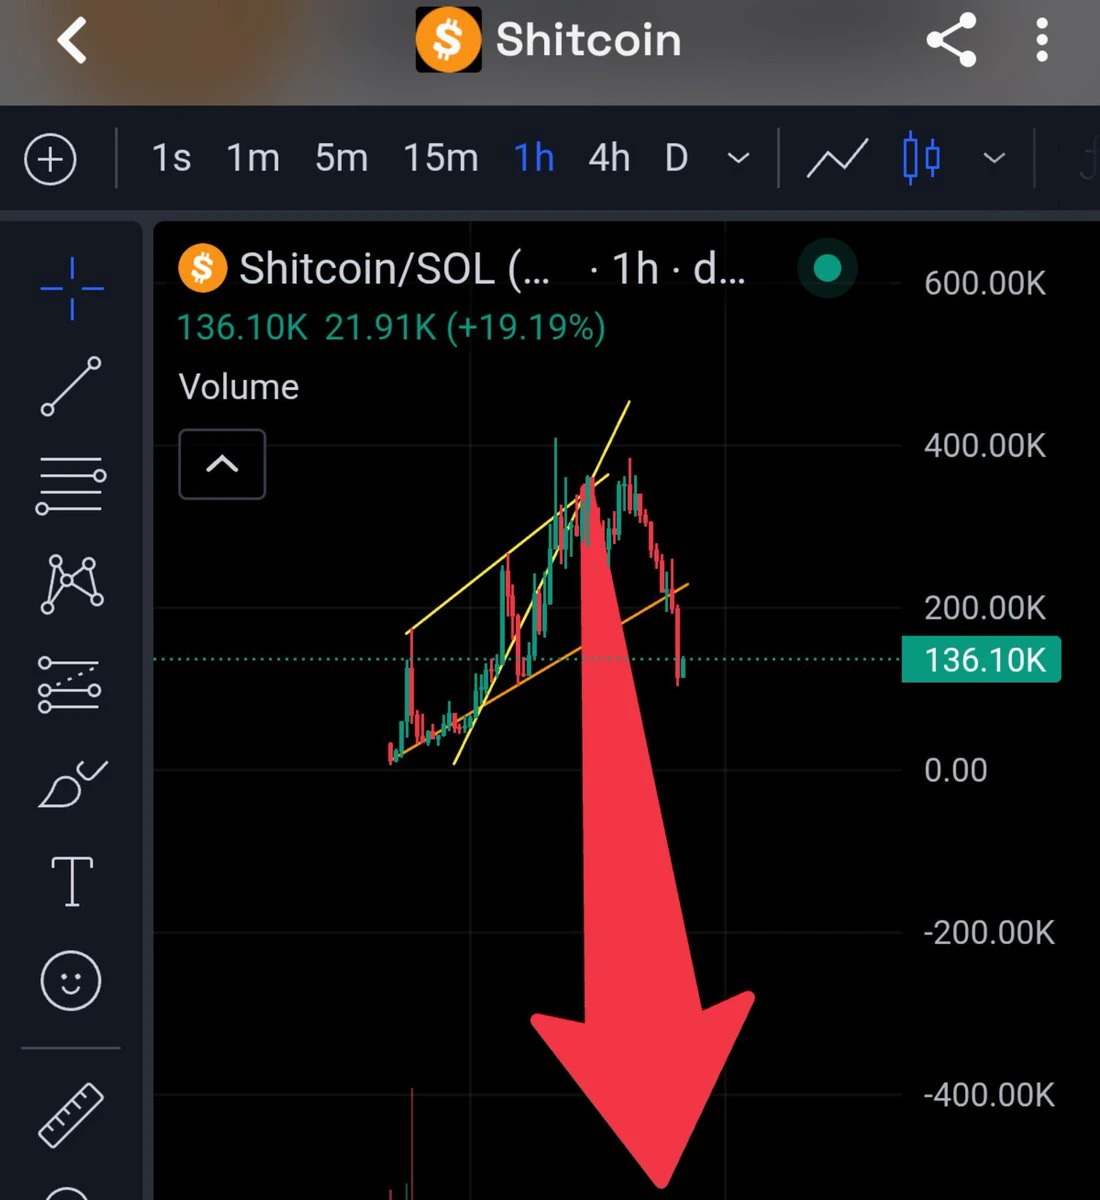
$SHITCOIN
post-image
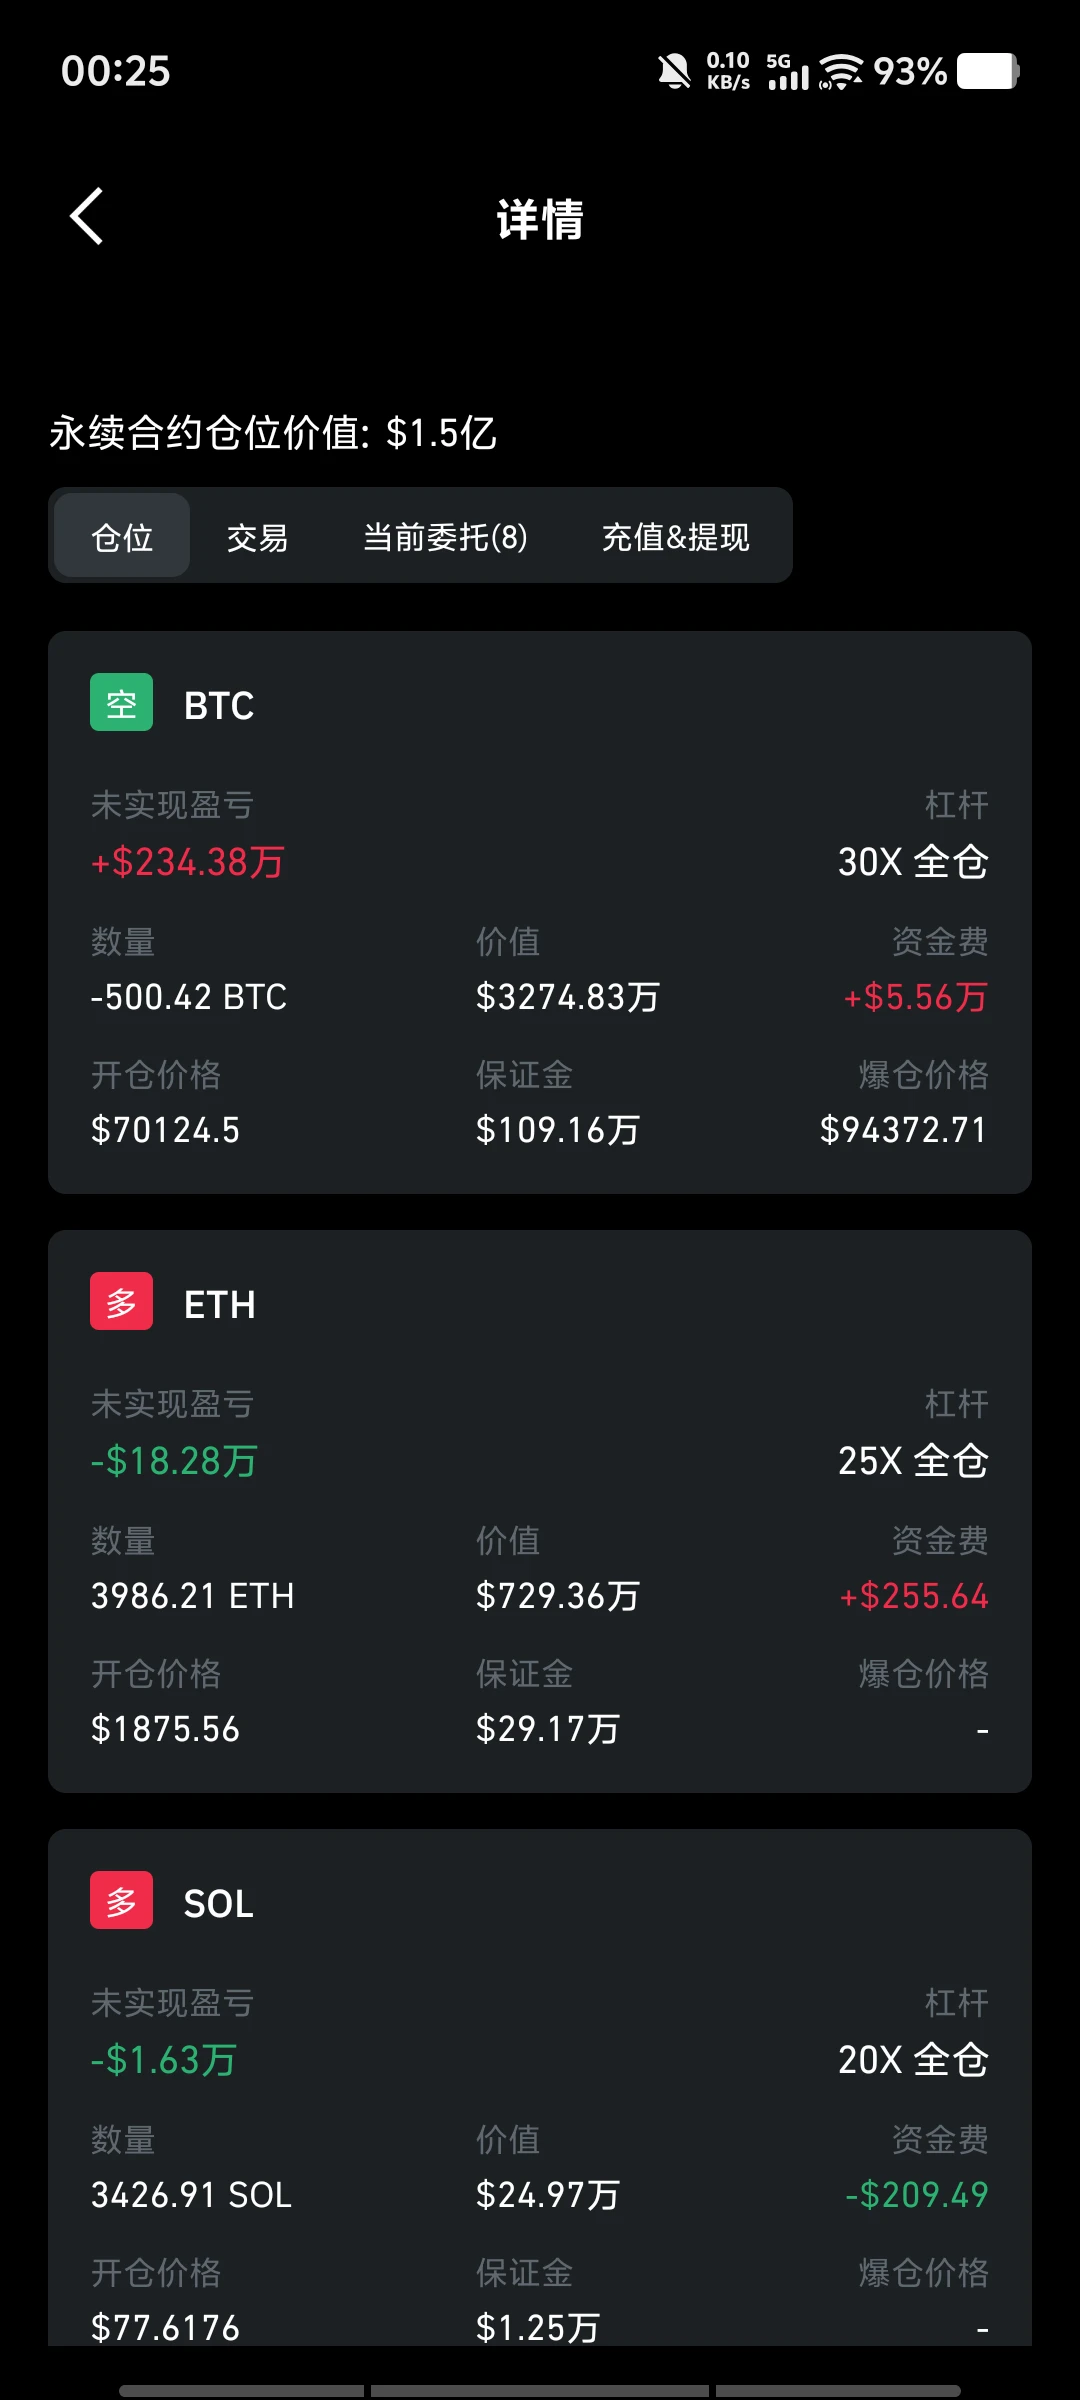
The short-selling whale's second position is an $ETH long position, holding approximately 3,986 ETH worth about $7.29 million with 25x leverage and an average entry price of about $1,875. Its current unrealized profit is about $180k, accounting for over 60% of the whale's total unrealized profit. The ETH long position uses cross margin. #Dr.Han牛津辩论社演讲
post-image
ETH-1.23%
#Dr.Han牛津辩论社演讲
What struck me most in Dr. Han's "Start Alone" talk at the Oxford Union was not fancy words, but plain words. He told his 13-year path as a path that began with losses while trading through online forums. Not with capital, but with trial and error. That is why his words landed with me.

The summary is clear: You are the boss, AI is the helper. AI gives you speed, drafts a first version, pulls research together. But it does not answer the question "what should we do?" for you. If it does, the work stops being yours.

Today, starting alone is easy, staying alive is hard. Because
post-image
  • 5
$ETH #比特币跌破7万美元 2026.11.15
Daily entry point: 1840
Resistance above: 1853–1863-1874-1884-1897
1900-1910-1920-1928-1936-1956
Support below: 1830-1824-1820-1810-1800
At all support and resistance levels, stop out on the first break; if the level holds, take a rebound, and once price stabilizes, follow the trend. If price stabilizes above 1853-1881, or breaks below 1824-1800, follow the move short; otherwise, buy low. Personal opinion for reference only.
ETH-1.23%
Load More

Join 40 M users in our growing community

⚡️ Join 40 M users in the crypto craze discussion

💬 Engage with your favorite top creators

👍 See what interests you

Trending Topics

GateIPOAccessAnthropic

322.2K Views2.9K Discussing

Gate IPO Access Phase 3 features Anthropic (ANT), with USDT subscription interest starting from 100 USDT. Successful allocations will be delivered as real shares to Gate Stock Accounts. Indicative price: $70–$78/share Subscription: Nov 12–17 (UTC+8) Allocation is not guaranteed. Please manage risk accordingly.

Dr.HanOxfordUnionSpeech

148.5K Views638 Discussing

USOctoberPPIBelowExpectations

467.8K Views1.6K Discussing

View More