



Share your thoughts
placeholder
Article
JUST IN: Elon Musk appears to have replied to a hacked X account, triggering a brief spike in SLINK before the token collapsed to zero. Market reacts to social signals around influencer-driven pumps. $SLINK
post-image
[New Streamer] Market Overview And Prediction
live-cover
LIVE75
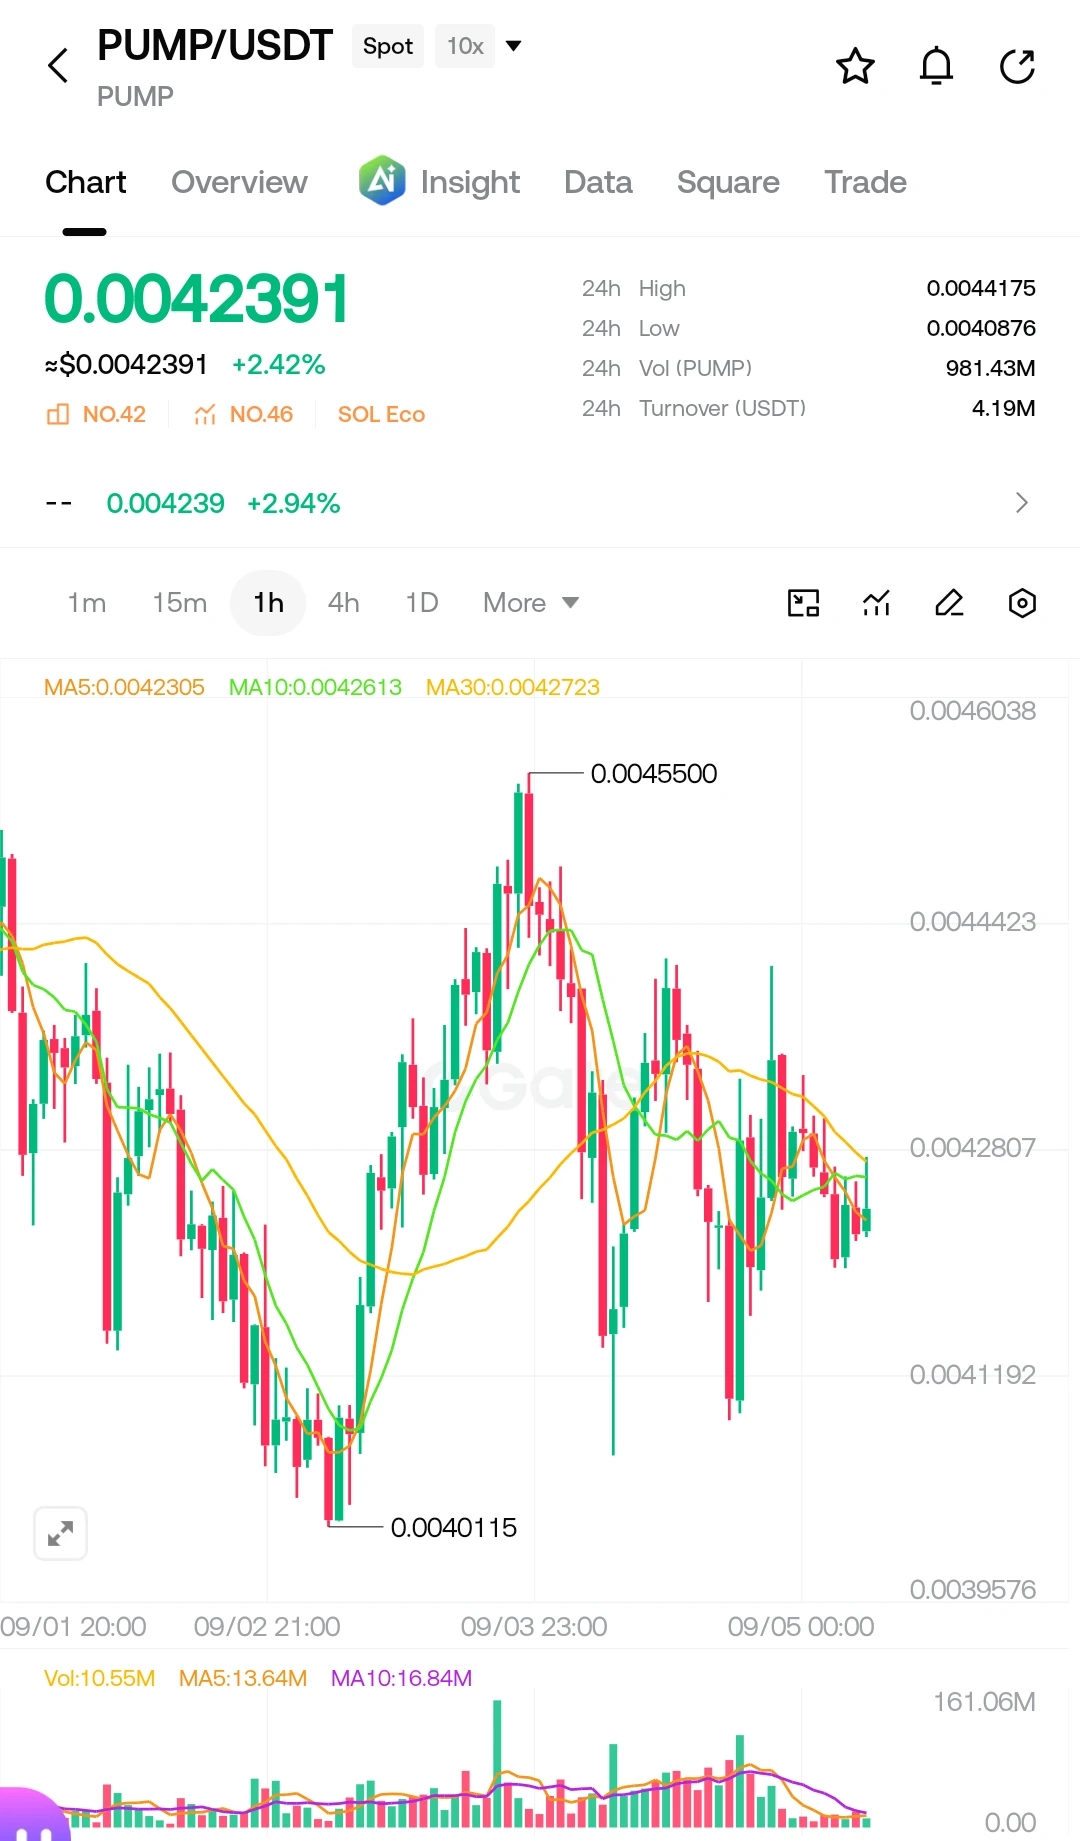
👀 I’m watching $PUMP /USDT, and this one is getting interesting.
PUMP is moving inside a tight range after the recent swings. Price is holding around $0.00424, while the chart shows buyers trying to defend the lower area. For me, the key is a clean push above the nearby resistance rather than chasing random candles.
📍 Entry Zone: $0.00420 – $0.00428
🎯 TP1: $0.00440
🎯 TP2: $0.00455
🎯 TP3: $0.00470
🛑 Stop Loss: $0.00408
If momentum returns with volume, that previous $0.00455 high becomes an important level to watch. ⚡📈
I’d keep the position controlled, take partial profits along the way,
post-image
PUMP+0.72%
I still remember my first trade on Gate. At that time, I was overthinking every price move and checking the chart every few minutes. Looking back, I had a lot to learn, but that first trade started a journey I’ll never forget.
#Gate60MUsers
post-image
  • 6
  • 2
Please don't #FOMO!
This trader made 2 #FOMO trades in one day and lost $907K.
He spent $916.5K to buy 7.28M $MEME at $0.126, then sold for $353K, losing $563K(-61.45%).
He then spent $356K to buy 8.93M $SLINK at $0.04 and sold for only $12K, losing $344K(-96.62%).
MEME+3.60%
  • 1
The day Japanese stocks launched, I bought my first Japanese stock
On August 21, Gate officially launched Japanese stock trading. I sat in front of my computer, waiting for the market to open.
The first batch included around 300 stocks listed on the Tokyo Stock Exchange. Toyota, Sony, SoftBank, Nintendo, MUFG, Tokyo Electron… all names everyone knows. I used USDT to buy some Sony shares directly—no need to open a Japanese brokerage account, exchange yen, or provide additional documents. The whole process was as simple as buying crypto.
That day, I posted on the Square: “I bought Sony stock wit
AVGO+0.18%
Everyone’s long gold at 4,437 — that’s exactly why I’m watching $XAU /USDT bleed.

$XAU /USDT - SHORT

Trade Plan:
Entry: 4433.16 – 4441.94
SL: 4479.66
TP1: 4405.97
TP2: 4384.91
TP3: 4353.33

Why this setup?
Range-bound 1D tape, RSI(15m) at 53 — zero momentum. 4h SHORT bias (55 conf) targets 4405, then 4384. ATR(1h) at 17.5 means the slide is real but slow. Entry zone 4433–4442 is the last stand before the drop; invalidation sits tight at 4479. Why now? The range top is rejecting, and the clock is ticking on this setup.

Debate:
Are you fading this range top with me, or does $XAU /USDT fak
XAU-0.98%
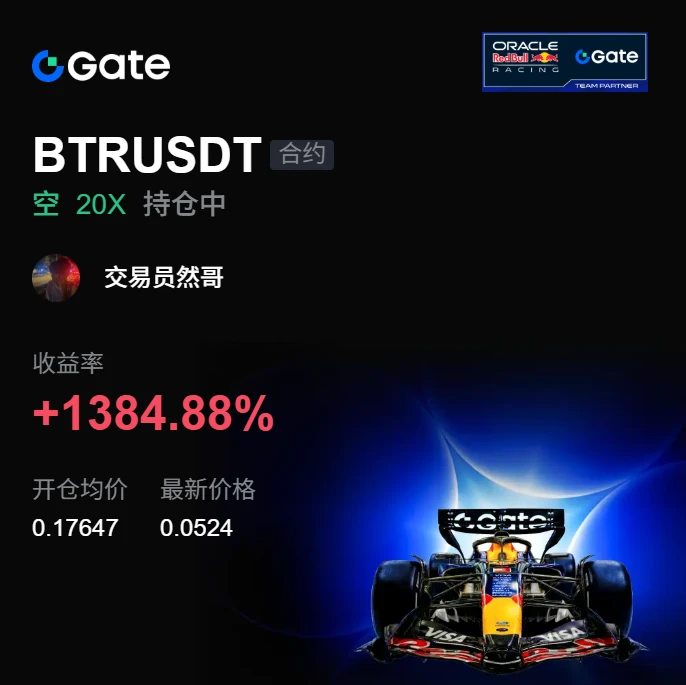
This was purely a case of the market being in a good mood and casually tossing out some gold coins—one just happened to hit me on the head.

During the repeated intraday swings, $BTR was slapped back every time it reached a key level. The resistance above was as obvious as it could get. This rebound was a paper tiger and couldn’t hold for three minutes. I took advantage of its feint and placed a short order around 0.17647.

Right after I placed it, the price began slowly moving lower, and the current price has already reached 0.05228, with unrealized gains of +1385.33%. I timed the rhythm ri
post-image
BTR+4.78%
ETH-2.07%
SNDK+12.46%
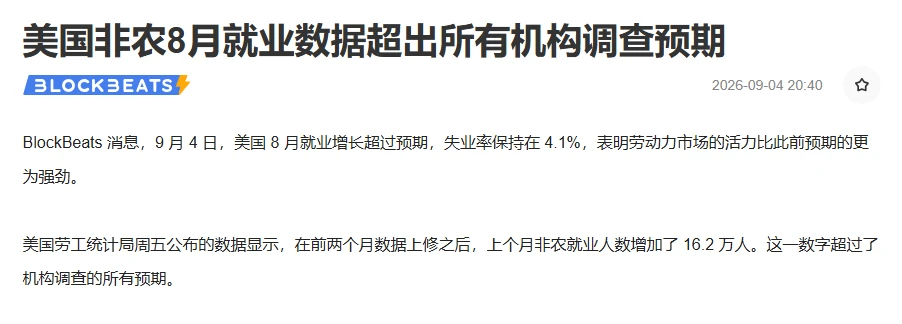
Last night at 20:30, the U.S. Department of Labor dropped a bombshell.
Nonfarm payrolls increased by 162k in August, versus market expectations of just 56k—nearly triple expectations.
June and July data were also revised up by a combined 55k.
Then what happened in the market?
Gold: Spot gold plunged more than $70 in a short period. It hit an intraday low of $4,365, diving directly from above $4,470.
Silver: It plunged $1.5 in a short period to $65.7 per ounce, briefly falling below the $65 mark.
U.S. Dollar Index: It surged 34 points in a short period, reaching 99.36.
Bitcoin: It plunged from
post-image
BTC-1.40%
XAU-0.98%
XAG-0.96%
🚀 🚀 🚀 𝐌𝐚𝐫𝐤𝐞𝐭 𝐀𝐧𝐚𝐥𝐲𝐬𝐢𝐬 | 𝐆𝐓/𝐔𝐒𝐃𝐓
GateToken ($GT ) is consolidating around the $8.35–$8.45 range following strong multi-week upside momentum. Buyers are actively defending key short-term moving average support floors as platform utility demand and ecosystem expansion drive sustained market interest.
📊 𝐊𝐞𝐲 𝐌𝐞𝐭𝐫𝐢𝐜𝐬
• Current Price: ~$8.40
• 24H Range: $8.15 – $8.55
• Market Bias: Bullish / Consolidation 🐂
📈 𝐓𝐞𝐜𝐡𝐧𝐢𝐜𝐚𝐥 𝐇𝐢𝐠𝐡𝐥𝐢𝐠𝐡𝐭𝐬
• Moving Averages: Cleanly trading above the daily 20/50 EMAs ($7.45–$7.88), reinforcing a solid bullish trend struct
GT-0.93%
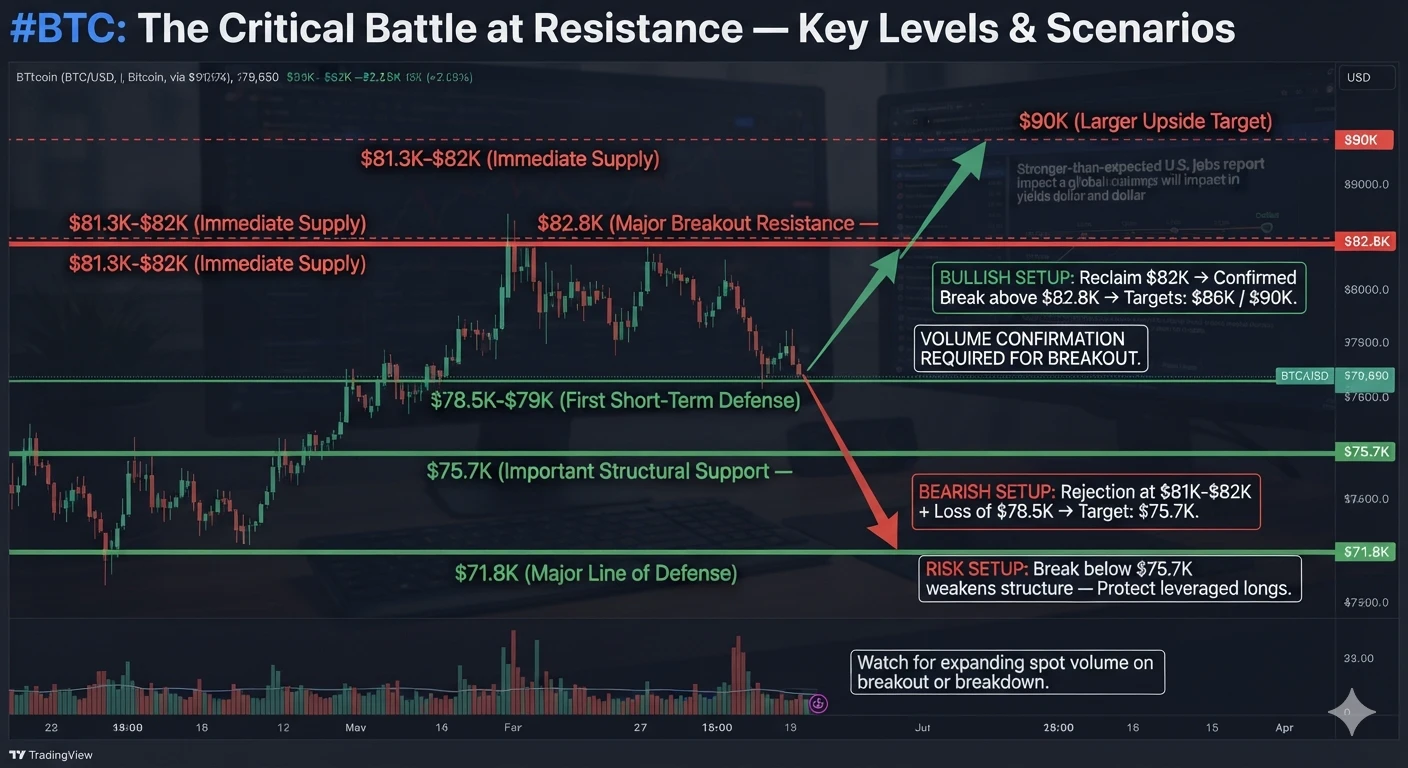
#BTCReclaims80K
#BTC — The Next Move Depends on One Battle
Bitcoin is sitting around $79.6K after getting rejected from the $81K–$82K area.
The important part isn’t the pullback itself.
It’s how BTC reacts around the levels underneath.
The stronger-than-expected U.S. jobs report brought fresh pressure from yields and the dollar, while Bitcoin quickly lost the $80K handle after briefly trading above $81K.
My key levels:
Resistance:
• $81.3K–$82K — immediate supply
• $82.8K — major breakout resistance
• $90K — next larger upside target if $82.8K breaks with strong volume
Support:
• $78.5K–$79K
post-image
BTC-1.45%
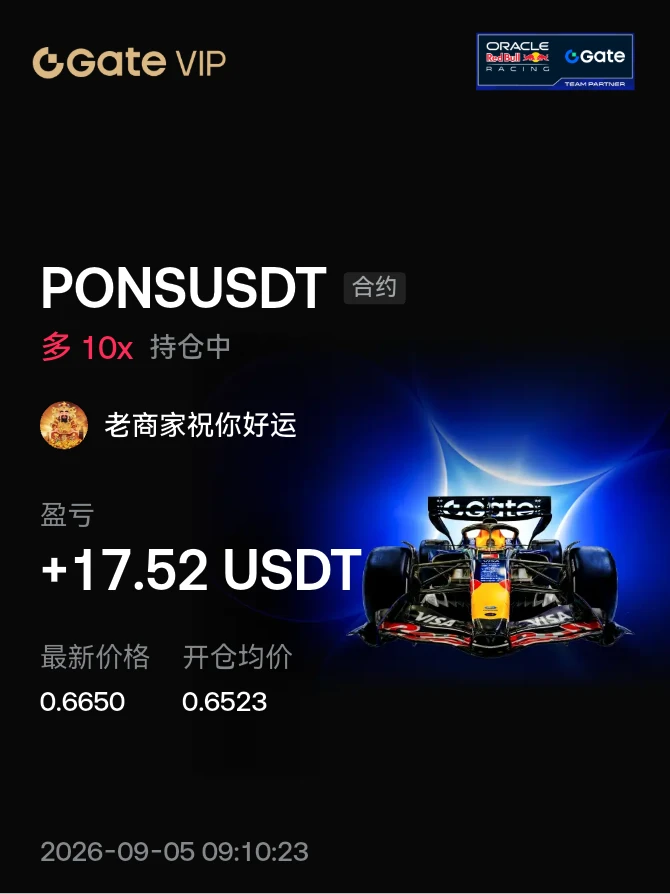
#晒出我的持仓收益 The pullback is here—open a long and keep making money$PONS
post-image
PONS-0.41%
Weekend Market Updates
live-cover
LIVE1,005
Three practical things for developers:
1. Whitelisted apps can store small settings like themes, languages, and drafts on the user’s own phone first.
Developers can rent one fewer server.
But remember: they stay with that phone, so they may be lost when switching phones; this is not cloud storage.
2. Apps can check how much valid stake this user has specifically locked for “My App.”
Valid stake is not extra coins earned, but a weighted score based on the principal and how long it is locked.
The principal is returned at maturity; the official platform pays no interest. If developers want to off
post-image
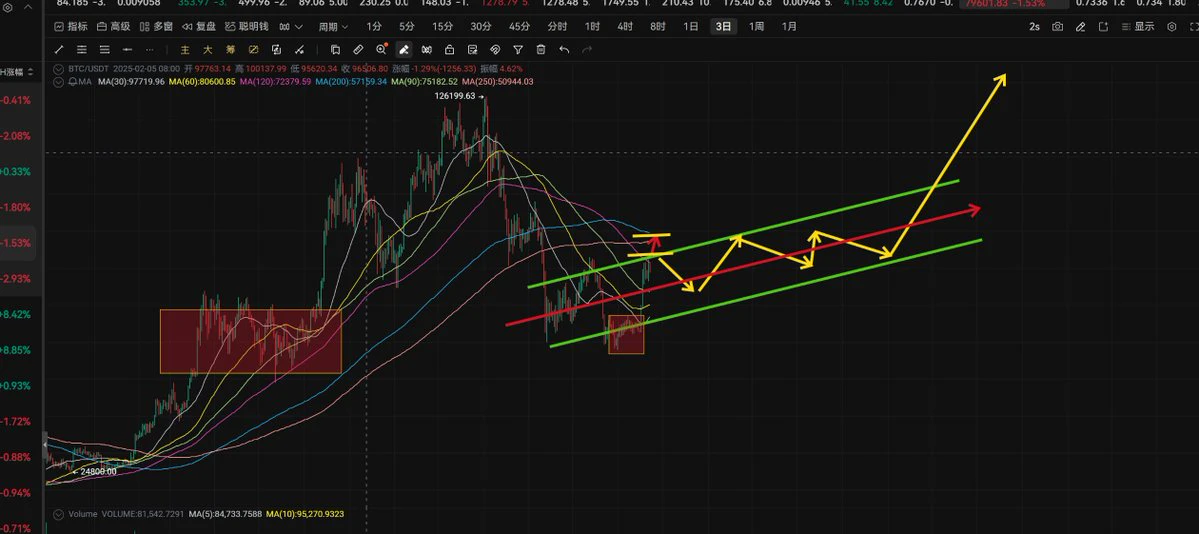
Perhaps I should also put aside my bearish thinking on BTC and start anticipating a new bull market;
BTC is currently at $79,600. Judging from the continuation pattern on the three-day chart, there may still be another move higher. If the crypto bill passes on the 15th, it may test the $85,000–$88,000 range, but I believe it will still pull back once this bullish catalyst is priced in. I previously gave this upward move a 30% probability, but as the continuation pattern persists, I have raised it to 50%;
As for what price level to enter on the pullback, regardless of whether it moves up or dow
post-image
BTC-1.40%
Everyone’s staring at the 1D range, but DOGE just armed a trap that most retail won’t see until it’s too late.

$DOGE /USDT - SHORT

Trade Plan:
Entry: 0.08443 – 0.08479
SL: 0.08632
TP1: 0.08332
TP2: 0.08247
TP3: 0.08118

Why this setup?
The 4h structure is screaming SHORT with 55% confidence, yet the 1D is dead flat. That’s the setup—when range meets momentum, the breakout is violent.
- RSI 15m at 45.38: no overbought relief, sellers still in control.
- ATR 1h at 0.000714: volatility is compressing, but TP1 at 0.08332 is only 1.5% away—low risk, high reward.
- Entry ref 0.08461 with
DOGE-2.97%
$NVDA Nvidia May Reclaim the “Iron Throne”
Share prices of U.S. tech giants are once again nearing record highs—and this time, Nvidia is clearly the player leading the bull-market charge.
After falling behind other surging semiconductor stocks earlier in 2026, Nvidia has recently been reestablishing its position as the “king of the AI trade.”
On Thursday, the first and largest U.S. ETF tracking the “Magnificent Seven”—the Roundhill Magnificent Seven ETF—surged nearly 2.5% to close at $70.43, just below its record closing high of $70.94 set in May this year. The ETF holds equal positions in the
post-image
ThisIsTranslateContent:
$NVDA Nvidia May Reclaim the “Throne”
US tech giants’ stock prices are once again approaching record highs—and this time, Nvidia is clearly the player leading the bull market charge.
After falling conspicuously behind other surging semiconductor stocks earlier in 2026, Nvidia has recently begun reasserting its position as the “king of the AI trade.”
On Thursday, the first and largest US-listed ETF tracking the “Magnificent Seven”—the Roundhill Magnificent Seven ETF—surged nearly 2.5% to close at $70.43, approaching its record closing high of $70.94 set in May this year. The ETF holds equal-weight positions in the seven tech giants—Microsoft, Apple, Nvidia, Alphabet, Amazon, Meta, and Tesla—and rebalances quarterly.
In recent months, the “Magnificent Seven” stocks have shown clear divergence. Of the seven constituents, Nvidia and Apple are closest to their record highs, with both less than 3% below their all-time highs. Meanwhile, Alphabet, Meta, and Tesla have fallen by double digits from their record highs.
Nvidia’s stock has recently gained strong momentum, boosted by its robust earnings report last week. In its latest earnings report, the company said it expected revenue for the fiscal year ending January 2028 to grow by more than 70%.
Joe Tigay, portfolio manager at Equity Armor Investments, wrote in a report last week that the earnings results showed “the buildout of AI infrastructure remains endless.”
Overnight, Nvidia received its latest piece of good news with the announcement that it would acquire Hugging Face, a popular open-source AI developer platform. In a report on Thursday, Forrester Vice President and Principal Analyst Jeff Pollard said the deal would help the chip giant gain greater control and visibility over the open-source software layer, thereby deepening Nvidia’s AI ecosystem.
Nvidia returns to the spotlight Nvidia’s market leadership once again marks a reversal in the industry landscape from earlier this year. At that time, as semiconductor stocks such as Micron Technology and Advanced Micro Devices (AMD) drove the iShares Semiconductor ETF to a record high, Nvidia was left far behind. Some analysts speculated that Nvidia had become too large, and investors were seeking differentiated semiconductor plays.
Data shows that although the iShares PHLX Semiconductor ETF (SOXX) has risen 67% year to date, the semiconductor sector as a whole has recently significantly underperformed Nvidia as investors recalibrated their expectations for some fast-growing chip stocks. Over the past three months, Nvidia’s stock has risen 7%, while SOXX has fallen 18%.
Despite shifts in market sentiment and competition from rivals, Nvidia has once again demonstrated its irreplaceability in the AI wave through strong earnings expectations and strategic reinforcement of the open-source ecosystem. As hardware infrastructure buildout continues and the software ecosystem matures, whether Nvidia can lead the “Magnificent Seven” to new highs will become a key indicator of the direction of US tech stocks. $NVDA
repost-content-media
NVDA+0.87%
MSFT-2.03%
AAPL-2.51%
AMZN-0.15%
META+0.99%
  • 1
$MU Micron plans to add 60,000 HBM wafers/month in capacity this year, with total capacity expected to double from current levels
Micron plans to make large-scale equipment investments by the end of the year to expand production of its latest 12-layer HBM4 products, adding up to 60,000 HBM wafers/month in capacity. Total capacity is expected to double, helping it catch up with Samsung and SK hynix in HBM market share.
Micron has suddenly unveiled a major HBM capacity expansion plan, directly targeting the core supporting component currently in shortest supply for AI chips. Many investors who h
MU+5.89%
  • 7
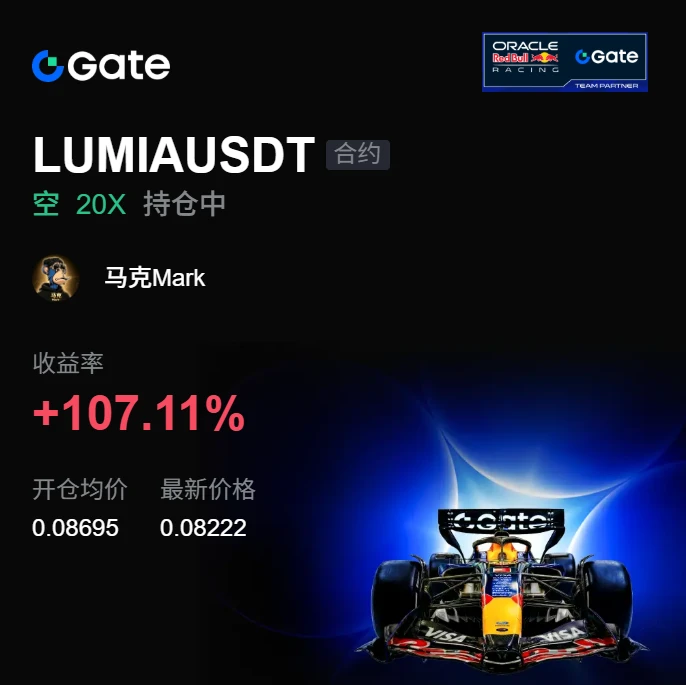
This move is so obvious, I don’t even need to think—the account is dancing on its own.

Right after lunch, when I checked the chart, it made another push upward, but the buying strength was clearly insufficient. The candlesticks looked like they were stepping on cotton, bouncing up and softening back down. A rebound without enough support can’t last long. I went short directly around 0.08695. The entry cost wasn’t high, and I had a stop-loss in place; the rest was left to time.

Now at 0.08222, +107.11%. This short-side move paid out cleanly and decisively—feels great.

Close 80% first and
post-image
SNDK+12.46%
BNB-0.41%
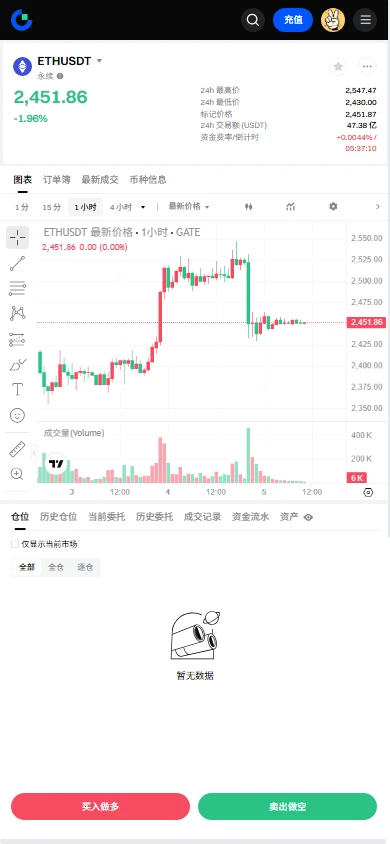
$ETH Signal】Go long + 4H momentum expansion/buy-side depth skew
$ETH RSI 4H 67.07, 1H MACD histogram -1.53 narrowing, with price pinned at 2523. The 4H MACD histogram is 13.26, with bullish momentum expanding; the upper Bollinger Band is 2543, and price is near but has not broken away from the upper band. Order book depth imbalance is 65.26%, with a bid-ask ratio of 4.76, and buy-side depth clearly dominant. The 2500 round-number level has held for four consecutive 4H candles.
🎯Direction: Go long
⚡Entry/limit orders: Place staggered orders in the 2516.029 - 2523.600 range
🛑Stop-loss: 2461.6
post-image
ETH-2.07%
BTC-1.40%
SOL-1.66%
Load More

Join 40 M users in our growing community

⚡️ Join 40 M users in the crypto craze discussion

💬 Engage with your favorite top creators

👍 See what interests you

View More