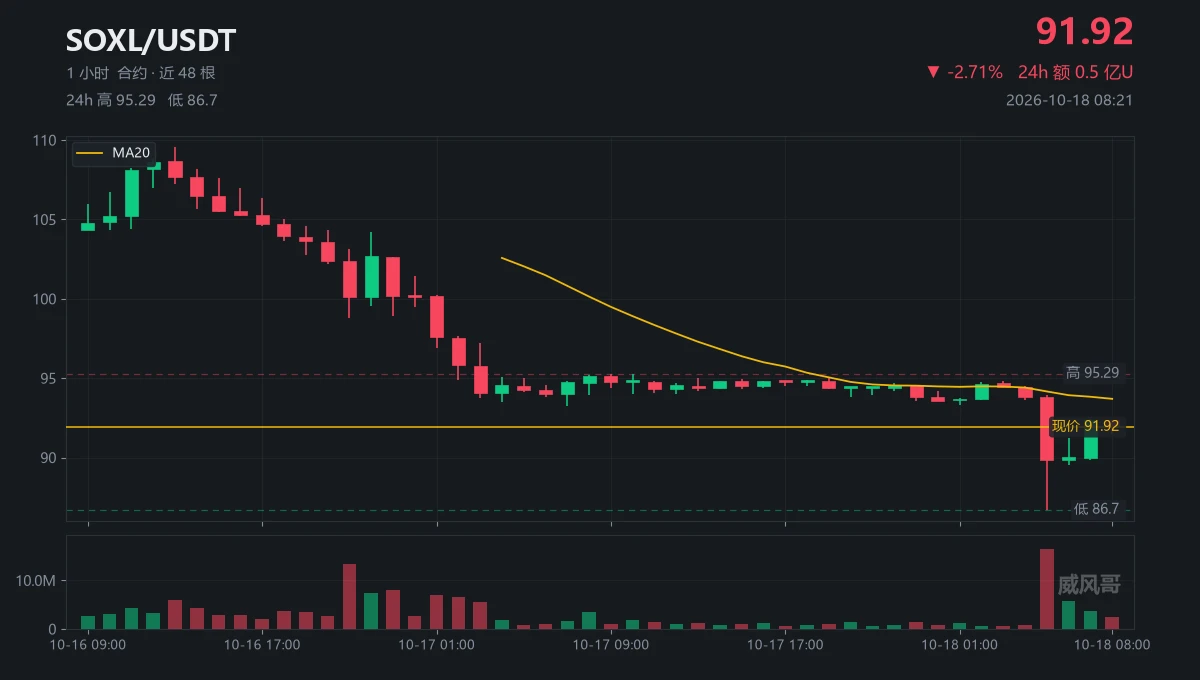

#美国9月PPI大超预期 #沃什IMF讲话 Brent crude breaks above $110; U.S. stocks and Bitcoin should be cautious before November 3
What happens if oil prices keep rising, AI stocks start correcting, and U.S. inflation remains stubbornly high?
Each of these factors alone may not necessarily trigger a major sell-off. But if they converge around the November 3 U.S. midterm elections, the market could face a challenging stress test.
01 The real problem is oil pushing inflation higher again
Brent crude has broken above $110 per barrel. This price warrants caution because crude oil is not an ordinary commodity: its effects ripple throughout the economy through transportation, production, chemicals and consumer spending.
More importantly, U.S. CPI rose 3.7% year over year in September, while gasoline prices jumped 9.1% month over month. The simultaneous rebound in inflation and rise in energy prices have prompted markets to reconsider whether the Federal Reserve needs to maintain its restrictive policy. Here lies a key tension. If oil prices spike briefly and then fall, markets may quickly absorb the negative impact; but if geopolitical conflicts persist and oil prices remain elevated, inflation could prove more persistent than expected.
This would make the Fed's choices more difficult: cutting rates could prolong inflationary pressures, while keeping rates high could weigh on the economy and asset valuations. So what concerns us more than oil rising 3.6% on any given day is whether high oil prices will change market expectations for interest rates over the coming months.
02 AI valuations and high interest rates could reinforce each other
AI has been one of the most important drivers of the latest U.S. stock market rally. The market has been willing to assign high valuations to companies involved in chips, cloud computing and data centers because investors believe their revenue and profits will continue to grow.
But two questions need answering now: How much return will AI investment actually generate? If financing costs keep rising, are those returns still worth today's stock prices?
Reuters reported on October 15 that confidence in further gains for U.S. stocks depends heavily on strong earnings from large technology companies. Meanwhile, rising oil prices and Treasury yields are also putting pressure on high-valuation assets. This means that even if the AI industry's long-term direction remains unchanged, stock prices could first go through a valuation contraction. If technology companies report better-than-expected results, the market could still recover; if earnings disappoint while interest rates rise, the correction may be more than a short-term swing in sentiment.
03 Could the November 3 midterm elections become a black swan?
The election itself is not necessarily a black swan; the real risk to watch for is a gap between the election outcome and market expectations.
The U.S. midterm elections will determine control of Congress. Different outcomes could affect fiscal policy, tariffs, AI regulation and the progress of cryptocurrency legislation. For the crypto industry in particular, the pace of digital asset regulatory policy is worth watching.
But changes in congressional seats do not mean all U.S. policies will change immediately. The executive branch still has considerable policy tools at its disposal, and the specific impact will also depend on subsequent legislation and implementation.
What could truly catch markets off guard is a scenario in which investors expect the election to bring policy moderation, but the result instead creates greater policy uncertainty; or in which energy prices keep rising, increasing pressure on the government over inflation and the cost of living. If markets have already bet on a particular election outcome and the result fails to meet expectations, crowded positions could be unwound all at once.
04 What could happen to Bitcoin?
In the short term, Bitcoin should not simply be treated as a safe-haven asset. If oil prices continue to rise, inflation rebounds and the Fed sends a more hawkish signal, both technology stocks and crypto markets could come under pressure.
Bitcoin also faces an additional risk: liquidations of leveraged positions could amplify a decline. Conversely, if geopolitical tensions ease, oil prices fall and markets confirm that the Fed will not tighten policy further, risk assets could rebound quickly.
So, over the coming weeks, focus on four indicators: Brent crude prices, U.S. two-year Treasury yields, U.S. technology companies' earnings performance, and Bitcoin ETF flows and changes in futures-market leverage. These are more useful than simply guessing the outcome of a particular election.
05 How should you respond?
Volatility risks in U.S. stocks and crypto markets may rise for a while, but that does not mean a bear market is inevitable. If oil prices fall, yields stabilize and companies deliver on earnings, the market could still recover; if oil prices stay high, rate expectations continue to rise and AI earnings fall short of expectations, the market could face a deeper correction.
For investors, keep some cash on hand, manage leverage, and don't rush to buy the dip after a single decline or easily dismiss the value of long-term assets when markets panic.
The real risk to watch for is not any single negative factor, but several risks that could otherwise be absorbed separately happening at the same time. Treat the period before November 3 as an event window that warrants close attention, not as a predetermined market turning point. Going forward, watch oil prices, interest rates and earnings. The data will show where the market ultimately goes.
What happens if oil prices keep rising, AI stocks start correcting, and U.S. inflation remains stubbornly high?
Each of these factors alone may not necessarily trigger a major sell-off. But if they converge around the November 3 U.S. midterm elections, the market could face a challenging stress test.
01 The real problem is oil pushing inflation higher again
Brent crude has broken above $110 per barrel. This price warrants caution because crude oil is not an ordinary commodity: its effects ripple throughout the economy through transportation, production, chemicals and consumer spending.
More importantly, U.S. CPI rose 3.7% year over year in September, while gasoline prices jumped 9.1% month over month. The simultaneous rebound in inflation and rise in energy prices have prompted markets to reconsider whether the Federal Reserve needs to maintain its restrictive policy. Here lies a key tension. If oil prices spike briefly and then fall, markets may quickly absorb the negative impact; but if geopolitical conflicts persist and oil prices remain elevated, inflation could prove more persistent than expected.
This would make the Fed's choices more difficult: cutting rates could prolong inflationary pressures, while keeping rates high could weigh on the economy and asset valuations. So what concerns us more than oil rising 3.6% on any given day is whether high oil prices will change market expectations for interest rates over the coming months.
02 AI valuations and high interest rates could reinforce each other
AI has been one of the most important drivers of the latest U.S. stock market rally. The market has been willing to assign high valuations to companies involved in chips, cloud computing and data centers because investors believe their revenue and profits will continue to grow.
But two questions need answering now: How much return will AI investment actually generate? If financing costs keep rising, are those returns still worth today's stock prices?
Reuters reported on October 15 that confidence in further gains for U.S. stocks depends heavily on strong earnings from large technology companies. Meanwhile, rising oil prices and Treasury yields are also putting pressure on high-valuation assets. This means that even if the AI industry's long-term direction remains unchanged, stock prices could first go through a valuation contraction. If technology companies report better-than-expected results, the market could still recover; if earnings disappoint while interest rates rise, the correction may be more than a short-term swing in sentiment.
03 Could the November 3 midterm elections become a black swan?
The election itself is not necessarily a black swan; the real risk to watch for is a gap between the election outcome and market expectations.
The U.S. midterm elections will determine control of Congress. Different outcomes could affect fiscal policy, tariffs, AI regulation and the progress of cryptocurrency legislation. For the crypto industry in particular, the pace of digital asset regulatory policy is worth watching.
But changes in congressional seats do not mean all U.S. policies will change immediately. The executive branch still has considerable policy tools at its disposal, and the specific impact will also depend on subsequent legislation and implementation.
What could truly catch markets off guard is a scenario in which investors expect the election to bring policy moderation, but the result instead creates greater policy uncertainty; or in which energy prices keep rising, increasing pressure on the government over inflation and the cost of living. If markets have already bet on a particular election outcome and the result fails to meet expectations, crowded positions could be unwound all at once.
04 What could happen to Bitcoin?
In the short term, Bitcoin should not simply be treated as a safe-haven asset. If oil prices continue to rise, inflation rebounds and the Fed sends a more hawkish signal, both technology stocks and crypto markets could come under pressure.
Bitcoin also faces an additional risk: liquidations of leveraged positions could amplify a decline. Conversely, if geopolitical tensions ease, oil prices fall and markets confirm that the Fed will not tighten policy further, risk assets could rebound quickly.
So, over the coming weeks, focus on four indicators: Brent crude prices, U.S. two-year Treasury yields, U.S. technology companies' earnings performance, and Bitcoin ETF flows and changes in futures-market leverage. These are more useful than simply guessing the outcome of a particular election.
05 How should you respond?
Volatility risks in U.S. stocks and crypto markets may rise for a while, but that does not mean a bear market is inevitable. If oil prices fall, yields stabilize and companies deliver on earnings, the market could still recover; if oil prices stay high, rate expectations continue to rise and AI earnings fall short of expectations, the market could face a deeper correction.
For investors, keep some cash on hand, manage leverage, and don't rush to buy the dip after a single decline or easily dismiss the value of long-term assets when markets panic.
The real risk to watch for is not any single negative factor, but several risks that could otherwise be absorbed separately happening at the same time. Treat the period before November 3 as an event window that warrants close attention, not as a predetermined market turning point. Going forward, watch oil prices, interest rates and earnings. The data will show where the market ultimately goes.