Square
Following
Hot
News
Profile
Share your thoughts
placeholder
Article
$CHIP Conclusion first: Short-term outlook is bullish, but it has entered an overbought acceleration phase, so the risk of chasing highs is greater than that of buying a pullback.
Technical breakdown. In terms of the moving-average structure, MA5=0.053732 has risen above MA20=0.052802, with the short- and medium-term moving averages aligned bullishly and the trend direction clearly upward. However, the current price of 0.0588 has deviated significantly from MA5, with the deviation exceeding 9%, representing a typical accelerated rally pattern. This means short-term momentum is strong, but the
post-image
CHIP+27.04%
ETH+1.12%
FET+5.77%
$XLM WE ARE HERE
post-image
XLM+2.17%
A coin does 30x. Months later, the hype is gone—and so are the users.
‍
post-image
What kills a project's staying power?
Token Unlocks
Weak Token Value
Fading Users
Depends on the Order
1 Participants
Ends In 3 Day
$SOL Potential scenario: It looks like this for Solana SHORT
The chart clearly shows that the five wave sequence has completed. and price may now be entering an ABC correction.
I’m watching for a potential corrective structure developing into either a Flat or a Zigzag.
Key levels
115–116 — potential resistance / retest zone.
1- scenario 103 - Fibonacci 0.382 area
2- scenario 88–90 — Fibonacci 0.618 zone potential downside target
post-image
SOL+0.89%
$DOGE bounced from the buy zone. Next test is a 3-wave push into the falling trendline around $0.092.
Fail that retest and the bounce dies. Hold the low and the bullish path stays in play.
post-image
DOGE+1.74%
$INJ GET READY FOR HARD SEND
post-image
INJ+9.73%
crypto trade today
live-cover
LIVE406
What does one get by paying 2000 $USDC for a pair of @papertrade_xyz trousers 🤔
post-image
USDC0.00%
What #memecoin has the strongest community?
Shill me👇
post-image
MEME+3.99%
Found this at the end of a trail.
You’re welcome
post-image
Market update
live-cover
LIVE62
GN CT 🌃
Why @termix_ai deserves attention.
Completed jobs give agents a track record people can actually check, making it easier to separate those who deliver from those who only make claims.
Over time, that record could matter more than any introduction an agent gives itself.
Lights out. See you all tomorrow 💤
post-image
CT-3.95%
#CRCLLeadsCryptoStocks
Saturday night prep ☕ US stocks are closed until Monday, so this is the perfect time to look at Friday’s tape without the noise. Crypto stocks bounced hard, and instead of cheering, I’m filling in my Monday prep sheet: what I know, what I don’t, and what I’ll do for each outcome.
What I know (verified numbers)
Circle closed Friday at $84.51, up about 4.5%. Coinbase rose about 5.5% and Strategy about 1.9%
Mizuho moved its Circle target to $100, which is about 18% above Friday’s close
The day before, Circle had fallen about 4.6% to the low $80s, so the Friday bounce broug
post-image
CRCL+4.57%
MSTR+1.72%
BTC+0.61%
$KAS KASUSDT: one push to 0.043, a retest, then 0.045663?
Kaspa bounced hard off the lows and is now leaning on the falling trendline, like someone knocking on a door it already broke once.
KAS technicals:
Price bounced from the 0.038000 area, the green zones under price held, and right now it sits at 0.041310. It is above the blue and red moving averages, and RSI has turned up into the 60s. The descending trendline from the top and the green MA sit right on top of price, with the red supply boxes from the breakdown just above. My base case is one more push into 0.043, then a retest from abo
post-image
KAS-1.52%
$INJ BOUNCE AND SEND
post-image
INJ+9.73%
#EthereumUpOver71%inQ3
ETH just had its best third quarter ever, up about 71%, ahead of the previous Q3 record of roughly 66.5% from 2025. And yet my daily chart shows ETH down more than 10% from its high. Both facts are true at the same time because they come from two different clocks. Let me read both.
Clock 1: the quarterly clock (the headline)
Up about 71% in Q3, the best on record for that quarter
Spot ETH ETFs took in about $3.1B of net inflows over the quarter, reversing the earlier outflows
A “profit supply” indicator (how much of ETH’s supply is sitting on a profit) moved out of the
post-image
ETH+1.12%
#FedSeptemberMinutesLeanHawkish Fed September Minutes Lean Hawkish: What It Could Mean for Markets
The release of the Federal Reserve’s September meeting minutes has drawn renewed attention from investors as policymakers appear to maintain a relatively cautious and hawkish stance toward monetary policy. The tone of the minutes is particularly important because markets closely watch the Federal Reserve’s assessment of inflation, employment, economic growth, and the appropriate path for interest rates.
A hawkish Federal Reserve generally indicates that policymakers remain concerned about inflati
post-image
BTC+0.61%
ETH+1.12%
GT+0.09%
Greed Index 64, but NIGHT’s funding rate has already climbed to +0.0050%—this is the most unusual detail in today’s market. Most people see the +10.86% gain and only think about chasing, overlooking that longs are paying to hold their positions, with sentiment already becoming crowded.
$NIGH Current price 0.05064, MA5=0.049268 has crossed above MA20=0.0483215, forming a bullish moving-average alignment—the first confirmation that the trend is healthy. But whether it remains healthy depends on the pullback: the price is currently near the Bollinger upper band at 0.0513038, RSI=68.9 has entered
post-image
NIGHT+8.70%
UNI+2.93%
QNT+0.04%
Worldcoin price flips bullish: Can WLD clear $0.61?
Worldcoin has rebounded above $0.51 after its sharp October sell-off, with WLD trading near $0.55 as the daily chart places the next major resistance around $0.61.
TradingView’s $WLD /USDT daily chart recorded Worldcoin at $0.5477 on Oct. 10, following a session high of $0.5761 and a low of $0.5037. The token was up 7.99% on the daily reading, although it had pulled back from its intraday peak.
The rebound followed a steep decline from an early-October high above $0.60. CoinGlass’s one-week liquidation heatmap traced a fall toward $0.46 late
WLD+13.92%
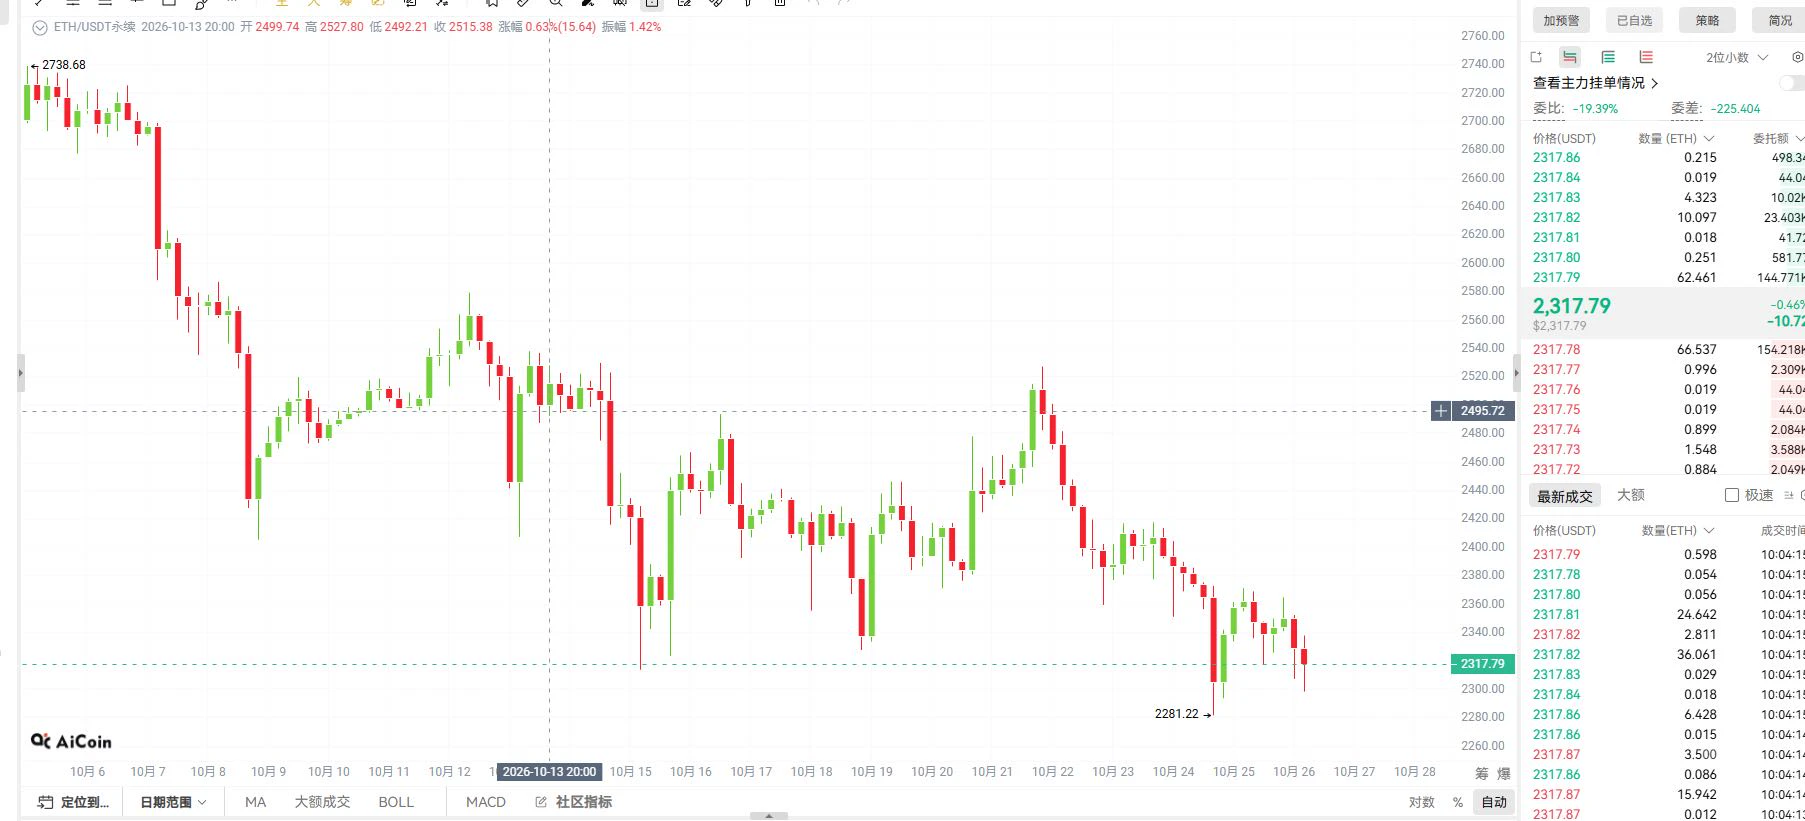
$2517.55 marks the ceiling of a razor-thin 24h spread. $ETH sits right below it at $2512.27 (+1.2%), bouncing off the $2474.34 floor. Range compression tests emotional control far more than rapid trend moves. When price coils inside a forty-three dollar pocket, traders get bored, size up, and revenge trade every small candle. That is how accounts blow up before real volume even hits. Watch how structure reacts to $2517.55 instead of anticipating the break. Practice this today: write down your max risk per trade before opening your platform, and refuse to click buy until your checklist clears.
post-image
ETH+1.12%
Load More

Join 40 M users in our growing community

⚡️ Join 40 M users in the crypto craze discussion

💬 Engage with your favorite top creators

👍 See what interests you

Trending Topics

GateAtTOKEN2049

39.7k Views21.53k Discussing

Gate brought a series of major events to TOKEN2049 Singapore! From the official launch of Gate Money to the F1 Red Bull driver meet-and-greet and the Gate Gala, we witnessed a new chapter of "One Gate, Borderless Finance." Which moment from TOKEN2049 stood out most to you?

LedgerLossesNear90Million

39.06k Views199 Discussing

GateWCTCS9GlobalTradingCompetition

33.57k Views4.88k Discussing

View More