
Share your thoughts
placeholder
Article
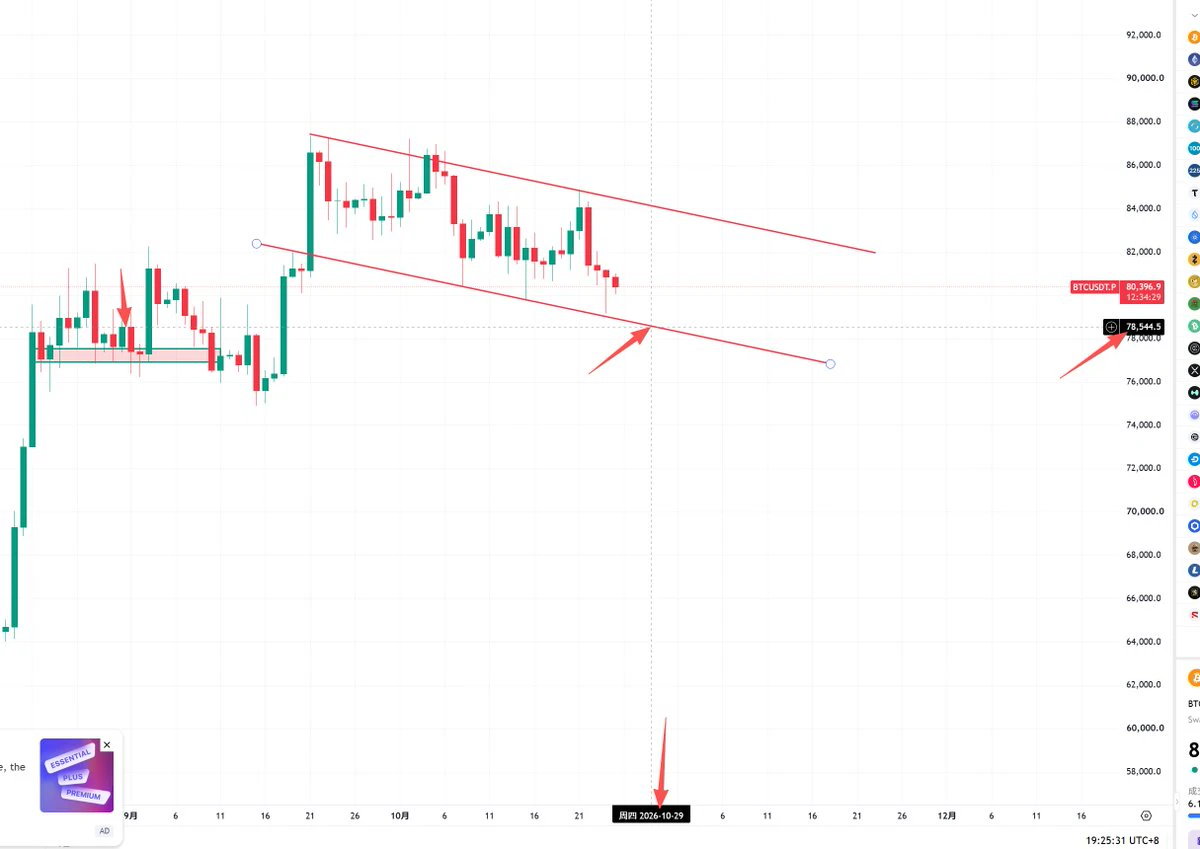
BTC found support and rebounded near 78,600, but why shouldn’t we rush to say it has turned stronger before reclaiming 79,500?
After retreating from around 80,000 over the past two days, BTC found buying support near 78,600 and has now moved back above 79,000.
Seeing the rebound, many people’s first reaction is: the pullback is over, and the market is about to move higher again.
But the easiest thing to misread today is equating a “rebound after finding a floor” directly with a “structural recovery.”
From the one-hour structure, the fact that 78,600 has held for now shows there is buying inter
post-image
BTC-1.06%
  • 2
I was just about to close the position and curse the market when it turned around and dropped my jaw. While everyone else was running, I kept watching the chart, thinking, what’s the point of cutting losses at a level like this? The pullback held, support was there, so I followed the plan and went long, taking a shot.

The entry price was 1.3845. I opened a long without hesitation and immediately chose a direction. Many people were saying it would keep falling, but I couldn’t be bothered to argue. The chart doesn’t lie, and the price speaks for itself.

Now $XRP has climbed to 1.3995, with
post-image
XRP-1.20%
DOGE+0.72%
BTC-1.06%
Nobody is talking about the quiet setup forming in $XAG /USDT right now.

$XAG /USDT - SHORT

Trade Plan:
Entry: 66.25 – 66.37
SL: 66.88
TP1: 65.88
TP2: 65.60
TP3: 65.17

Why this setup?
Why now? The 1h price is sitting at 66.31, the exact entry_ref for a short, inside a tight 1h ATR of 0.237301 that screams low-volatility compression. The 15m RSI reading of 52.06 shows balanced momentum, but the daily trend is range, which often resolves with a directional break. The entry zone between 66.25 and 66.37 offers a precise trigger, with TP1 at 65.88 and TP2 at 65.60 as the first two targets on
XAG+0.14%
Nobody is talking about the quiet SYMBOL move that has ripe shorts positioned right now

$MU /USDT - SHORT

Trade Plan:
Entry: 1029.64 – 1031.68
SL: 1040.46
TP1: 1023.31
TP2: 1018.41
TP3: 1011.06

Why this setup?


Debate:
Are we testing TP2 at 1018.41 or is the range about to trap the shorts with a fake move back above 1031.68?

⚠️ Personal market analysis only. NFA — manage risk and DYOR.
Educational content, not investment advice or a recommendation to buy, sell, deposit, or withdraw any asset. No paid promotion or referral/affiliate links.
MU+2.04%
hot Topics only
live-cover
LIVE1,874
🚀 The yen just soared to a six-month high! 📈 Speculation around BOJ interest rates is shaking up the currency market. How will this impact your crypto positions? $JPY $USD #Forex
I didn’t expect it to survive, but it directly brought the trade back to breakeven. That was some seriously good service. During the overnight sell-off, $ETH plunged and the screen was awash in green, but I watched the market and noticed that volume hadn’t followed—the selling momentum was weakening. At a level like this, going long offers decent risk-reward, so I went long, betting on an oversold recovery.

It really delivered: entered at 1883.20, and it has now risen to 2493.63, with +5636.01% already realized and credited. The market gave us the answer. Nailed it.

I took profit on 80% f
post-image
ETH-0.78%
SNDK+1.34%
ADA-1.03%
ETH is currently trading at 2486.85 USDT, down approximately 0.9% over the past 24 hours, marking a mild pullback after high-level oscillation. Short-term moving averages are capping the price while medium- and long-term moving averages are providing support; funding rates are nearly zero, with no imbalance between longs and shorts, and directional momentum is insufficient. Moderate net inflows into spot ETFs are providing some support, with short-term trading expected to remain range-bound. #Gate闲钱宝自动生息享3%年化
post-image
ETH-0.89%
Insiders are quietly fading the bounce on SYMBOL while range-bound charts hide a bigger move.

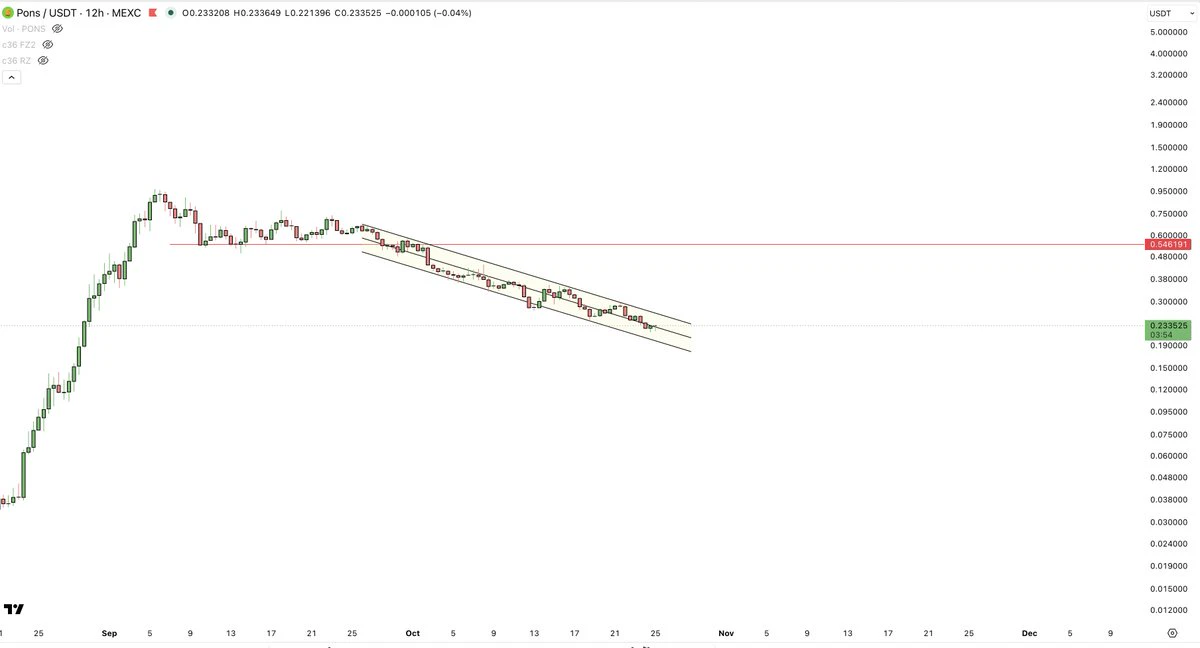
$PONS /USDT - SHORT

Trade Plan:
Entry: N/A – N/A
SL: N/A
TP1: N/A
TP2: N/A
TP3: N/A

Why this setup?
Why now? The 1d trend is range, which means price is coiling and a directional break is overdue. The 15m RSI sits at 57.04, showing mild bullish exhaustion rather than conviction, so fading upside makes sense. The 1h ATR is unavailable, meaning current hourly volatility is quiet and a sudden expansion could catch overextended longs off guard. The entry zone is anchored at 0.7236, a precise level w
PONS-13.01%
>driving 1 mile to pick up groceries
>google maps:
post-image
The short-term market is under significant pressure. After repeatedly testing the key resistance zone overhead, the price retreated due to selling pressure, indicating strong supply-side suppression and substantial resistance to a bullish breakout.
The price continues to trade below the short-term moving averages, which are exerting downward pressure, while multiple technical indicators are collectively bearish. The volume-price structure has weakened, with insufficient trading volume during rebounds and a lack of sustained capital support. Rebounds lack follow-through and are mostly brief tec
post-image
I had just switched the app to the background, and it shot right back up—are you playing hide-and-seek with me?

But don’t get me wrong, I’m watching the show from a short position. In that last glance before bed, I noticed that $IN ’s price action was quite subtle: trading volume kept shrinking, yet the price was still stubbornly holding up instead of falling. This kind of low-volume rebound is inherently suspicious. No volume means no conviction, and without conviction, don’t expect capital to carry you higher.

Sure enough, after today’s opening, the rebound was weak, with each upward push
post-image
IN-0.97%
BNB-1.44%
ETH-0.78%
$SNDK /USDT is about to break range and most traders are not ready

$SNDK /USDT - SHORT

Trade Plan:
Entry: 1784.55 – 1788.17
SL: 1803.77
TP1: 1773.30
TP2: 1764.59
TP3: 1751.53

Why this setup?
Why now? The 1h price is 1786.11, sitting inside the entry zone between 1784.55 and 1788.17, which means the setup is live and waiting for a trigger. The 15m RSI at 45.48 shows neither overbought nor oversold, so momentum is balanced but leans bearish for the short bias. The 1h ATR of 7.255354 tells us the average candle range, giving a realistic idea of how far price can move in an hour. The daily t
SNDK+1.34%
$GT Founded in 2013, Gate.io is a leading global cryptocurrency exchange with 22 million users, and has long ranked among the top three worldwide in trading volume and liquidity. Gate.io currently ranks second globally in 24-hour spot trading volume and supports spot trading, futures contracts, leveraged trading, and financial products for more than 3,800 cryptocurrencies. The platform provides diversified digital asset trading and blockchain application-related services. Its total reserves exceed $10 billion, ranking fourth globally, with a total reserve ratio as high as 128.58%. It also use
GT+2.94%
a-meme-coin:native wow 😮
0x385f4f8ae47651ce5f58f5265395a669f8281e18
post-image
MEME+1.42%
Also a sequel.
The Liquid white hat returned 3,400 BTC, keeping 598.5 as a finder fee (about 15%). The Blockstream node has been patched, but the bridge remains paused.
A $320 million story, with a 15% closing fee.
How much more would you dare deposit into the sidechain federation? (9/8)
#Bitcoin #Liquid
post-image
BTC-1.12%
This little bit of red has me panicking—I keep feeling like it’ll come to its senses tomorrow and kick me out. 😅

When I opened the chart this morning, $BR was still hovering around 0.21096, with buying quietly strengthening and volume returning. After moving sideways at the bottom for so long, there was only one conclusion: it was building momentum, not crashing, so I went long directly without hesitation. ⚡

I just refreshed the page, and the current price is 0.27187, with gains of +568.92%. Unrealized gains are only paper profits, so take profit when it’s time to go.

I’ve also finishe
post-image
BR+15.65%
ADA-1.03%
LAB-2.01%
This entry point was not perfect; I tried a long at the area where the price tested the low for a second time on the $UAI hourly chart. The moving averages had not fully turned yet, so I could only use a tight stop-loss in exchange for room for profits later.

After entry, the price action was very sticky. Several rallies were pushed back, making it look as though the trend was weakening. But the key levels during each pullback never broke below the key reference level at entry, so I chose to reduce my trading frequency and let the position run.

Only after the key level above was broken did
post-image
UAI+19.89%
ETH-0.78%
LAB-2.01%
Crypto Market and Trading Insights
live-cover
LIVE1,539
A few days ago, I was still calculating whether I had enough money for instant noodles this month; this morning, I was already wondering whether to add a sausage.
A few days ago, I took one last look at the chart before bed. $LIT pulled back on declining volume, with the price repeatedly hovering around 1.117. The bottom consolidation was exceptionally clean. I knew then that once this structure started moving, the pace would be extremely fast.
When I opened the chart this morning, it immediately surged on heavy volume. The current price has already reached 4.733, and anyone who followed is up
post-image
LIT+6.30%
SOL-1.91%
BTC-1.06%
Load More

Join 40 M users in our growing community

⚡️ Join 40 M users in the crypto craze discussion

💬 Engage with your favorite top creators

👍 See what interests you

View More