
Square
Following
Hot
News
Notifications
Profile
Share your thoughts
placeholder
Article
Was this photo taken well?🌇
post-image
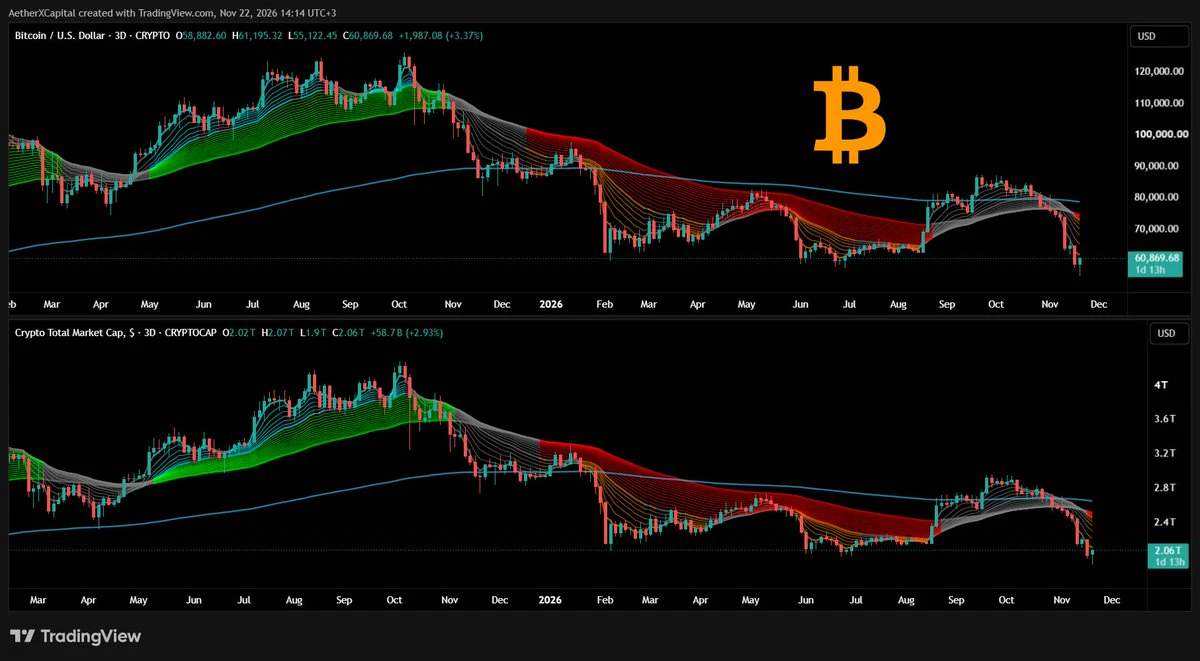
The SuperGuppy indicator has turned bearish on $BTC and TOTAL on the 3-day time frame.
It's one of those indicators that can't be ignored even if it points out something you don't want.
post-image
BTC-0.67%
Trenches
IDOL
I
bade
b
IDOL
0x3b...ab07
Market Cap
$.
Change
.
24h Vol
$.
Holders
.
JAGENT
J
bade
b
JAGENT
0x8e...ae15
Market Cap
$.
Change
.
24h Vol
$.
Holders
.
PIEVERSE
P
bade
b
PIEVERSE
0x0e...25a9
Market Cap
$.
Change
.
24h Vol
$.
Holders
.
CLAUDIA
C
bade
b
CLAUDIA
2j5S...W2ZM
Market Cap
$.
Change
.
24h Vol
$.
Holders
.
mihao
m
bade
b
mihao
4Cxj...pump
Market Cap
$.
Change
.
24h Vol
$.
Holders
.
#GoldNears3500 $XAUUSD ‌
Navigating the Overextended Gold Market from Macro to Micro"

The current market presents a classic paradox: price action is heavily overextended, yet momentum remains tantalizing. Trading on the 4-hour and 1-hour charts right now is not about chasing the trend, but about understanding why the market is stretched. We are looking at a scenario where retail traders are caught in the crossfire of institutional liquidity hunting. This analysis breaks down the structural mapping of Gold (XAUUSD), analyzing the flow from a monthly macro perspective down to the 1-hour execu
XAUUSD-2.40%
  • 3
  • 1
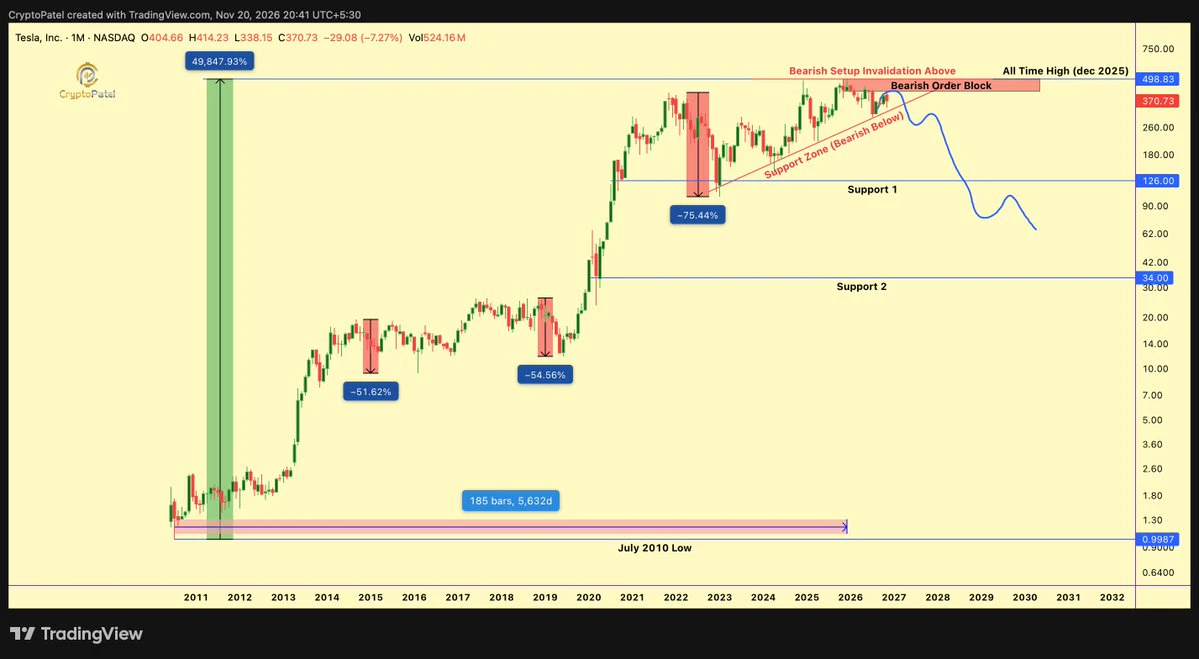
$TSLA (Tesla): Can it fall from $374 to $100–$150?
Tesla is building some very interesting businesses, but its current stock valuation is a different story.
I went through its latest financials, cash flow, business growth and 5-year valuation.
Here are my main findings.
1️⃣ At around $374, Tesla has a market cap of approximately $1.48T against $103.6B in trailing revenue.
That's roughly 14x annual sales and more than 400x trailing earnings.
A lot of future growth is already priced in.
2️⃣ Tesla's core business is still automotive, but energy storage is becoming increasingly important.
In the f
post-image
TSLA-7.56%
BTC Falls below 60k
live-cover
LIVE1,220
BTC-0.67%
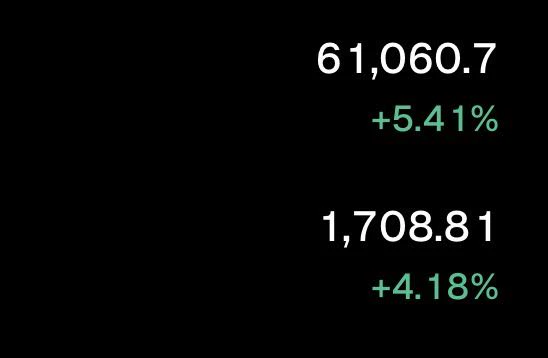
With the current price above 61,000, you can trim the staggered long positions entered near the lows of 55,000–56,500 that Lao Ji gave. Keep a protected core position and continue looking higher.

The next target is around 62,500. If it breaks above 62,000, keep holding!
post-image
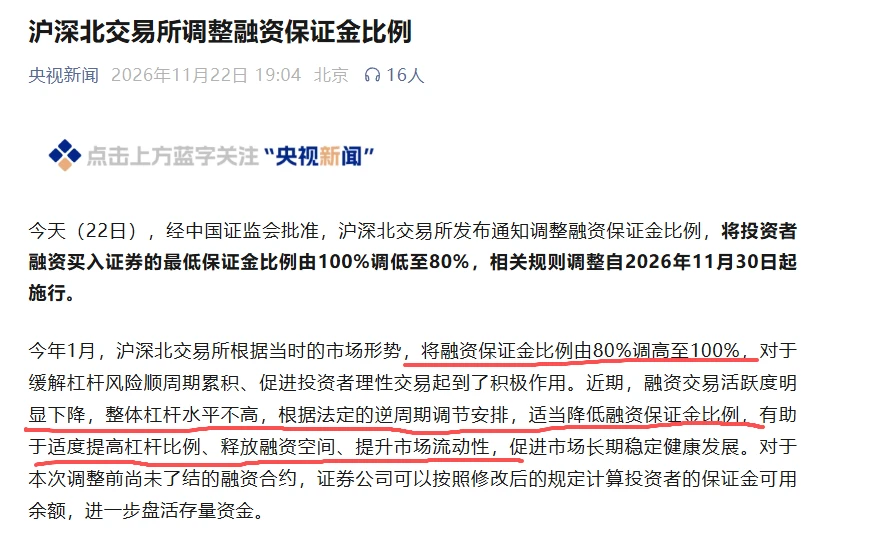
It looks like liquidity is drying up globally, and domestically too.
The Shanghai, Shenzhen, and Beijing stock exchanges have all lowered margin requirements, suggesting trading has also slowed considerably.
post-image
Guys, click the link here to help me out. Thanks, bros!
Join Gate’s 2026 Annual Glory Gala and sign up to get 100 support points to vote for your favorite Star of the Year. For every 100 support points contributed, you’ll get 1 chance to win a surprise prize. https://www.gate.com/zh/competition/Annual-Gala?ref_type=165&ch=Direct&ref=VLJAUG1WBA
post-image
Reverse robbery: Web3Auth itself withdrew $5.6 million from its own users 🕵️‍♂️💸
#bitcoin #trading #crypto #indicators #cryptocurrency #web3auth #keplr #cryptonews
post-image
BTC-0.67%
#ShareWeekly #Arbitrum #WCTCS9

The cryptocurrency market often focuses on Bitcoin prices, Ethereum movements, and the performance of major altcoins. However, I believe some of the most important developments happen behind the scenes, particularly in the movement of stablecoin liquidity across blockchain networks. Arbitrum One has recently delivered an impressive signal in this area, recording a $327.4 million increase in stablecoin circulating market capitalization over just seven days.

According to data disclosed by Arbitrum through Token Terminal, this growth placed Arbitrum One ahead of
ARB+1.17%
BTC-0.67%
ETH-1.26%
ARC-4.26%
APT-1.51%
At 9:42, that wick plunged to 2.8340, and I stared at the screen for more than ten seconds. $PIEVERSE It’s now at 4.9480, up 65.75% in 24 hours, with 274.2M in trading volume. That kind of volume doesn’t come from retail traders piling in.
I have four rules. Just follow them.
First, check whether this rally has left behind a staircase. The test: along the path from the low to now, are the pullback lows getting higher each time, and are there any gaps? A gap means it’s a spike, not a structure.
Second, see how long it holds near the highs. The test: after touching 5.0800, does it grind sideway
PIEVERSE+0.58%
  • 2
#PCEAndGDPDataNextWeek: How Will Macroeconomic Data Affect Gold and Cryptocurrencies

Important macroeconomic data due next week are likely to determine the next moves across major markets. The US will release October personal income and outlays data, as well as the second estimate of third-quarter GDP, on November 25 at 13:30 (UTC). These inflation and economic growth figures are crucial to understanding the interest rate outlook, especially after the recent sell-off.

On the XAUT/USDT daily chart, gold is currently trading near 3,531. Technical indicators show a clear downtrend. The price is
NVDAG-0.24%
XAUT+0.30%
BTC-0.67%
$PI This Youlong lost even his underwear. He's running around naked now. He used to be on Kuaishou livestreams. Crying and whining, unable to take a loss. This is the project he invested in
post-image
PI-0.60%
  • 6
Another pleasant weekend is about to end. Just thinking about the market opening again tomorrow instantly takes away half the relaxation. Open this latest liquidation heatmap: before the market opens tomorrow, the big players’ playbook is already laid out in plain sight. Don’t charge in foolishly!

$BTC The current price is 59750, stuck awkwardly in the middle. Looking up, the green glow around 61000 is glaring—short positions are lined up there. But look further down: between 58500 and 59000, long positions are piled up as thick as a fortress wall. What does that mean? The big players have pl
BTC-0.65%
ETH-1.23%
SOL-0.74%
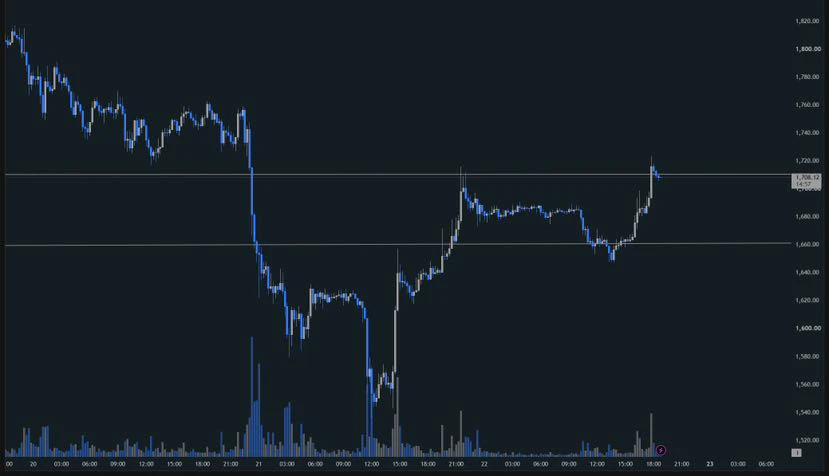
$ETH This rebound is actually worth discussing

The price bottomed at 1536 over the weekend, then rebounded steadily and climbed back above 1700. On price action alone, it looks pretty good

But I’m more focused on the E/B exchange rate:

It’s still hovering around 0.028. While it hasn’t continued to break below key levels along with the broader market, it also hasn’t made any particularly clear independent move higher;

Meanwhile, ETH contract open interest is still significantly lower than it was a few days ago

That’s interesting: the price has recovered quickly, but leveraged funds haven’t
post-image
ETH-1.26%
  • 1
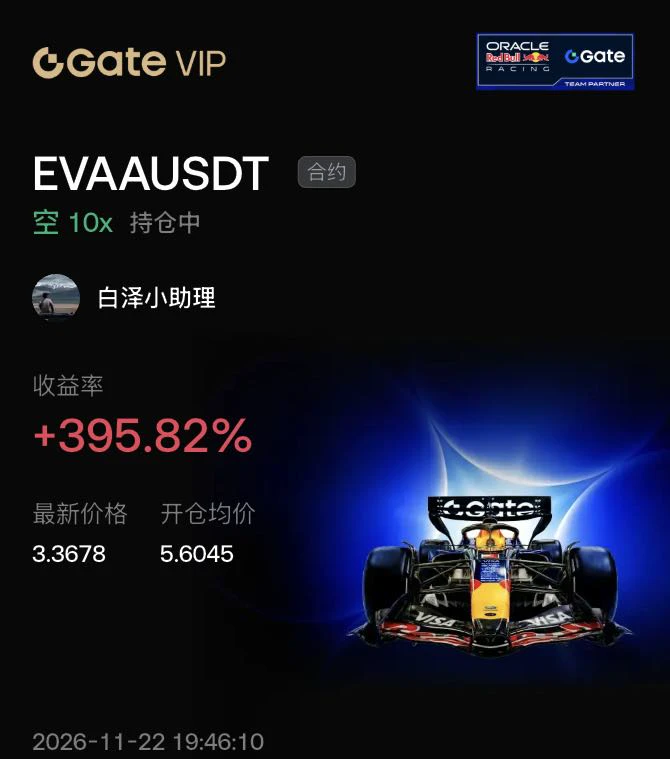
$EVAA I went through all the messages, and the project team never announced any bad news. There was no new announcement before the drop, either. The analysis platform gave just one reason: the rally got too overheated, so a pullback was inevitable.

Technical indicators were stretched to the limit early this morning: the 14-period Relative Strength Index was 91, Williams %R was -10, and the stochastic oscillator was 94—all in overbought territory; the upper Bollinger Band was 6.31, and the price was trading above it.

In crypto, readings like these mean one thing: buyers have run out, leaving
post-image
EVAA-0.42%
BTC-0.65%
  • 2
Market Update
live-cover
LIVE3,334
BTC-0.67%
$AKE After the funding rate turned negative and then positive again, are longs starting to pay?
In-depth analysis: Around the time AKE peaked at 0.0096765, longs briefly pushed the funding rate higher, signaling crowded long sentiment. When the rate fell from its high and turned negative, it meant longs had started paying shorts and funding sentiment had reversed. I opened a short during the settlement period when the rate turned negative and used 25x leverage to capture the entire decline after the shift in funding. $EVAA $ETH
AKE+6.39%
EVAA-0.42%
ETH-1.23%
  • 1
$ETH The ETF is the most direct force behind Ethereum’s drop.

On November 20, U.S. spot Ethereum ETFs saw net outflows of about $101 million, their second-largest since these products launched. BlackRock alone saw $93.7 million flow out; from the 16th through the 20th, outflows continued for five straight days, totaling $220 million for the week.

Ethereum ETFs are relatively small to begin with, so these outflows have a bigger impact on the price than people might expect. ETH fell 16% in a week and 34.5% in a month, with selling pressure coming mainly from ETF outflows.

Institutions moving
ETH-1.23%
BTC-0.65%
  • 1
Load More

Join 40 M users in our growing community

⚡️ Join 40 M users in the crypto craze discussion

💬 Engage with your favorite top creators

👍 See what interests you

Trending Topics

BTCReboundFaces60KTest

2.1M Views30.1K Discussing

BTC rebounded from around $55,300 on November 21, briefly reclaiming $60,000 before pulling back to around $59,300. The $60K level is back in focus as traders assess whether the recovery can last. Is this rebound a sign of stabilization or a short-lived recovery? Would reclaiming and holding $60K be enough, or do you need confirmation from trading volume and fund flows?

PCEAndGDPDataNextWeek

259.2K Views2.6K Discussing

GateDirectIPOPhase3ANTAllocates92100Shares

831.8K Views5K Discussing

View More