Square
Following
Hot
News
Profile
Share your thoughts
placeholder
Article
Retail sales increased, but don’t rush to pop the champagne over consumer spending. Gasoline also counts as a purchase, and higher fuel prices can inflate the report just as easily.
The U.S. September retail sales report released last night at 20:30 Taiwan time on 10/15 showed a 0.8% month-over-month increase. Sales at gas stations rose 6.4%; excluding gas stations, overall sales increased only 0.2%. This data is not adjusted for price changes, so the 0.8% figure cannot be treated directly as an increase in the volume of consumption.
The PPI released at the same time rose 1.3% month over month
post-image
Added to the long position on $ZEC
. Trading parameters: Entry: 1,199.22 - 1,214.56Target 1: 1,260.38Target 2: 1,303.17Stop-loss: 1,163.24ZEC is taking a brief breather at support, then preparing to return to Valhalla. Buy the dip! Try this trade here. $AKE and $ETH are worth watching today.
post-image
ZEC+7.42%
AKE+19.19%
ETH+0.70%
Layout: Bitcoin, Ethereum, Dogecoin
live-cover
LIVE880
  • 4
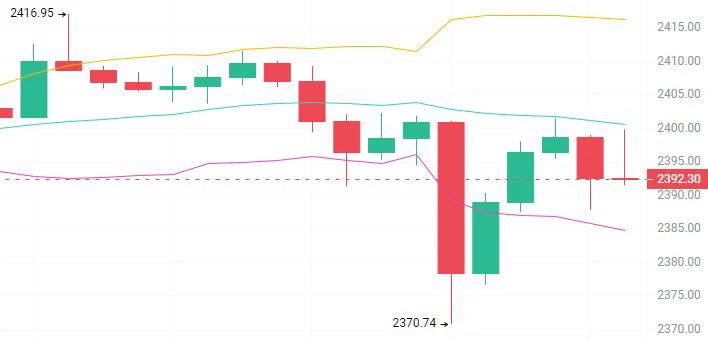
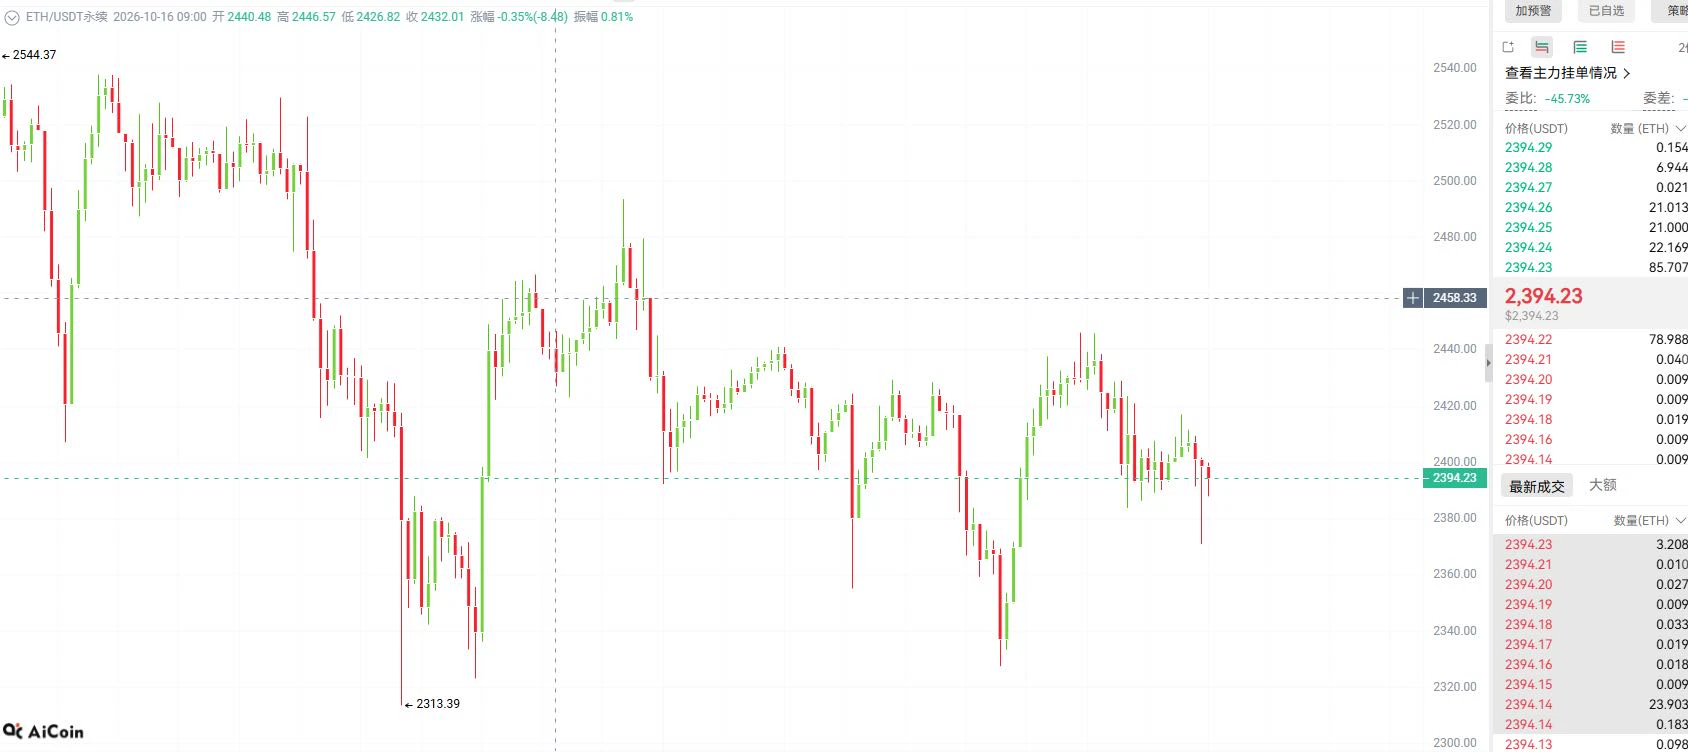
At 10 a.m. yesterday, Ether crashed to 2318 before recovering—I know what you’re hesitating about: it’s not that you’re bearish on it, you’re just worried this drop isn’t over yet.
The Time Lord sees this move as the end of a three-wave decline—in other words, the C wave.
The daily chart’s yearly moving average is around 2355. Yesterday’s wick pierced below it before recovering—the volume was 1.3 times that of the previous few days, so this wasn’t a drop with nobody stepping in.
The 2411 level we mentioned last time broke, and this is where it went next. He placed orders lower, with his stop-l
post-image
ETH+0.70%
If one CAT20 token is burned, will the sats carrying it disappear too?
When I looked at the official CAT20 materials from OP_CAT Layer, I found another potentially misleading detail about Burn: the burned tokens will terminate the lineage relationship inherited from the genesis transaction.
But the sats in the original UTXO remain and can be transferred to an ordinary non-covenant address, losing their original CAT20 token properties. The official term for this process is uncolored.
Put simply, the token label is removed from the sats, but the sats themselves do not disappear out of thin air.
post-image
10/16 Intraday Strategy: Negative News Priced In, Oversold Rebound, Middle East Risks, Grid Shorting at Highs
The market digests all information. Both positive and negative news will be priced in, and often over-prices it, producing extremely euphoric or extremely panic-driven moves. A “safe zone” emerges after this “over-pricing,” creating both risks and opportunities.
After the PPI data was released last night, it came in above expectations. The market fell briefly before rebounding sharply, with ETH rising from 2,322 to 2,467, a gain of 145 points. The reason was that “the negative news had
ETH+0.66%
🛢️ Zulia produces more than 350,000 barrels per day: will the dollar and USDT P2P market get some relief?
Watch out: more crude oil does not automatically mean more foreign currency on the streets, and USDT may rise at the same time. We explain.
👉
#P2P #USDTVES #Venezuela
post-image
#BTC跌破8.2万
#BTCBreaksBelow82K
BITCOIN RECLAIMS $82,000: IS THE RECOVERY REAL, OR WILL SELLERS PUSH BTC BACK TOWARD $80,000?
My Original BTC Market Analysis | October 16, 2026
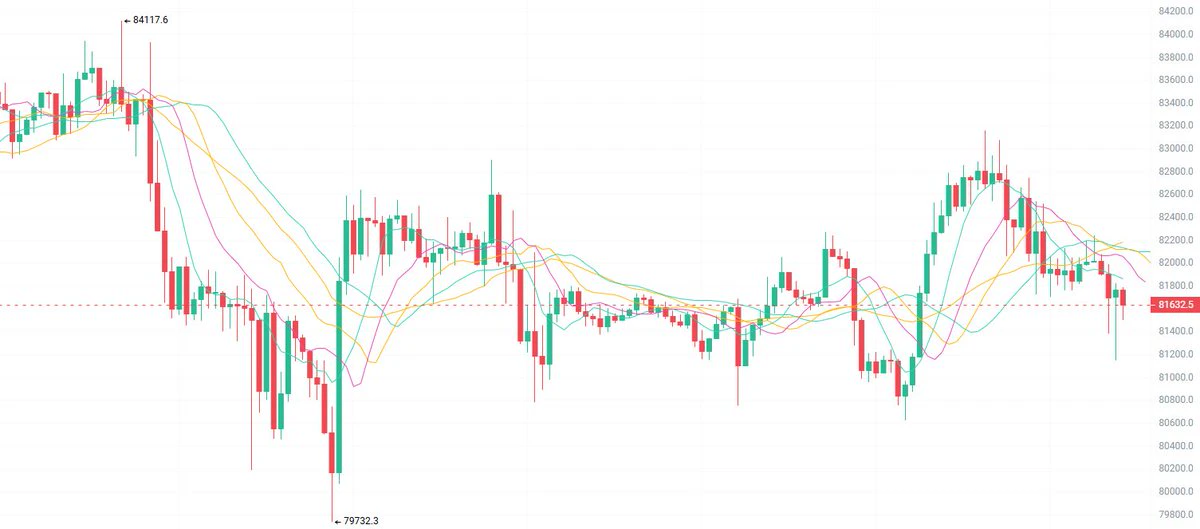
Bitcoin is back above $82,000 after touching a 24-hour low below $80,000. This recovery brings a new question to the market: are buyers finally stepping in, or is this only a temporary bounce within a broader correction?
According to the latest price figures provided, BTC is trading at $82,343.3, with a 24-hour low of $79,795.0 and a high of $82,650.5. The market has recovered from a significant intraday decline, but th
post-image
BTC+0.72%
  • 1
Someone asked me: Did last night’s needle finally bottom out?
$MU I’m not guessing; I’m just repeating what I saw
21:00 A single candle crashed to 860.33, with the heaviest volume among the 48 candles
(That pile of orders was swept away, not sold)
22:00 A bullish candle filled half the hole back in
At 4 a.m., it touched 934.56 and bounced without much delay
Now at 914.96, just 1.5% above the 20-day moving average at 901.467
Further up is 965.72, left behind the day before yesterday
A bottom isn’t guessed; it’s defended
If 901.467 can’t hold, that needle to 860.33 was for nothing
Only after rec
post-image
MU+1.89%
$INJ Short setup… price is testing a strong resistance zone
INJ has risen sharply from around 7.05 to the 8.50–8.56 resistance zone. This rebound is strong, but this is exactly where I would stop chasing longs. Short entry: 8.30–8.60 (filled) Next target price: 8.20Take-profit 1: 8.00Take-profit 2: 7.80Final target: 7.65Stop-loss: 9.00
After the rapid rebound, the move is beginning to look somewhat overstretched, while the price is currently below resistance. If buyers fail to break through 8.56 effectively, I expect the price to first pull back toward 8.20 for a test, followed by a possible f
post-image
INJ+12.45%
( new streamer) market overview
live-cover
LIVE1,506
#USSeptemberPPIBeatsExpectations Which sector is most worth positioning for?🔮 Which sector is most worth positioning for?🔮 Which sector is most worth positioning for?🔮 Which sector is most worth positioning for?🔮 Which sector is most worth positioning for?🔮 Which sector is most worth positioning for?🔮 Which sector is most worth positioning for?🔮 Which sector is most worth positioning for?🔮 Which sector is most worth positioning for?🔮 Which sector is most worth positioning for?🔮 Which sector is most worth positioning for?🔮 Which sector is most worth positioning for?🔮 Which sector is
AI
Next Fable Model (5.2+) released by...?
December 31
99%1.01x
October 31
88%1.14x
$57.86K 24H+10 more
Why is everyone suddenly quiet about STRK right before a massive move?

$STRK /USDT - LONG

Trade Plan:
Entry: 0.08544 – 0.08784
SL: 0.07510
TP1: 0.09530
TP2: 0.10107
TP3: 0.10973

Why this setup?
Why now? The daily trend is bullish and the 1h price is holding at 0.08668, giving us a high-confidence long setup. The 15m RSI sits at 48.79, meaning there is room to run before overbought territory. The 1h ATR of 0.00481 shows the market is active enough to push through the entry zone near 0.08664. We target TP1 at 0.09530 and TP2 at 0.10107, with the trade invalidated if price breaks 0.07603. T
post-image
STRK+13.00%
If you lost money in this token, you probably deserved it.
post-image
TOKEN+1.18%
$PYTH What is most interesting right now is not guessing whether prices will rise or fall, but seeing who is forced to change their tune first.
The bulls' test is at 0.10094, while the bears' test is at 0.08063. $PYTH is currently at 0.09293, up 8.79% over 24 hours. One-hour support is 0.08063, resistance is 0.10094, and current volume is 0.21 times the average volume of the past 20 candles.
First, I note that after $PYTH's sharp 24-hour rise, momentum and continuation are not the same thing, because I do not extrapolate an already completed large move into the next leg; I first look at whethe
post-image
PYTH+9.83%
😭 Justin San is second only to Satoshi Nakamoto?
Arkham linked with the founder TRON crypto wallets with assets worth $2.25 billion in 10 different blockchains,  putting San in second place (after the creator of Bitcoin — Satoshi Nakamoto) in terms of crypto assets.
#TRON $TRX ‌
post-image
TRX+0.33%
Spam 🤷🏻‍♂️😁
post-image
$HYPE HYPE: Bullish Structure Faces Another Important Test
HYPE has pulled back sharply from its September all-time high at $97.99, with the subsequent rally failing at $95.22. Price has retraced almost 50% of its August–September advance, weakening short-term momentum.
The 100/50-day EMAs remain bullishly crossed, suggesting the broader recovery has not broken down. However, price is below the 100-day EMA and trading between the two averages.
HYPE is approaching the significant $75–$77 support zone, which has attracted buyers several times over the last four months. The 50-day EMA and 0.5 Fib
post-image
HYPE+1.35%
#JapanAndKoreaStocksPlunge 🚨 Japan and Korea Stocks Plunge: Global Markets Face Fresh Pressure! 📉🌏
Global financial markets are experiencing renewed uncertainty as Japan and South Korea's stock markets suffer a sharp sell-off, highlighting growing concerns about inflation, interest rates, and the sustainability of the artificial intelligence investment boom.
On October 15, South Korea's KOSPI plunged approximately 7.6%, closing at 5,554.22, while Japan's Nikkei 225 fell nearly 5% during the session. Semiconductor companies and technology stocks faced particularly heavy selling pressure. 🇯�
Load More

Join 40 M users in our growing community

⚡️ Join 40 M users in the crypto craze discussion

💬 Engage with your favorite top creators

👍 See what interests you

Trending Topics

USSeptemberPPIBeatsExpectations

91.35k Views1.89k Discussing

US September PPI came in at 6.3% YoY, well above the 5.3% market expectation, pointing to renewed producer-side inflation pressure. Weekly jobless claims were 199K, broadly in line with forecasts. Could hotter inflation further reduce room for rate cuts, and what does it mean for $BTC, US stocks, and gold?

DrLinHanSpeaksAtOxfordUnion

135.63k Views1.86k Discussing

JapanAndKoreaStocksPlunge

47.27k Views1.76k Discussing

View More