
Share your thoughts
placeholder
Article
The year-end Bitcoin target price given by major global financial institutions and top AI models has reached $95,000–$150,000 per coin, while Ethereum’s target is $3,175–$4,500 per coin; patiently hold spot #BTC收复8万美元
TradingKingGaoYuliang
Core Logical Reasoning
Driver 1: Macroeconomic Monetary Environment (the Biggest Short-Term Variable)
• Current Headwind: The probability of a rate hike in September has risen to 62%, while the rate cut previously expected by the market has yet to materialize. The Fed’s dot plot shows rates at around 3.25%–3.40% by the end of 2026, but CME FedWatch pricing puts the probability of a rate cut this year below 10%.
• Key Timing: The September FOMC meeting (mid-to-late September) is the short-term watershed moment. If a rate hike is implemented, BTC could fall to $72,000–$75,000 in the short term; if the Fed unexpectedly pauses, the Q4 rally could begin immediately.
• Powell’s Term: His term expires in May 2026. Changes in the Fed’s leadership will bring policy uncertainty, but the market has gradually priced this in.
Driver 2: ETF Fund Flows (Structural Support)
• Pressure in the First Half: Spot BTC ETFs saw monthly net outflows of $4.06 billion in June, the largest redemption record since their launch, directly causing BTC to fall from $110,000+ to the July low of $59,000.
• A Turning Point in August: Over the past 60 days, Bitcoin whales have accumulated approximately $2.75 billion, while ETFs turned back to net inflows in late August (exceeding $1 billion in a single week). Exchange balances continue to decline, with investors shifting to cold storage, indicating that selling pressure is drying up.
• Solid Cumulative Base: Cumulative net inflows into spot BTC ETFs remain at approximately $55 billion, with total assets under management of around $109 billion. This is the biggest difference between this cycle and previous ones—institutional capital is already in the market rather than waiting on the sidelines.
Driver 3: Cycle Position (Deeply Corrected)
• BTC’s maximum decline in the first half of 2026 was approximately 30% (from $111,000 at the beginning of the year to $59,000 in July), and its current price of $80,000 is in the middle of a rebound.
• Historically, in post-halving cycles (the April 2024 halving), the second Q4 often sees a second wave of gains due to reduced miner selling pressure and an institutional allocation window.
• However, it should be noted that this cycle is more institutionalized, so volatility may be smoothed out, making a repeat of the multi-fold gains seen in 2021 unlikely.
Driver 4: Ethereum’s Independent Logic
• ETH/BTC Exchange Rate: Currently around 0.031, it is in a historically low range. If risk appetite recovers in Q4, ETH typically has greater upside elasticity.
• Stablecoins and Tokenization: Standard Chartered raised its year-end ETH target from $4,000 in June to $7,500, primarily because the growth in network utility driven by stablecoin issuance and asset tokenization has not yet been reflected in the price.
• Yield Characteristics: ETH staking provides an annualized yield of approximately 3%–4%, making ETH more attractive than BTC as an “interest-bearing asset” in a falling-rate environment.
• Risk: Spot ETH ETF inflows remain consistently weaker than those of BTC. If this trend continues, ETH may continue to underperform.
IV. Key Indicators to Watch (Tracked Over the Next 3 Months)
1. September FOMC Decision: Rate hike vs. pause will determine the direction of Q4’s opening
2. Weekly Net Inflows into Spot BTC ETFs: Three consecutive weeks of positive inflows = confirmation of a bottom
3. Whether BTC Can Hold Above $85,000: This is the 200-day moving average level; holding above it would open up room toward $100,000
4. ETH/BTC Exchange Rate: A break above 0.035 = a signal that ETH is beginning to outperform
5. U.S. Inflation Data: If CPI continues to decline, rate-cut expectations will heat up again#美国8月非农超预期
BTC+0.31%
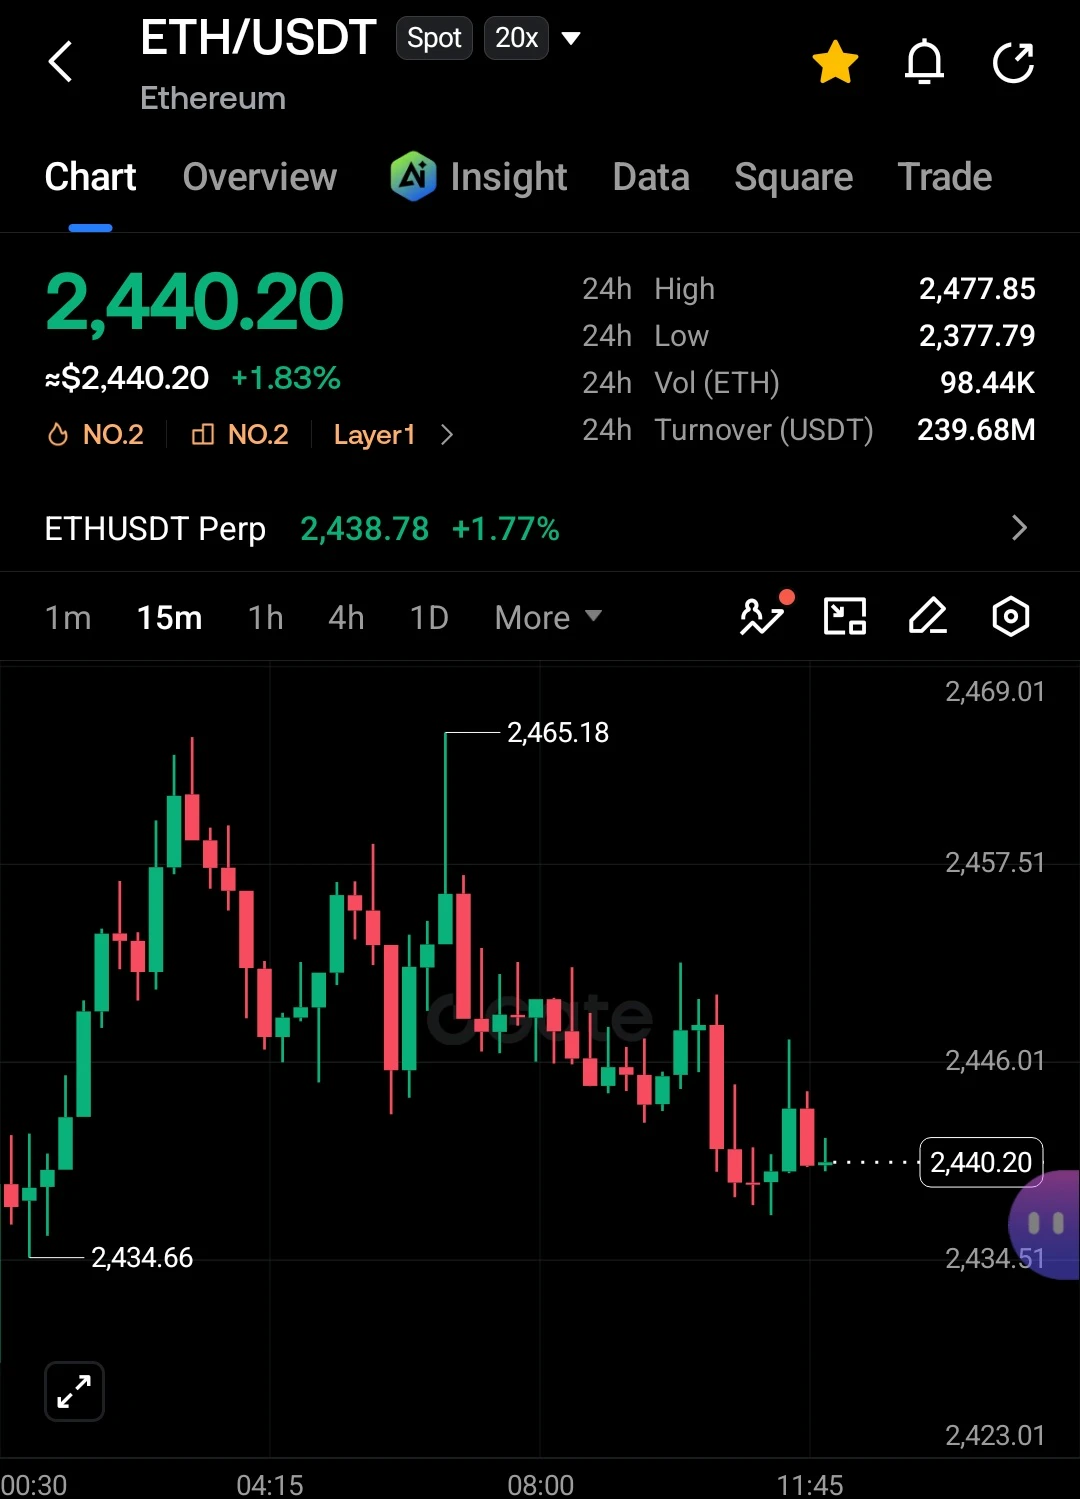
ETH+1.73%
#Gate事件合约晒单挑战
The is a great opportunity for traders to turn their market views into clear, engaging, and shareable trading ideas. Event contracts bring a unique perspective to trading because they focus on specific outcomes and require participants to think carefully about probability, timing, market sentiment, and the information that could influence an event.
What makes this challenge exciting is that every trade has a story behind it. Instead of simply sharing an entry, participants can explain why they chose a particular contract, what information shaped their view, and which factors co
$FLOCK #FLOCK / USDT - 0.07259 (+33.44%)
Live Data: 0.07259 | 24h High 0.08200 / Low 0.05092 / Vol 129.09M / Turnover 8.50M | EMA5: 0.07136 | EMA10 0.06557 | EMA30: 0.05292 | MFI: 90.07 | Today +18.11% | 7d +108.29% | 30d +156.59% | 1y -75.04%
Market Overview
The token moved from 0.03011 on Aug 26 to 0.07259, representing significant price appreciation over the last 10 days. The 30-day performance remains strong, while the 1-year performance reflects a broader historical decline.
Technical Snapshot
EMA5 (0.07136) remains above EMA10 (0.06557), while EMA10 stays above EMA30 (0.05292), indic
post-image
FLOCK+33.18%
  • 5
  • 1
[New Streamer]Whales Move in Sync!
live-cover
LIVE2,127
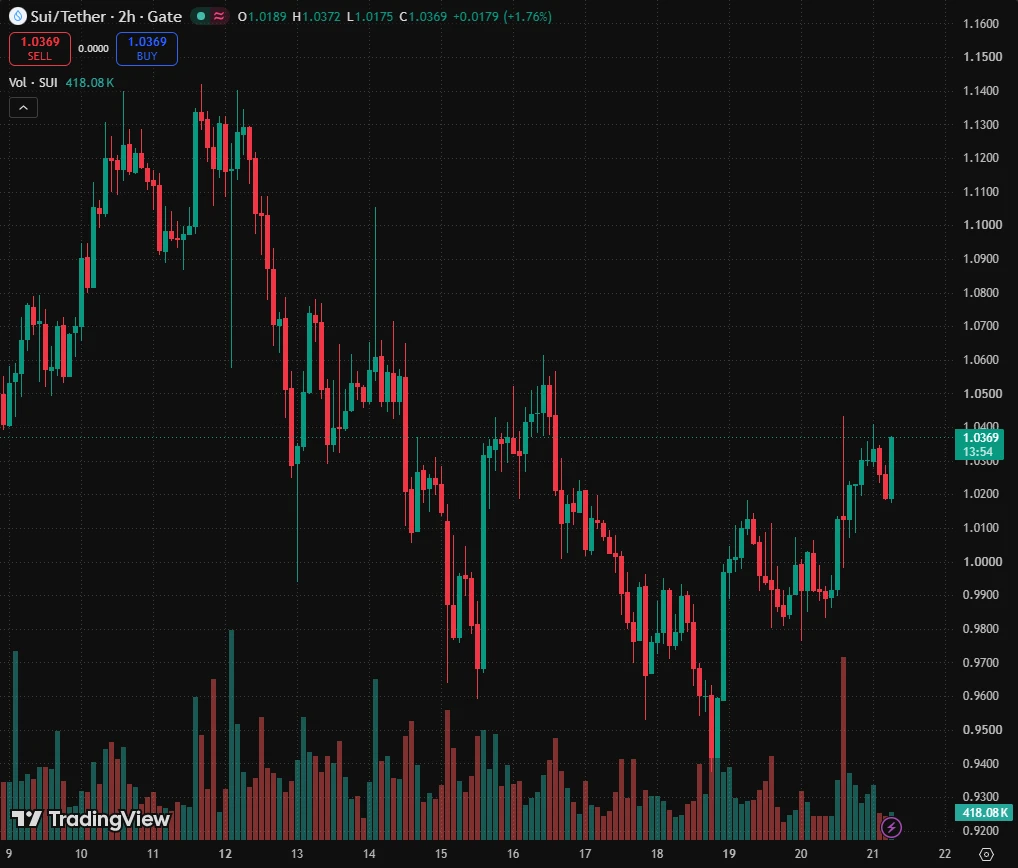
This profit has me feeling both thrilled and apprehensive, worried the market might come to its senses tomorrow and blacklist me. Just after lunch, while checking the charts, $SUI retested 0.7362 and held firm, with selling pressure clearly easing. I felt this trade had potential, so I went long with the trend.

Then it shot up in the afternoon, with the current price at 0.8004. The +418.95% profit on paper is already ready to enjoy. I can treat myself to a good meal. For a position you’re not confident in, taking a look is clear-headed, but buying in is foolish. Still, I’m holding this move
post-image
SUI-0.20%
BTC+0.33%
SNDK+2.05%
Everyone’s staring at ADA’s recovery—but the 4h chart just whispered a secret that contradicts the crowd.

$ADA /USDT - SHORT

Trade Plan:
Entry: 0.2202 – 0.2214
SL: 0.2265
TP1: 0.2166
TP2: 0.2137
TP3: 0.2095

Why this setup?
- 1D trend is *range*, but our 4h bias flips SHORT at 55% conviction—not a strong sell, but a tactical fade.
- RSI 15m at 58.31 shows a dead-cat bounce losing steam right under our entry zone (0.2208).
- ATR 1h (0.002357) is tight—meaning the next leg down (TP1 0.2166) is closer than the upside trap (alt TP1 0.2250).
- Why now? Price is “Waiting” at resistance—th
ADA+2.22%
Layout for Bitcoin, Ethereum, and Dogecoin
live-cover
LIVE3,291
  • 1
indeed #zcash and #chainlink are fundamentally strong.
#gate #crypto #stocks
ZEC+15.70%
LINK+4.62%
09.06 Evening Market Outlook: BTC/ETH 1-Hour Cycle
The 1-hour Bollinger Bands are converging after widening. After spiking to a high, the market quickly pulled back, followed by a range-bound rebound and recovery. ETH surged to 2547.47 before falling back, then rebounded again to test overhead resistance; BTC surged to 82258 before pulling back and entering a range-bound recovery. Trading volume has contracted significantly compared with the surge, while the two MACD lines have turned upward. This is a corrective recovery and consolidation, without a new one-sided trend emerging. The overall l
BTC+0.31%
ETH+1.73%
Everyone’s watching the 1H RSI—but the 15M just flashed 63.6. That’s your tell before SNDK drops.

SNDK/USDT - SHORT

Trade Plan:
Entry: 1789.47 – 1793.59
SL: 1811.33
TP1: 1776.68
TP2: 1766.78
TP3: 1751.92

Why this setup?
Why now?
- The 4H bias is SHORT, but the 1D is stuck in a range—so this is a scalp, not a trend.
- Entry at 1791.53 sits right under rejection; TP1 at 1776.68 is only 0.8% away, offering a fast 1:1.8 risk-reward before the daily range caps upside.
- Don’t chase the long—the 15M RSI is overheated, and ATR (8.25) means volatility is tight enough to snap back to mean.
SNDK+2.05%
Everyone’s staring at gold, but the real trap is silver’s 4H ceiling—$XAG /USDT just armed a short at 66.28.

$XAG /USDT - SHORT

Trade Plan:
Entry: 66.26 – 66.30
SL: 66.47
TP1: 66.13
TP2: 66.04
TP3: 65.89

Why this setup?
- Why now? Price is pinned at 66.28 with RSI (15m) at 49.93—no momentum to break higher.
- 1D trend is *range*, not breakout. That means resistance holds until proven otherwise.
- ATR (1h) is 0.08—tight coils snap fast. Target TP2 at 66.04 is just 0.36% away, but SL at 66.47 caps risk at 0.29%.
- The math favors the short: 2.2R to TP2, but only 0.6R to invalidation
XAG+0.05%
$XMR Signal】Go long + snipe with buying support
$XMR The order book's buy-side depth is 2.25 times the sell-side pressure, with the price at 539.32 approaching the 1H Bollinger lower band at 535.85. The 1H MACD histogram at -2.60 continues to weaken, while the 4H MACD histogram at +0.46 shows shrinking bullish momentum. The funding rate is relatively high at 0.0876%, OI is stable, and leveraged longs face interest payment pressure. 1H momentum is bearish, while 4H momentum is bullish. The price is below the 1H EMA20 at 546.49 and above the 4H EMA20 at 534.47, with the range narrowing.
🎯Direc
post-image
XMR-0.44%
BTC+0.31%
ETH+1.73%
SOL+4.00%
Everyone’s chasing the next 100x—but ESPORTS just flashed a signal that quietly kills leveraged longs.

$ESPORTS /USDT - SHORT

Trade Plan:
Entry: 0.01460 – 0.01466
SL: 0.01496
TP1: 0.01438
TP2: 0.01421
TP3: 0.01396

Why this setup?
- 4h bias is SHORT with 95% confidence—that’s not a whisper, that’s a scream.
- Daily trend: bearish. The 1D structure is already bowing down; we’re just riding the follow-through.
- Entry zone locked at 0.01463, with TP1 at 0.01438 and TP2 at 0.01421—that’s a clean 3% drop before you even blink.
- RSI on 15m sits at 45, still room to fall before hitting o
ESPORTS-1.48%
Could it reach 3.6?? #METIS.
Everyone, please don't chase, because I'm in profit.
post-image
METIS+20.50%
This house attracts romantic luck—where is it located?
post-image
【$RAYSOL Signal】Long | 4H MACD bullish expansion
$RAYSOL RSI 4H 79.52, buying demand gap.
4H MACD bullish momentum is expanding, while the 1H red bars are shortening, indicating insufficient short-term follow-through. Order book depth imbalance: -7.90%; the share of aggressive buyers is declining. OI is stable, with the funding rate at -0.0128%; shorts have not retreated.
🎯Direction: Long
⚡Entry/Limit order: 1.131495 - 1.134900
🛑Stop-loss: 1.078155
🚀Target 1: 1.220017
🚀Target 2: 1.262576
🛡️Trade management:
- Execution strategy: After reaching Target 1, reduce the position by 50% and move
post-image
BTC+0.31%
ETH+1.73%
SOL+4.00%
Load More

Join 40 M users in our growing community

⚡️ Join 40 M users in the crypto craze discussion

💬 Engage with your favorite top creators

👍 See what interests you

View More