Square
Following
Hot
News
Profile
Share your thoughts
placeholder
Article
first day calling on @Pumpfun
bullish tek!
post-image
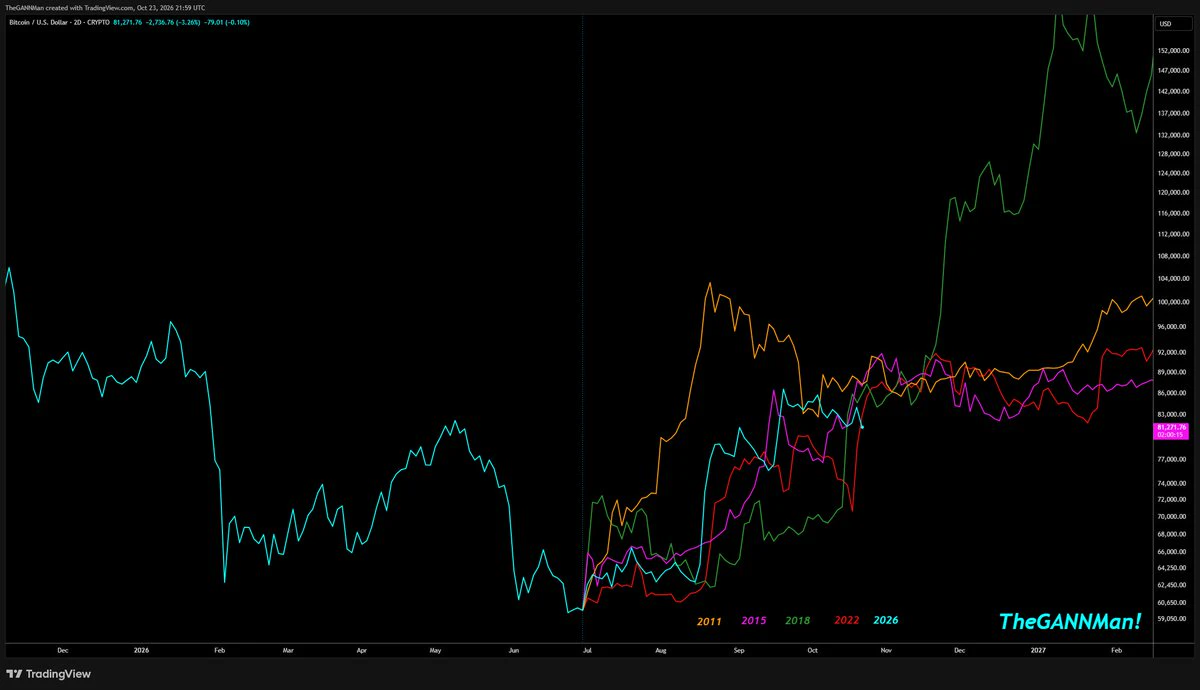
October 16 $BTC Strategy: Based on the current market, BTC's upward movement is being blocked by the 84200 resistance level. We continue to expect a pullback in the near term, but the decline has not been deep.
Do not rush to buy the dip. Open short positions in the 83500-84000 range, with a stop loss at 84500 (the starting point of the decline on October 7). If a solid bearish candle continues to break below 81800, keep the stop loss at breakeven.
Wait for a new low to appear. Reduce short positions in the 79200-78000 range and look for an opportunity to enter long positions.
post-image
BTC+0.47%
#Bitcoin Golden Cross loading.
You know what this means...
post-image
BTC+0.46%
Some dinners aren’t about eating
but about having food to eat in the future #WorkplaceDinners
post-image
Layout: Bitcoin, Ethereum, Dogecoin
live-cover
LIVE880
  • 4
10.16 Gold $XAU Recent Strategy Gold has been moving sideways within this range since falling at the end of September, with 4220 on the upside and 4110 on the downside. We have gradually sold high and bought low several times here.
Here is what we are doing now: 1. Short-term strategy: go long at 4100, exit around 4200, with a hard stop-loss at 4020. 2. After playing a few short-term rounds, switch to a long-term position (you can choose PXAG due to the high weekend fees). The unchanged point for both long-term and short-term trades is going long at 4100 with a stop-loss at 4020; the only dif
post-image
XAU+1.54%
  • 1
Bitcoin Support and Resistance Levels
live-cover
LIVE103
$ICNT Up 21% in half a day, it surged straight from 0.1015 to 0.1371, with 13.7M in trading volume pouring in. That’s not the kind of volume retail investors can generate. I took a quick look on-chain just now: the top 10 addresses’ holding concentration hasn’t declined, indicating this move is not distribution but someone accumulating. On the macro side, here’s an anchor: during the week when the Fed minutes leaned hawkish, the 30-day correlation between altcoins and the Nasdaq surged to 0.78. Small-cap assets like ICNT have higher beta, so as long as rate-hike expectations don’t rebound, it
ICNT+23.50%
The more gold prices fall, the more aggressively China buys. From March to July, its purchases rose from 4.98 tons to 19.91 tons. This isn’t bottom-fishing; it’s welding a floor under gold prices. Ahead of the Fed decision, the market is already pricing in expectations. True liquidity providers only watch who is quietly absorbing the supply. Those holding gold should weigh this for themselves. If you have anything to add, see you in the comments.
post-image
GLDX+1.87%
PAXG+1.43%
Bitcoin Shakes Off Spooky Season Jitters: Can Bulls Keep It Going?
Bitcoin is trading at $83,591.79, up 2.24% on the day, after dipping to $80,953.41 earlier Tuesday. That low held about $588 above the $80,365.12 swing low that kicked off the bounce, a higher low that traders look for in an uptrend.
The Crypto Fear and Greed Index, a 0-to-100 sentiment gauge built from momentum, volatility, options positioning and social data, sits at 55 today, a neutral reading. It fell from an "extreme greed" peak of 82 on Aug. 26. The August euphoria is gone, but traders aren't panicking either.
⚠️ Personal
post-image
BTC+0.46%
  • 1
Bitcoin is BACK over $82,000!!
We are so back!!
post-image
BTC+0.46%
Honestly, there is still support below overall, and it has been holding above 82000, but I still couldn’t hold on. I’ll take profits first and redeploy later. 😁
post-image
$AAOI
The correction continues. If the index hadn’t made a liquidity sweep, the other path would have remained valid. Today, it pulled back to the monthly EMA21-$74. On the other hand, it has also dipped as far as the support band during previous corrections. I normally use the support band as my reference for trends anyway.
I still think it’s forming a handle here. There’s no topping structure like the one at the 2017 peak
post-image
AAOI-2.87%
INDEX-2.45%
$NEAR NEAR Breaks Out of a 4-Year Descending Channel: TP1: $11
NEARUSDT
Weekly Time Frame:
NEAR (1W, log scale) is breaking out of the descending channel that has defined price action since the 2022 top, and the weekly candle is now pushing above the upper boundary.
What the chart shows:
After the 2022 high (~20.6), price spent years in a descending channel, bottoming around the 0.9 area in early 2026.
Since that low, price has risen sharply and is now trading at ~5.4, above the channel’s upper trendline.
The breakout is happening at the 2024 volume profile POC (~5.2), so the trendline and a h
post-image
NEAR+10.47%
Careful, @crocat_x is an impersonator and most likely a rug!
Report.
The official crocat:native X is @CroCat_Token with CA 0x7Eb480c734eC5f6bd2B918F7393b59D59913DFFA
This is a good reminder as Cronos is getting more succesful, rugs and rats are also coming back.
Invest with eyes open, very easy to run in to these!
post-image
CRO+0.20%
are cats gonna end up trading better than pigs?
post-image
$NPC
There is no second best 🫡
20% bounce like nothing 🚀
@CryptoWizardd
post-image
NPC+8.73%
BTC is currently around 82400; after the previous pullback, it has staged a short-term corrective rebound, but the upside follow-through is weak. This is a technical recovery after the decline, with no trend reversal signal appearing for now. The broader structure remains range-bound with a bearish bias.

On the 4-hour chart, the price is below the moving averages, and rebound volume is insufficient, indicating a weak consolidative recovery. The overhead resistance zone is substantial. As long as the price fails to firmly hold above resistance, this rebound is more likely to be a continuation
post-image
BTC+0.47%
$LAES
A microcap stock in the quantum business. It held the Fibonacci support
post-image
LAES+3.21%
peak lighting on the streets of north kolkata
Load More

Join 40 M users in our growing community

⚡️ Join 40 M users in the crypto craze discussion

💬 Engage with your favorite top creators

👍 See what interests you

Trending Topics

USSeptemberPPIBeatsExpectations

91.35k Views1.88k Discussing

US September PPI came in at 6.3% YoY, well above the 5.3% market expectation, pointing to renewed producer-side inflation pressure. Weekly jobless claims were 199K, broadly in line with forecasts. Could hotter inflation further reduce room for rate cuts, and what does it mean for $BTC, US stocks, and gold?

DrLinHanSpeaksAtOxfordUnion

135.63k Views1.86k Discussing

JapanAndKoreaStocksPlunge

47.27k Views1.76k Discussing

View More