Share your thoughts
placeholder
Article
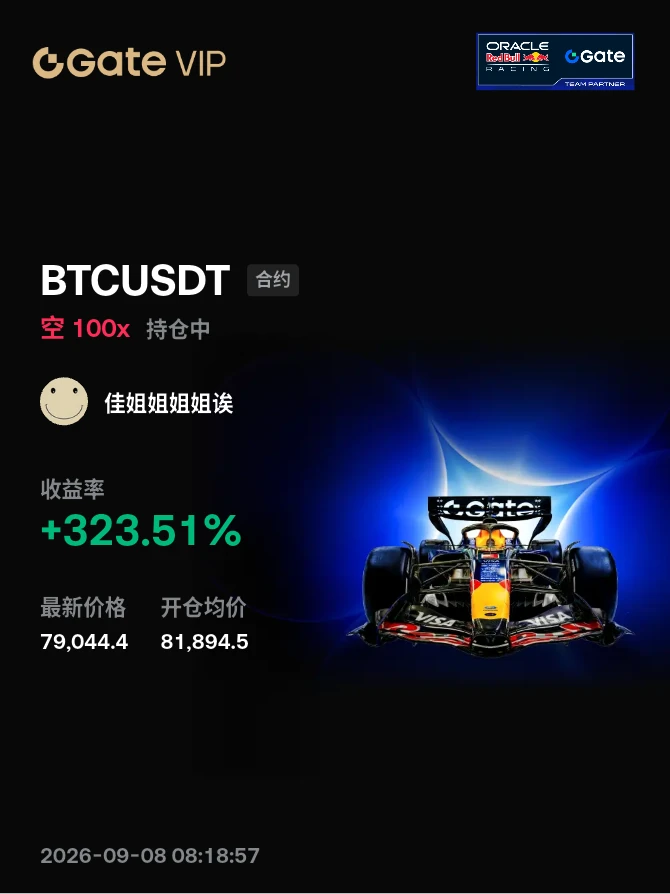
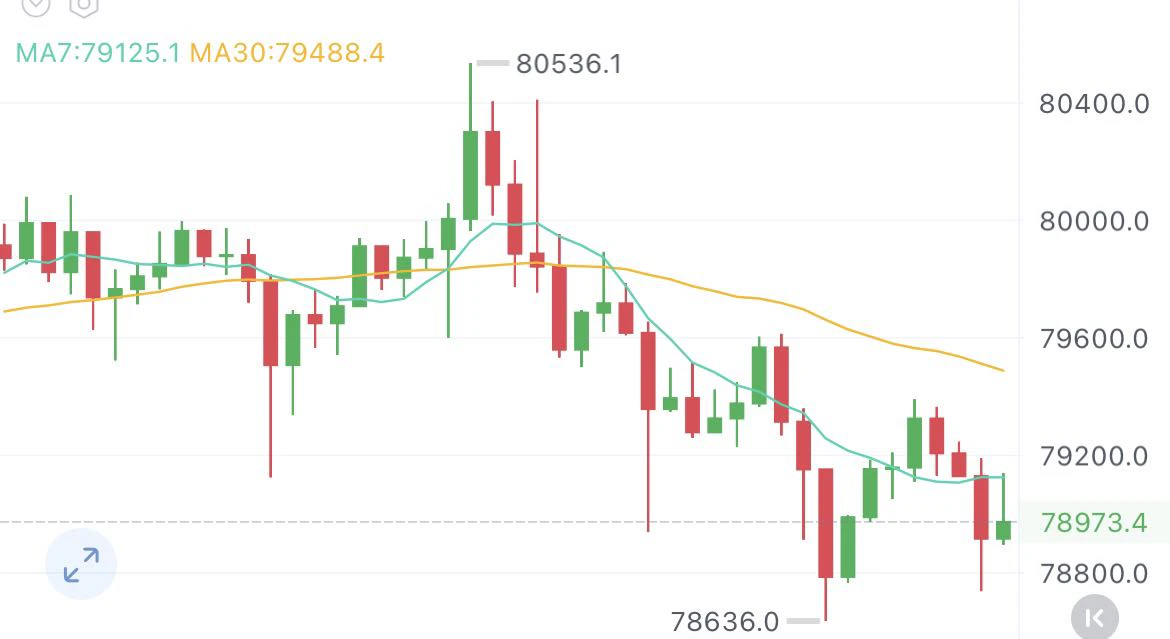
I’ve been holding this position, #晒出我的持仓收益 , for several days now... All I can say is that 79387.9 is an important level, while 78600 is an important OB. If it can’t hold, it will open up room for a pullback!!! The reason I’m holding is because I’m at a high level. Even if it retraces, I don’t mind.
post-image
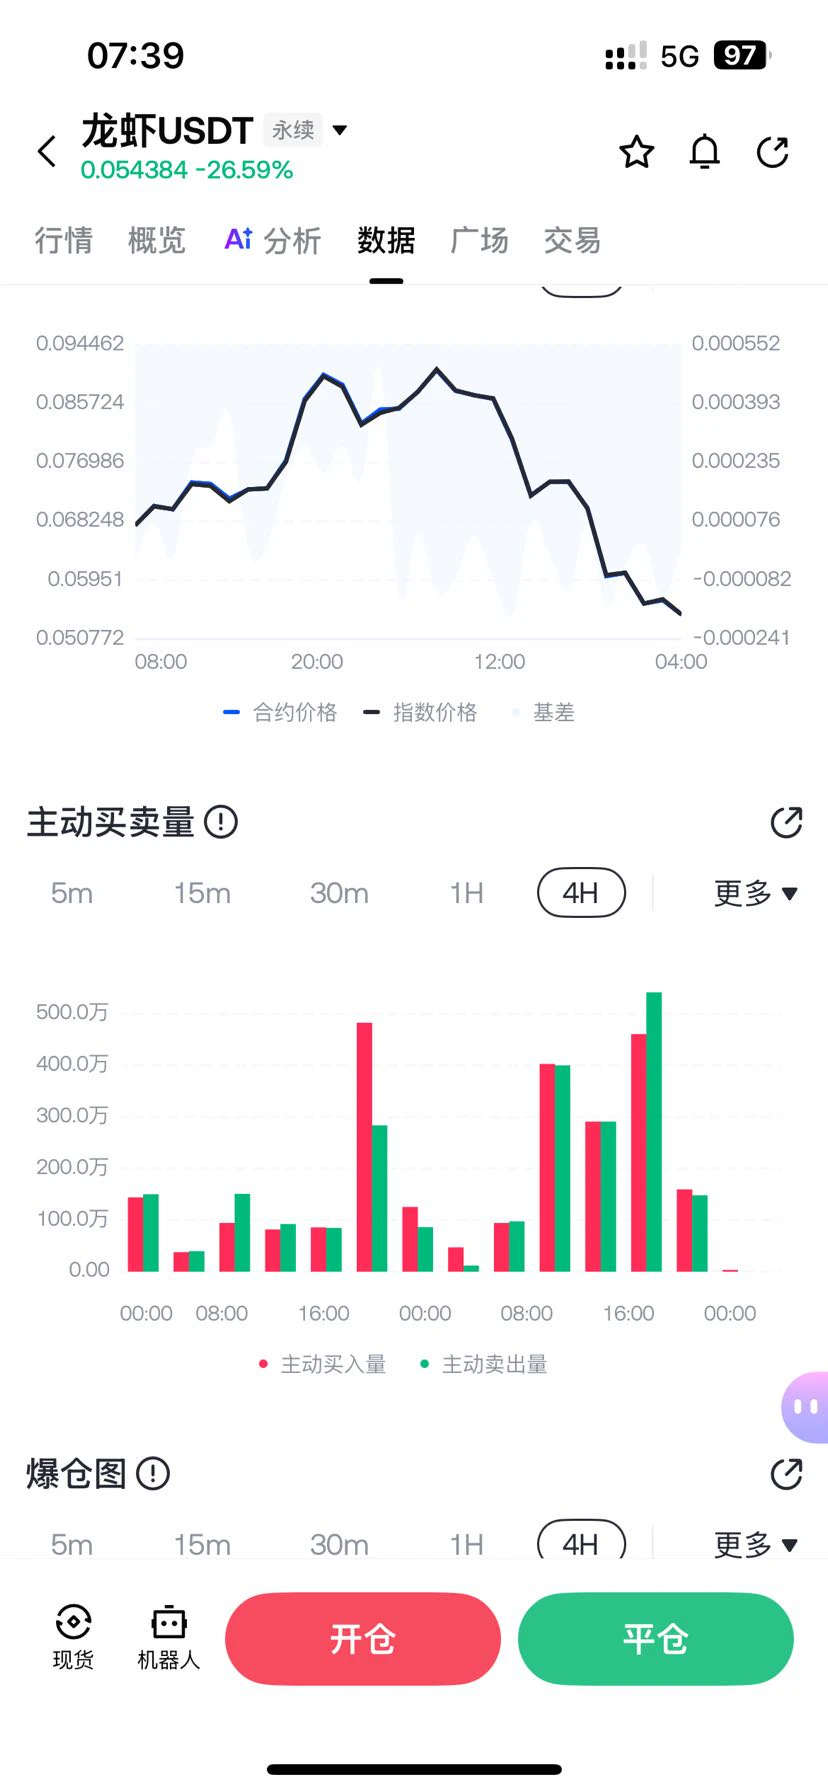
$Lobster Just a few million worth of selling pressure sent it crashing this badly; most likely, we’ll see it around 0.02.
post-image
龙虾-26.16%
  • 1
$Lobster fell 26.68% over 24 hours, yet its trading volume reached as high as $63.2 million. What does this data indicate? It indicates that bottom fishers are getting crushed more and more as the price falls, while the market makers are using liquidity to put on their final act for you. From the high of 0.0756 down to 0.0530, the trading range has exceeded 40%. This trend is not a shakeout but a classic distribution pattern. Catching a falling knife now means becoming a human ATM for smart money.
My trading advice is simple and blunt: 0.0544 is not the bottom. Watch 0.0480 for strong support;
龙虾-25.87%
JUST IN: Intel reportedly plans a 10% price hike for PC CPUs in early October, continuing a year of rising costs despite a slight PC market dip expected in 2027. Could pressure margins, potentially opening room for Arm-based rivals in IPC/edgeIoT. $INTC
post-image
INTC+4.52%
ARM+3.92%
9.08 ETH Analysis
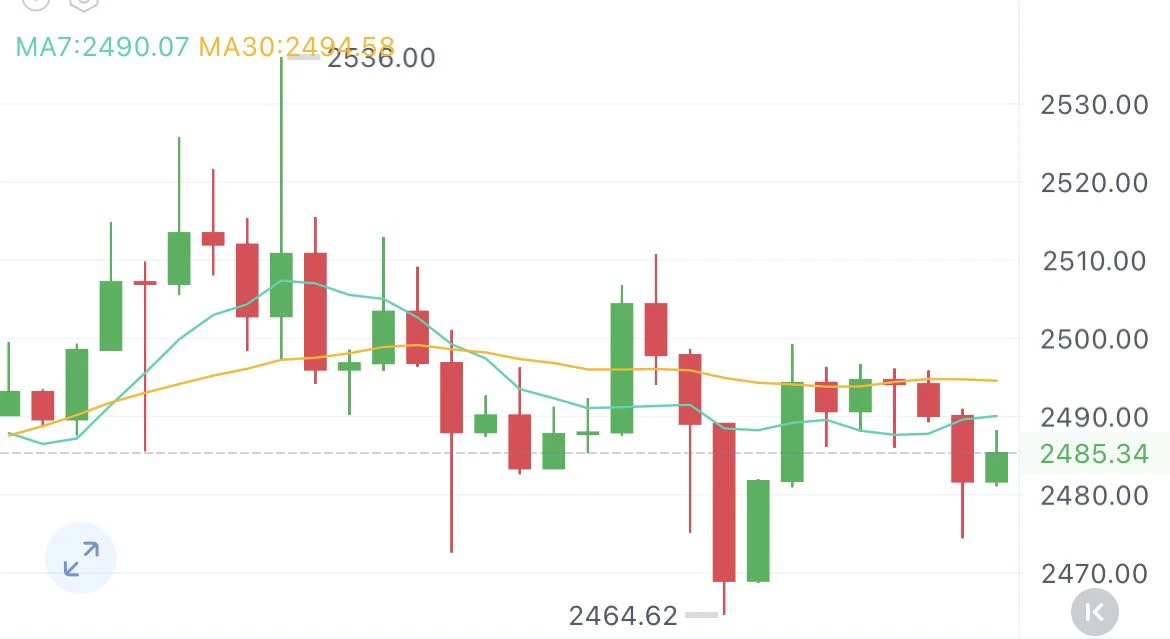
Analysis: Go long on a pullback to around 2450–2460, with defense at 2430; first target 2490, second target 2515
On the 1H ETH chart, the price came under pressure and pulled back after surging to the phase high of 2536.00, with the low reaching 2464.62. It is currently in a consolidation phase following the high-level pullback.
The short-term MA7 and MA30 are flattening and edging slightly downward. The price is trading below the moving averages, which are creating overhead resistance. After the continuous decline, bearish momentum is gradually being depleted. 2450–2460 is t
post-image
ETH-1.25%
I was just about to head to the forum to rant, but then I saw my balance and thought better of it—the market is always right. 😂
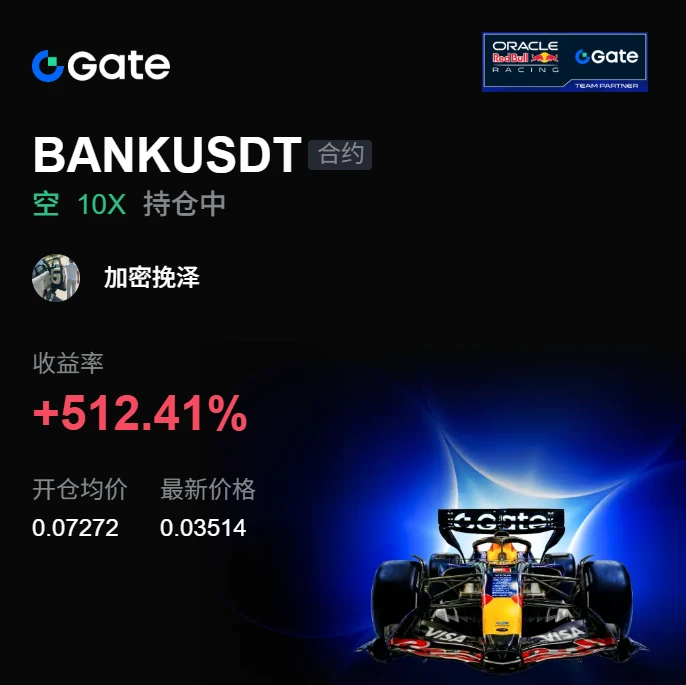
One last look before bed: $BANK was putting on a strong face around 0.07272, with the intraday chart full of tiny bullish candles. It looked lively, but the volume never really kept up. While everyone else was waiting for a breakout confirmation, I figured a low-volume surge like this wouldn't last three hours, so I placed a short order. My friends even said I was being too aggressive.
Overnight, the market did all the work by itself. The current price is 0.03514, an
post-image
BANK+0.09%
ETH-1.19%
ADA-1.79%
Insiders are quietly fading the bounce on SYMBOL while range-bound charts hide a bigger move.

$PONS /USDT - SHORT

Trade Plan:
Entry: N/A – N/A
SL: N/A
TP1: N/A
TP2: N/A
TP3: N/A

Why this setup?
Why now? The 1d trend is range, which means price is coiling and a directional break is overdue. The 15m RSI sits at 57.04, showing mild bullish exhaustion rather than conviction, so fading upside makes sense. The 1h ATR is unavailable, meaning current hourly volatility is quiet and a sudden expansion could catch overextended longs off guard. The entry zone is anchored at 0.7236, a precise level w
PONS-13.78%
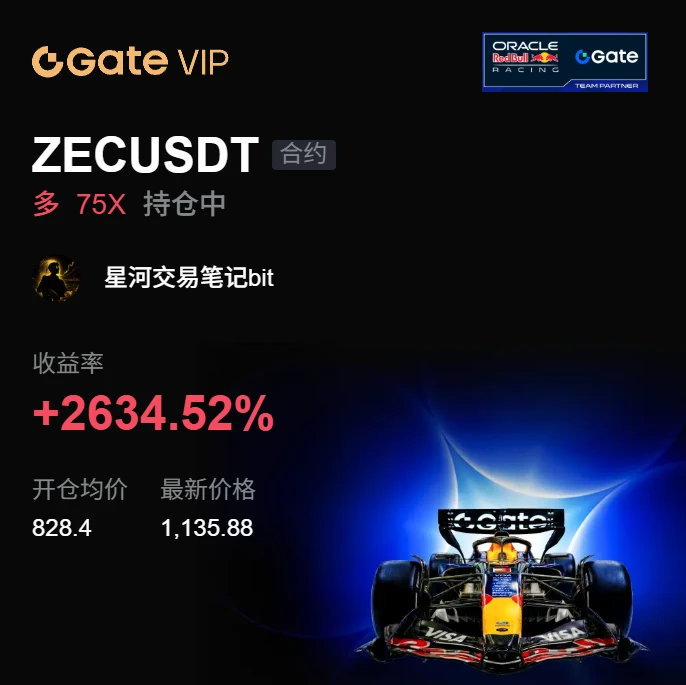
In the early session, the price pulled back to around 828.40 and stabilized, so I went long directly. The plan is simple: as long as the hourly candle body does not break the level, the upside target is the high-volume trading zone, with the stop-loss placed at the same time.

After entering, the price consolidated for a short while, with one wick in between, but I did not adjust the position. Once the hourly chart closed bullish again and pushed upward on increased volume, I took 70% off at the first target and moved the stop-loss on the remaining position directly above the breakeven level.
post-image
ADA-1.79%
SNDK+1.42%
Pi coin is priced at approximately $0.094 today, down slightly by 0.4% over 24 hours and rebounding modestly by around 4% over the past 7 days, but it has fallen more than 72% year to date and is down 97% from its all-time high ($2.98). Technically, the price is at the end of a triangular consolidation, with $0.097 as key resistance and $0.084 as support. The RSI is neutral and relatively stable, while momentum is mild. Trading strategy: Holders should watch whether $0.097 can be broken with increased volume; a breakout could support holding for a target of $0.117, while a break below $0.084 w
PI-0.91%
  • 3
I was just about to go to the forum and rant, but then I saw my balance. Never mind—the market is always right.

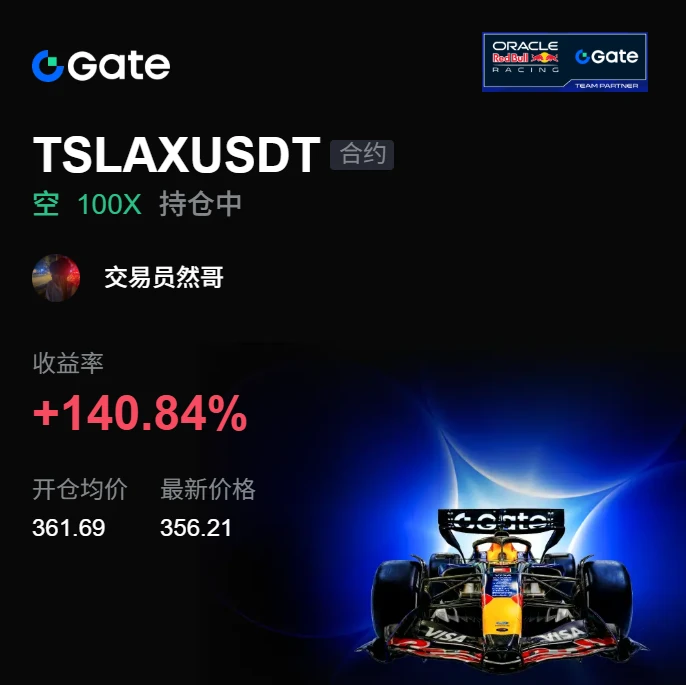
When the dump hit early in the session, $TSLAX rebounded to 361.69 but couldn't move higher. Volume failed to follow, while sell orders were particularly aggressive. I thought it would grind for a while longer, but the market didn't give me much time to hesitate and pushed straight down to 356.1, putting +142.89% in hand. The timing on this move was spot-on.

Close 70% first, and move the protection level for the remaining 30% up to 361.69. Hold if the rebound fails to break it;
post-image
TSLAX+0.01%
XRP-1.81%
BNB-1.81%
Do you stand with Israel or the UK after the UK has announced sanctions due to Jewish settler terrorism ?
post-image
$GT Founded in 2013, Gate.io is a leading global cryptocurrency exchange with 22 million users, and has long ranked among the top three worldwide in trading volume and liquidity. Gate.io currently ranks second globally in 24-hour spot trading volume and supports spot trading, futures contracts, leveraged trading, and financial products for more than 3,800 cryptocurrencies. The platform provides diversified digital asset trading and blockchain application-related services. Its total reserves exceed $10 billion, ranking fourth globally, with a total reserve ratio as high as 128.58%. It also use
GT+2.51%
I just casually hit refresh, and it went up on its own, leaving me in a very passive position😅
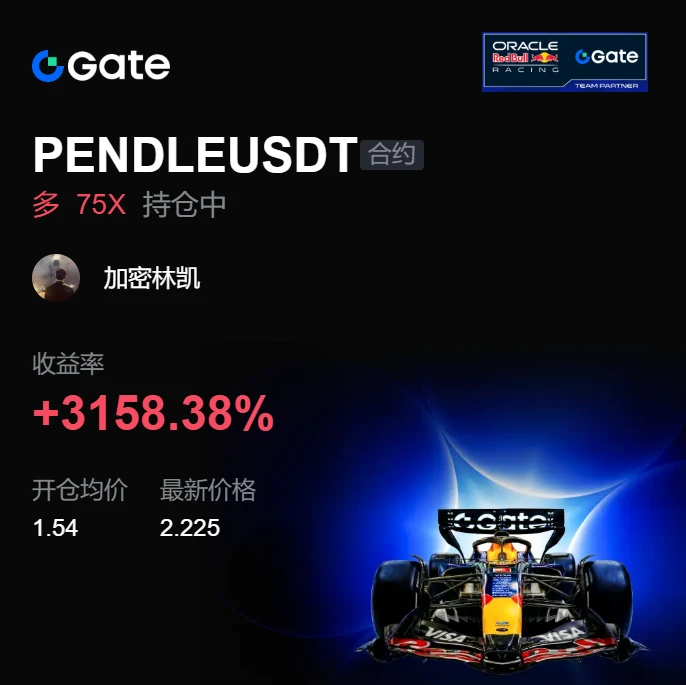
When I checked the chart after lunch, $PENDLE had pulled back to around 1.540. Buying support was clearly stronger than in the morning, and the market didn’t look like it was about to dump either. The key level held, which was reason enough, so I followed the move and added another long position.
Who would’ve thought that when I checked again in the evening, the price had already reached 2.225, and this position was showing +3158.38% in floating profit. This was a very satisfying bite of the meat💪
post-image
PENDLE+7.29%
SNDK+1.42%
ADA-1.79%
morning update 🥰🌹
live-cover
LIVE1,879
9.08 Bitcoin Analysis
Analysis: Go long on a pullback to around 78000‑78500, with 77500 as the defensive stop, first target at 79500, and second target at 80000
On the hourly chart, the price has undergone a continuous decline, falling under pressure from the high of 80536.1 and testing a low of 78636.0. The short-term MA7 and MA30 moving averages are both trending downward, with the price below the moving averages, indicating that bears are in control in the short term. The Bollinger Bands are opening downward, with the price moving close to the lower band. After consecutive bearish candlesti
post-image
BTC-1.50%
9.8 Gold Outlook
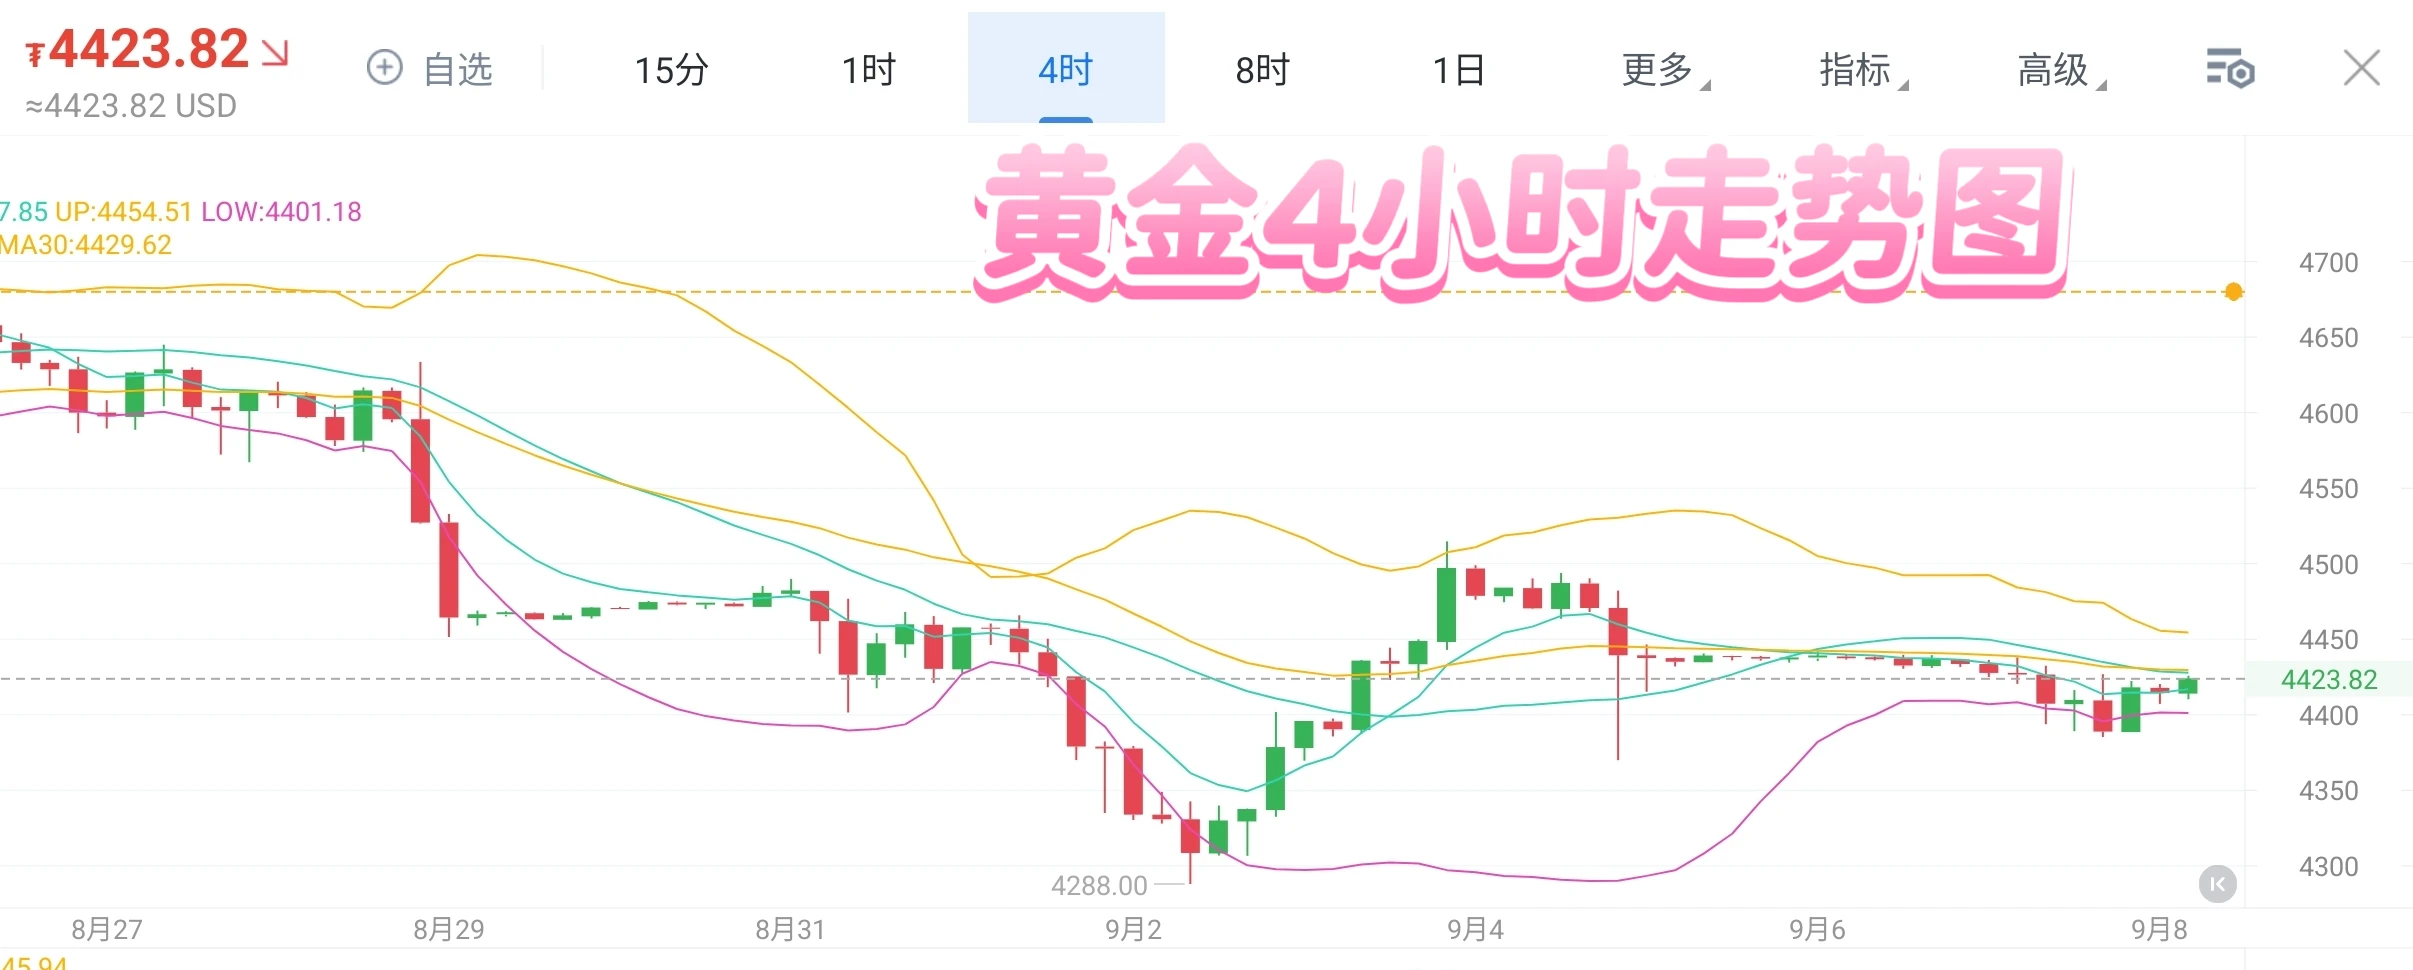
The gold market opened lower yesterday at 4420.3, then rose to 4435.5 before quickly falling to 4488.4, then rallied to 4424.4 before quickly retreating. The daily low reached 4480.3 before prices rose in the late session. The daily candle ultimately closed at 4406.2, forming an inside-bar hammer pattern. After this pattern, today’s market still favors buying on pullbacks,
In terms of levels, buy on today’s pullback to 4382, targeting 4400, 4412, 4423, 4432, and 4450 as resistance.
$XAU #Gate闲钱宝自动生息享3%年化
post-image
XAU-0.05%
Everyone is missing the short setup forming right under SYMBOL

$SKYAI /USDT - SHORT

Trade Plan:
Entry: 0.05666 – 0.05704
SL: 0.05863
TP1: 0.05551
TP2: 0.05462
TP3: 0.05329

Why this setup?
Why now? The daily trend is bearish, the 1h price is 0.05685, the 15m RSI is 61.48 and the 1h ATR is 0.000742, which together define an entry zone between 0.05666 and 0.05704. The 1h ATR of 0.000742 sets realistic expectations for volatility, meaning the TP1 target of 0.05551 and TP2 target of 0.05462 are within one ATR move from the entry. The invalidation level at 0.05861 is the line in the sand that
SKYAI-5.52%
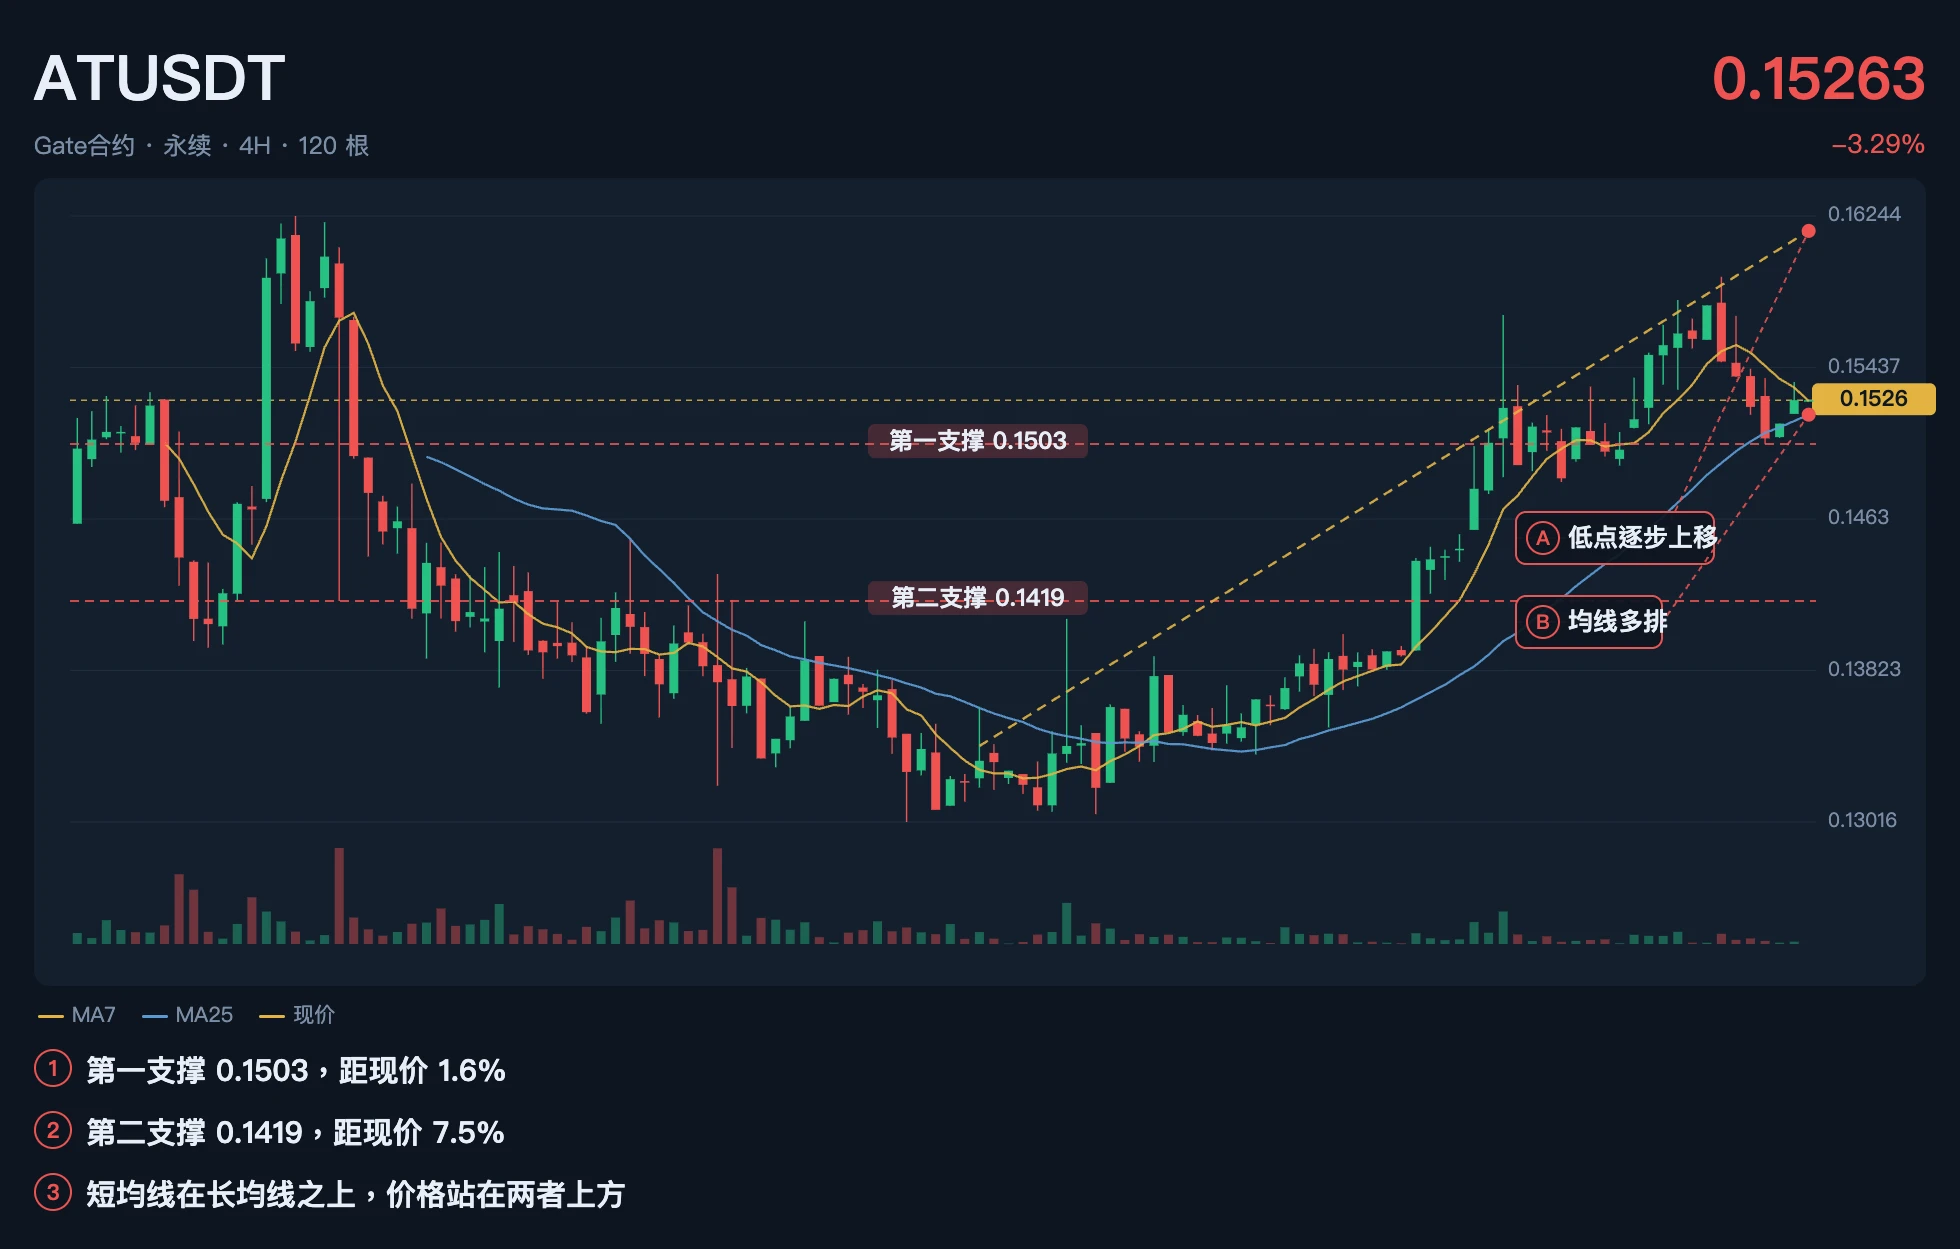
I’m bearish on this batch with no spot market. Of the 207, 83 are inverted, while only 53 are whale-skewed; retail is more bullish than whales, and this structure usually does not look like a bottom—the bottom is often when retail lies flat and whales take positions first, whereas the opposite is happening now. $AT Whales are 14.87 times higher than retail, with only $9M in OI; $HUMA 7.37 times with $12M; $KITE 7.19 times and $21M. Put simply, the few markets with the most extreme skew are all painfully thin; positions in the $20 million range can be pushed around by virtually any wave. Tot
post-image
AT-3.66%
HUMA-1.37%
KITE-4.37%
🚀 The yen just soared to a six-month high! 📈 Speculation around BOJ interest rates is shaking up the currency market. How will this impact your crypto positions? $JPY $USD #Forex
Load More

Join 40 M users in our growing community

⚡️ Join 40 M users in the crypto craze discussion

💬 Engage with your favorite top creators

👍 See what interests you

View More