Share your thoughts
placeholder
Article
Once the market starts rising, the price action becomes restless, especially for those watching the price climb all the way up without holding a position—their mindset is most likely to become unbalanced. After taking this $ARB trade today, I think the most valuable point to review is not that I got the direction right, but that I knew where I should exit.

When I entered, the price was still chopping back and forth within the range. The idea was simple: if the pullback held above the key level, look for an opportunity to go long. So I opened a position near 0.13805 and waited for the market
post-image
ARB+22.73%
LAB+2.32%
XRP+1.09%
  • 2
$UNI ‌UNi's real revenue expansion has only just begun.
UNI+15.53%
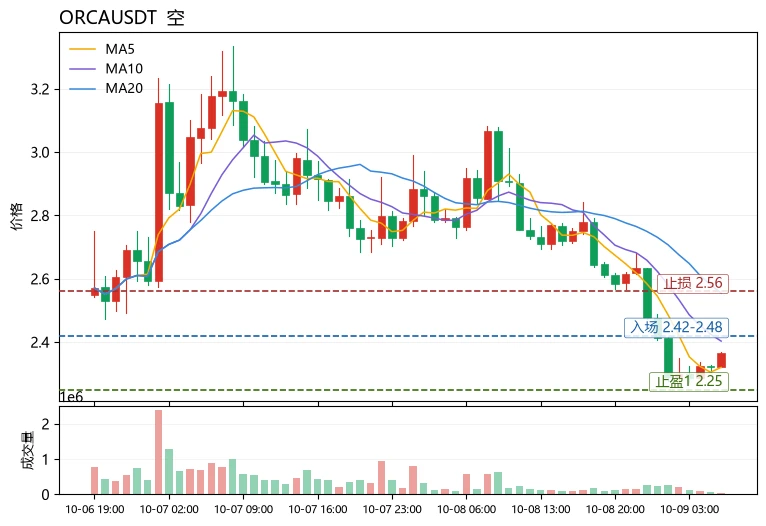
Most traders think XLM is dead—what if the range itself is the trap?

$XLM /USDT - SHORT

Trade Plan:
Entry: 0.18423 – 0.18501
SL: 0.18837
TP1: 0.18181
TP2: 0.17993
TP3: 0.17712

Why this setup?
- 4h bias is SHORT with 55% confidence—not a slam dunk, but a lean.
- Price sits at 0.18462, right at the range midpoint—no momentum, just indecision.
- RSI 15m at 58 shows weak bounce, but ATR 1h (0.00156) says volatility is shrinking—breakouts will be sharp.
- Targets: TP1 at 0.18181, TP2 at 0.17993—that's a 2.5% drop from here. In a range, the middle is the worst place to be long.

Debate:
post-image
XLM+2.65%
Web3 and crypto continue to evolve at an incredible pace new ideas, protocols and use cases are emerging every day. But in a market where innovation is constant novelty alone won’t create lasting value.
The projects that truly stand out will be those that go beyond speculation solve meaningful real-world problems, simplify adoption and bring more people into the digital economy.
The future of Web3 won’t be defined by whom makes the most noise.
It will be defined by whom builds what people actually need.
#Web3
post-image
There was clearly a key level above, but the price simply refused to pull back and retest it, grinding sideways near the highs. This kind of rhythm is the most painful for those without a position. I entered my long after the breakout on the pullback, with an entry reference around 0.3520. After several repeated wicks failed to break the level, I confirmed that the market was temporarily strong.
After the price reached near the target zone today, I took profit on 80% of the position directly, first reducing the risk on this trade. I did not close the remaining 20% either, tightening the stop-l
post-image
ZEC-1.52%
LAB+2.32%
$ETH Signal】1H momentum expansion + order book divergence, go long with the trend
$ETH The 1H MACD histogram at 3.87 continues to expand, with price rising to 2482.53. After the 4H MACD bullish crossover, the histogram is at 0.47, with overall momentum moving upward. Order book depth imbalance is -17.45%, with relatively thick sell-side orders, but price has not pulled back and is tracking the upper Bollinger band at 2481.6. The 1H RSI is 64.05, not yet extremely overbought, while the 4H RSI is 56.8, leaving room to rise. The funding rate is 0.0051%, so the trade is not crowded. The current r
post-image
ETH+1.02%
BTC+0.05%
SOL+1.57%
Brad cannot say a price. He is a CEO.
So he follows exactly 589 accounts.
The XRPL Foundation cannot say a price either.
So it hid 5, 8 and 9 in a picture.
589 was never a number. A password.
It is the sentence nobody in the room is allowed to say out loud.
1.3M followers is a bonus.
This was purely the market being in a good mood and casually scattering some gold coins, with one happening to land right on my head. When the screen was glowing green, I kept my eyes on $SAMSUNG ’s order book and noticed that it could no longer fall. Trading volume was also shrinking, while the funds buying the bottom were unusually resolute. I was already thinking: isn’t this exactly a sign that the bottoming process is over?

After entering at 186.14, the market surged all the way to 198.84, with a +483.69% return thrown right in my face. I timed the move so well that I wanted to applaud m
post-image
SAMSUNG-0.10%
SOL+1.57%
LAB+2.32%
Everyone’s staring at gold’s ceiling, but the floor just cracked on XAUT.

$XAUT /USDT - SHORT

Trade Plan:
Entry: 4426.7 – 4429.5
SL: 4439.6
TP1: 4419.5
TP2: 4413.8
TP3: 4405.2

Why this setup?
Why now? The 4h bias flips SHORT with 55% conviction, while the 1D stays range—this is a scalp, not a saga.
- Price sits at 4428.1, rejected from the 4429.5 high.
- RSI (15m) at 53.18 is fading, not accelerating.
- ATR (1h) at 5.72 means a clean 14-point slide to TP2 (4413.8) is a 2.5x risk-reward.
The range top is sticky; the first push down is the highest-probability move.

Debate:
If gol
XAUT+0.04%
$MU ‌Micron Technology (MU), a leading player in the semiconductor and memory technologies sector, continues to attract attention in the stock market with the strong demand generated by its artificial intelligence infrastructure investments. The stock gained 5.89% during intraday trading, rising to $1,014.95 for a strong session close.
Corporate Financial Data and Market Indicators
The current market values and trading data for Micron Technology are as follows:
Current Share Price: $1,014.95 (Daily change: +$56.46 / +5.89%)
Market Cap: $1.146 trillion
Intraday Trading Range: Lowest $969.00,
MU+5.89%
NAS100+0.06%
  • 4
  • 1
Everyone’s watching the 4h chart, but the 15m RSI at 65.89 just screamed something about SKYAI they’re ignoring.

$SKYAI /USDT - SHORT

Trade Plan:
Entry: 0.06090 – 0.06152
SL: 0.06414
TP1: 0.05901
TP2: 0.05755
TP3: 0.05535

Why this setup?
- Daily trend is bearish, yet the 15m is overbought—this is the classic “dead cat bounce” setup.
- Entry window is tight: 0.06090–0.06152. We’re sitting right at the edge while TP1 sits 3.6% below.
- With 95% confidence on the short, the risk/reward favors the drop, not the hop.

Debate:
If price rejects 0.06121 twice, do you trust the 95% or fade i
SKYAI+6.39%
$TEL BOUGHT MORE HERE NOW FUCKIN SEND IT!!!
post-image
TEL-0.36%
BTC & ETH Weekly Momentum Improves! Could September become stronger after the early volatility?
live-cover
LIVE732
Everyone’s chasing the 15m RSI bounce on $ESPORTS /USDT—but that’s exactly where the trap snaps shut.

$ESPORTS /USDT - SHORT

Trade Plan:
Entry: 0.01484 – 0.01492
SL: 0.01527
TP1: 0.01459
TP2: 0.01439
TP3: 0.01410

Why this setup?
- Daily trend is **bearish**, and the 4h setup is screaming SHORT at 95% confidence.
- The 15m RSI at 56.89 is a weak pullback, not a reversal—price is stalling under the 0.01488 pivot.
- Why now? ATR (0.000163) shows tight coils; the next leg down targets 0.01459 (TP1) and 0.01439 (TP2) before the daily close.
- The invalidation at 0.01530 is clear—risk is
ESPORTS+0.68%
Everyone’s watching HYPE’s 4h breakout—but I’m fading the crowd until this RSI prints a lie.

$HYPE /USDT - LONG

Trade Plan:
Entry: 85.800 – 86.102
SL: 84.505
TP1: 87.035
TP2: 87.758
TP3: 88.843

Why this setup?
- 1D trend is bullish, yet the 15m RSI at 64.16 screams overbought exhaustion before the 4h close.
- Entry zone 85.80–86.10 is a liquidity magnet; ATR (0.60) says volatility is coiling for a 1.5% snap either way.
- Why now? TP1 at 87.03 is only 1.2% away—but the 95% confidence LONG is priced for a “sure thing,” which is exactly when traps trigger.

Debate:
If the 4h candle clo
HYPE+1.05%
Nobody’s watching LTC’s 4h chart—but the range is about to snap like a dry twig.

$LTC /USDT - SHORT

Trade Plan:
Entry: 53.73 – 54.03
SL: 55.28
TP1: 52.83
TP2: 52.13
TP3: 51.09

Why this setup?
Why now?
- Price is glued to 53.88, but 1D trend = **range**, not momentum. Ranges don’t last forever.
- RSI 15m at 42.08—already rolling over *before* a retest of range lows. That’s early weakness.
- ATR 1h = 0.58—volatility is compressed. When it expands, the move is violent.
- Short plan: entry 53.88, TP1 52.83, TP2 52.13. That’s a 1.7R to first target with SL 55.28.
- If 53.73 breaks,
LTC+6.11%
Nobody's watching ONDO at 0.3699—but the 4h chart is about to force a decision.

ONDO/USDT - LONG

Trade Plan:
Entry: 0.3690 – 0.3708
SL: 0.3616
TP1: 0.3761
TP2: 0.3803
TP3: 0.3865

Why this setup?
Why now? The 1D trend is bullish, and price is holding just above the 0.3690 support floor with a 95% long confidence. RSI on the 15m is at 52.93—room to run, not overheated. ATR shows tight volatility, so the breakout from this coil could snap fast toward TP1 at 0.3761. This is the calm before the expansion.

Debate:
Are you scaling in at 0.3699, or waiting for a retest of 0.3690 to add size?
ONDO+3.58%
#交易机器人 I’m using the ETHUSDT Futures Grid Bot on Gate. Come copy-trade with me!
post-image
Everyone’s staring at H/USDT’s bounce—but the 4H tape just whispered a secret that 95% of traders will ignore.

H/USDT - SHORT

Trade Plan:
Entry: 0.07631 – 0.07705
SL: 0.08024
TP1: 0.07401
TP2: 0.07222
TP3: 0.06955

Why this setup?
- RSI (15m) is pinned at 33.52—weak momentum, not oversold enough to reverse a bearish 1D trend.
- ATR (1h) at 0.001485 means volatility is contracting—perfect setup for a liquidity sweep below 0.07631.
- With TP1 at 0.07401 and TP2 at 0.07222, the path of least resistance is down, not up.
- Why now? The 0.07960 invalidation is miles away, giving shorts ro
Load More

Join 40 M users in our growing community

⚡️ Join 40 M users in the crypto craze discussion

💬 Engage with your favorite top creators

👍 See what interests you

View More