

Square
Following
Hot
News
Profile
Share your thoughts
placeholder
Article
GateWCTCS9 Global Trading Competition is here! Do trading rankings depend on skill or luck?
Whenever there’s a trading competition, someone thinks: whoever has the highest returns is the best trader.
Sounds reasonable, but think about it: that’s like watching a basketball game and judging who played best all game based only on who made the final three-pointer.
Short-term results do matter, but an impressive return may also include market tailwinds and an element of luck. What’s also worth paying attention to is how much risk traders take on, whether they stick to their strategy, and whether th
MU+2.97%
  • 18
The Elon Musk-themed puppy token, puppies, appeared out of nowhere within one minute of Musk’s tweet, “l love you puppies.” Its contract address ends in 6eb2, and it is listed on more than a dozen exchanges. Communities in over 50 countries are continuing to build, making it worth accumulating at these low levels
Trenches
STONK
S
bade
b
STONK
6GmA...UNgx
Market Cap
$.
Change
.
24h Vol
$.
Holders
.
CNPY
C
bade
b
CNPY
0xc6...ddd2
Market Cap
$.
Change
.
24h Vol
$.
Holders
.
ZIG
Z
bade
b
ZIG
0x8c...1145
Market Cap
$.
Change
.
24h Vol
$.
Holders
.
Q
Q
bade
b
Q
0xc0...0589
Market Cap
$.
Change
.
24h Vol
$.
Holders
.
LAUNCH
L
bade
b
LAUNCH
AhBi...Qj6C
Market Cap
$.
Change
.
24h Vol
$.
Holders
.
$SYN looks completely exhausted at these price levels. If it can't find new buying support, preparing to short quickly here. Take profit: 0.1780Stop loss: 0.20209Market moves: $BTC : Current price 80,221.7 - 24-hour change: +0.20%$BULLA : Current price 0.15174 - 24-hour change: +64.13%
post-image
SYN+1.57%
BTC-0.67%
BULLA+10.92%
The morning analysis played out as expected!
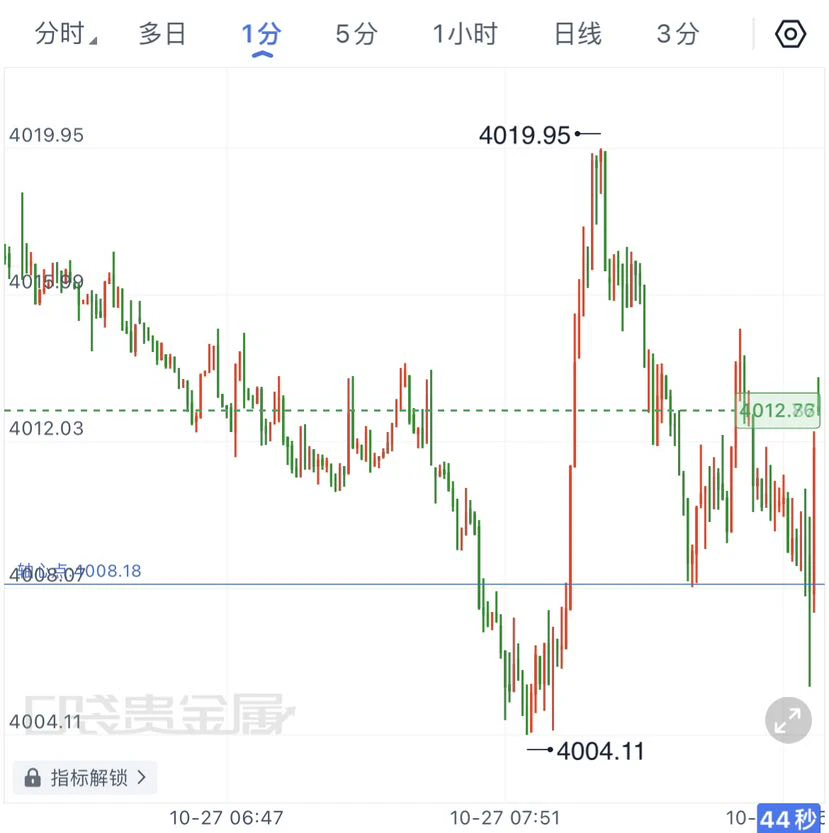
Previously, we flagged the 4018-4029 range for a short. Gold surged, hit resistance, and pulled back; a short from 4019 to 4005 secured 14 points in the short term. The forecast resistance and targets all played out, and the range-bound swing trade was firmly captured.
$XAU #ETH回调后能否企稳 #黄金 ‌
XAU+0.38%
#美股财报季 The market is no longer willing to pay for AI spending: Earnings from the three major cloud giants + the Fed will decide whether we rebound or plunge
If you’ve been following U.S. stocks lately, you’ve probably sensed a shift: For the past two years, anything tied to AI basically went up without question; starting this week, though, investors have become more selective—AI stories alone aren’t enough anymore; companies need to deliver results.
Last week’s market action directly triggered this shift. The Nasdaq fell for a full week, its worst weekly performance since June, and at one poin
post-image
ThisIsTranslateContent:
#美股财报季 The Market Is No Longer Paying for AI Spending: Earnings from the Three Cloud Giants + the Fed Will Decide Whether the Rebound Continues or the Market Plunges Further
If you’ve been following U.S. stocks lately, you’ve probably noticed a change: over the past two years, anything associated with AI would go up almost without fail. But starting this week, investors have become more selective—AI stories alone are no longer enough; companies need to deliver results.
The immediate trigger was last week’s market action. The Nasdaq fell for the week, its worst weekly performance since June this year, and even saw its biggest single-day drop intraday.
The reason is straightforward: earnings from Meta and semiconductor equipment maker Lam Research fell short of expectations, prompting the market to seriously question for the first time when the billions these major companies are pouring into AI will actually pay off. And this week is when a wave of earnings reports will come in.
Why This Week Is So Important
Several major events are converging:
After the market closes on Wednesday (10/28), Microsoft and Google parent Alphabet will report earnings on the same day;
In the early hours of Thursday (10/29), the Fed will announce its interest rate decision, and Amazon will report earnings that evening;
The U.S. September PCE inflation data will also be released on Thursday.
In other words, guidance from the three major cloud providers, the Fed’s stance, and inflation data will all land within two days. They will answer the same question: Is the recent pullback in U.S. stocks a normal correction, or the start of a much steeper decline?
A Few Numbers to Watch
Wall Street currently expects major cloud providers to spend around $800 billion on AI this year. The money has already been invested; now the market wants to see returns.
As for the Fed, it is widely expected to hold rates steady in October, keeping them at 3.75%–4.00%. But markets have already priced in about a 72%–80% chance of a rate hike in December. So a hold this time doesn’t mean policy will be more accommodative going forward.
One less-noticed point: data shows Wall Street’s overall leverage ratio has risen to 214%. Leverage has been quietly building up as markets have heated up, and if the tide turns, deleveraging itself could amplify volatility.
There is good news on the other hand: S&P 500 companies that have reported third-quarter results so far are still posting year-over-year earnings growth of around 30%. Fundamentals haven’t broken down; expectations simply ran too far ahead and now need to be validated by results.
So the key thing to watch this week isn’t whether stocks rise or fall, but whether companies’ guidance on spending and signals on returns line up.
Key Times This Week
Microsoft, Google: After the market closes on 10/28; watch capital spending and signs of returns from cloud businesses;
Amazon: 10/29; watch retail and AWS, as well as its stance on capital spending;
Fed: Early hours of 10/29; a hold is largely expected, so focus on the wording around December; PCE: 10/29; watch whether inflation adds to rate hike expectations; if volatility picks up, watch for ripple effects from highly leveraged positions.#WCTCS9 #Gate广场万圣节

repost-content-media
MSFT+1.56%
GOOGL-1.05%
AMZN+0.40%
Analysis for October 27, 2026
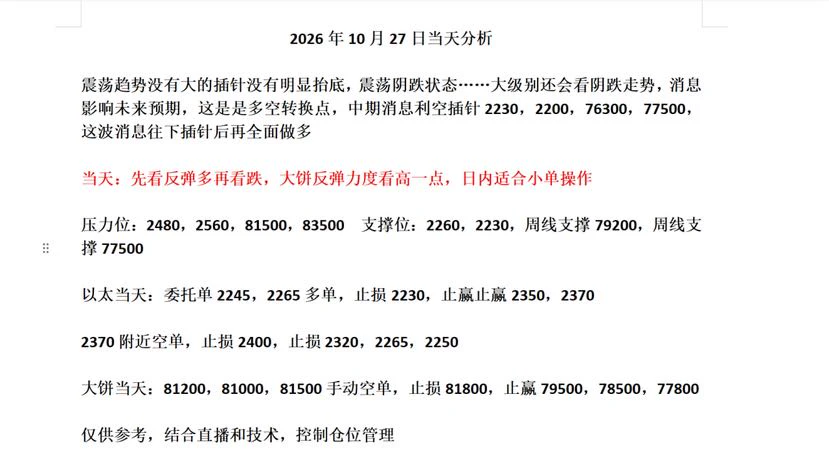
The market is ranging, with no major wicks and no clear higher lows, in a choppy, slow-decline state... The larger timeframe still points to a slow bearish trend. News affects future expectations; this is is a long-short turning point. Medium-term bearish news could trigger wicks down to 2230, 2200, 76300, and 77500. After this wave of news-driven downside wicks, go fully long.
Today: First look for a rebound long, then look for a decline. Expect a slightly stronger rebound in BTC; small positions are suitable for intraday trading.
Resistance: 2480, 2560, 81500, 8
post-image
BTC-0.67%
ETH-1.26%
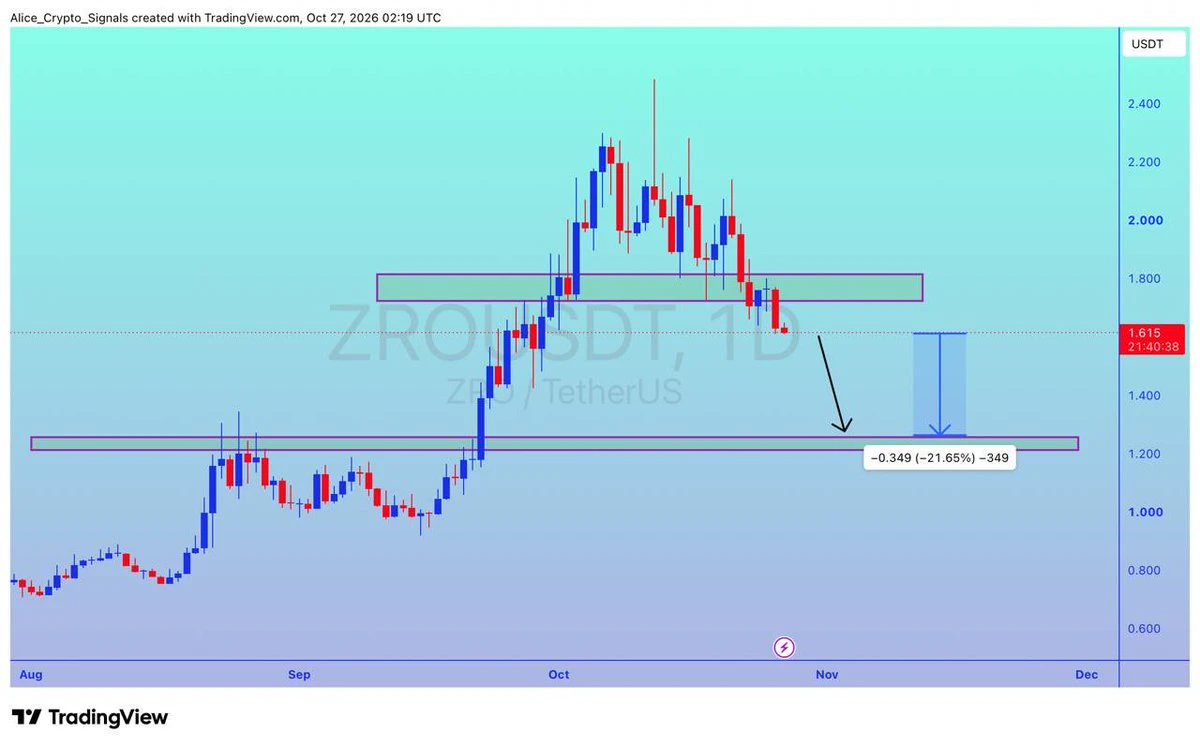
$ZRO
UPDATE
#ZRO is getting a good drop here. In this move we can see 20%+ gain here ✍🏻
#ZROUSDT #ZROBTC #Btc #Bitcoin #Nfts
post-image
ZRO-2.59%
BTC-0.67%
  • 3
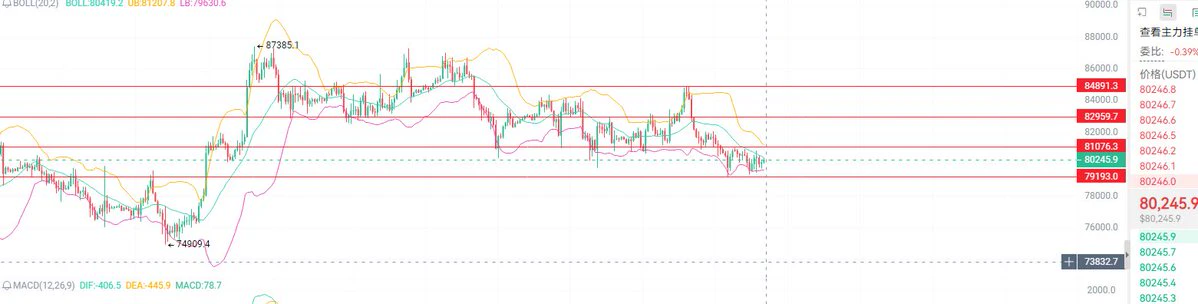
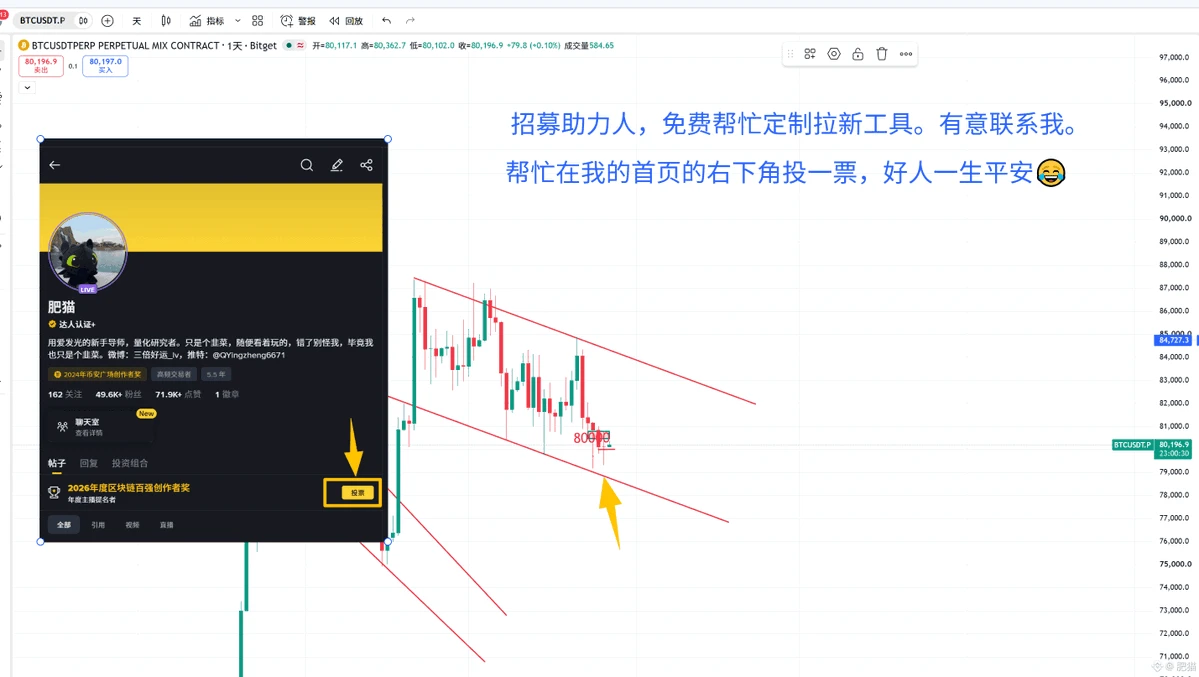
Bulls and bears are still battling. The best-case scenario is for the price to stay near the 80,000 level. It has dipped below several times and recovered, indicating that selling pressure from bears is currently easing. If a double bottom forms on the 4-hour chart, it will just be a matter of waiting for a catalyst.
Intraday buy-the-dip strategy: go long at 79800, stop-loss at 79000, target 83000 bitcoin:native
post-image
BTC-0.67%
  • 1
🔥 Gate Square Creator Comeback Program | Return & Win Up to 30 USDT
This October, Gate Square welcomes creators back!
Post for 3 / 7 / 14 consecutive days to unlock USDT rewards, while Top 100 creators can earn leaderboard rewards. 1st place wins 30 USDT + a 200 USDT Position Experience Voucher + premium merchandise.
📌 Register → Return → Keep Posting → Climb the Leaderboard
⏰ Ends October 31
Register Now:
https://www.gate.com/campaigns/6692
Campaign Details:
https://www.gate.com/announcements/article/102058
‍#GateSquare #CreatorComeback #GT #Web3 #Crypto
Gate_Square
🔥 Gate Square Creator Comeback Program | Return & Win Up to 30 USDT
This October, Gate Square welcomes creators back!
Post for 3 / 7 / 14 consecutive days to unlock USDT rewards, while Top 100 creators can earn leaderboard rewards. 1st place wins 30 USDT + a 200 USDT Position Experience Voucher + premium merchandise.
📌 Register → Return → Keep Posting → Climb the Leaderboard
⏰ Ends October 31
Register Now:
https://www.gate.com/campaigns/6692
Campaign Details:
https://www.gate.com/announcements/article/102058
‍#GateSquare #CreatorComeback #GT #Web3 #Crypto
repost-content-media
GT-2.41%
  • 3
Trading with the trend feels great[doge]
Entered at 4016, target 4009 reached, successfully took profit.
The most important thing in trading is to follow market trends, manage risk strictly, and take profits at the target—don't get greedy.$XAU ‌
XAU+0.38%
From the September peak, MINA has slid to just over 6 cents, a nearly 70% retracement. The current price is 0.0636, with a daily fluctuation of 1.6%, a high of 0.0648, and a low of 0.0613. Trading volume is 10.86 million tokens, worth about 690k U. The moving averages are all overhead: MA7 is at 0.0671, MA25 is pressing down to 0.0854, and MA99 is at 0.0770. The short-, medium-, and long-term moving averages are all weighing on the price—a classic downtrend that hasn’t run its course. Believe it or not, the market data is there for you to see. This coin’s main selling point is its lightweight
post-image
MINA-1.98%
#美股财报季 #WCTCS9 #Gate广场万圣节
The Market Is No Longer Buying the AI Story Alone: Big Tech Earnings and the Fed Could Determine Wall Street’s Next Move
For the past two years, AI-related stocks have enjoyed strong rallies as investors bet on the transformative potential of artificial intelligence. But the market is entering a new phase. AI enthusiasm alone is no longer enough. Investors want measurable returns on the billions of dollars being poured into infrastructure, chips, and data centers.
Last week’s weakness in the Nasdaq highlighted this shift. Disappointing results from Meta and semiconduc
NDAQ+2.05%
MSFT+1.56%
AMZN+0.40%
BTC-0.67%
  • 4
  • 1
MARKET UPDATE
live-cover
LIVE1,557
I was so scared just now I couldn’t sleep😂, worried that a stuck matching engine would cause a huge wick. Everything’s back to normal now, so it’s no big deal. As long as the Korean and Nikkei indexes aren’t falling on the daily charts, there’s no reason for us to fall on our own.
On the 1-hour chart, we’re in a converging triangle. We should get a short-term direction by 4 a.m. tomorrow at the latest. The strongest potential support below is 788-785, with the nearest support at 798-796. Resistance starts at 803, and the entire 805~808 range is resistance.
If you’re trying a short-term short,
post-image
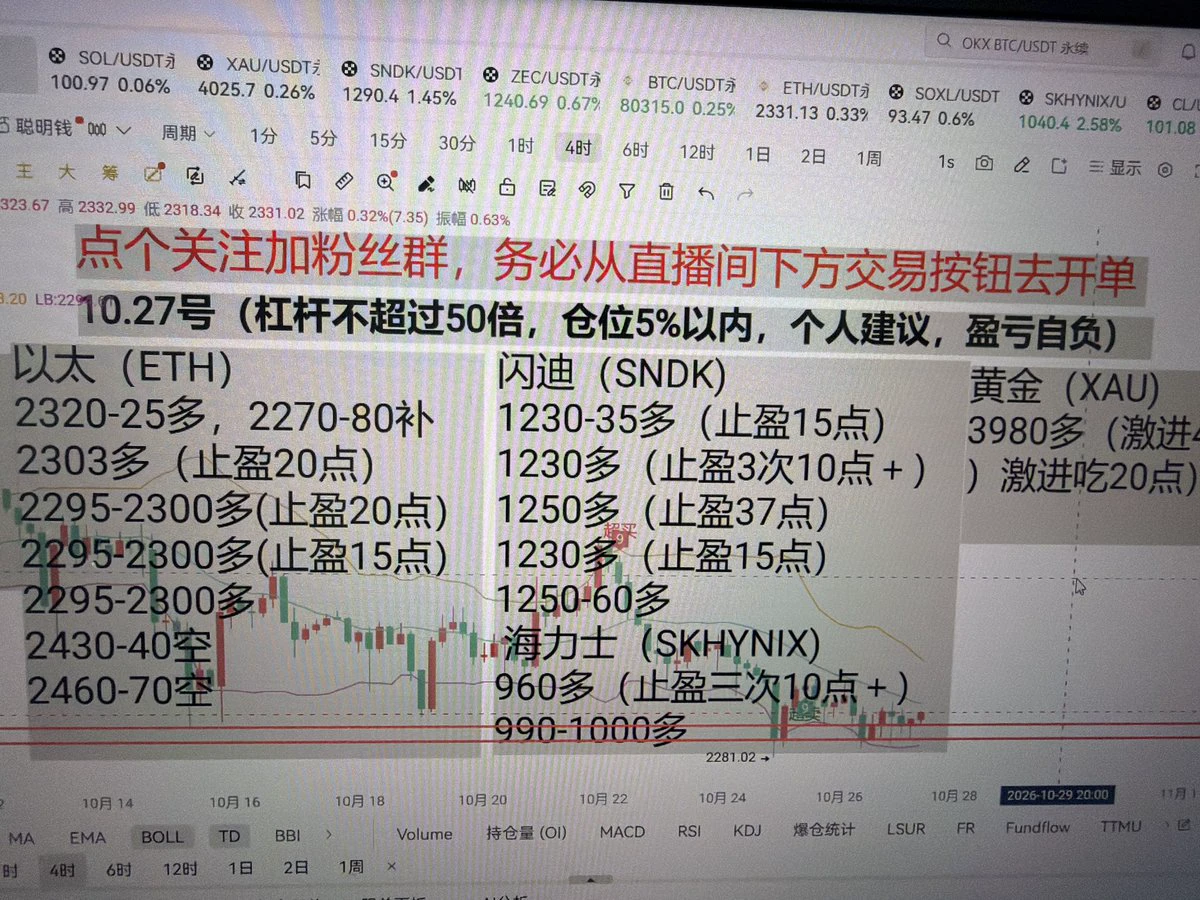
Yesterday’s livestream was absolutely incredible.
The bottom-entry longs on SanDisk and SK Hynix we called banked over a dozen trades.
And we said right on stream that once SK Hynix hits 1,000, it’ll pick up speed.
In today’s stream recap, all 15 trades were profitable.
There’s no one on the whole feed better than me, right?
Which livestream dares to give entry levels ahead of time, live?
Which blogger dares to confidently call the future direction live on stream?
The biggest letdown yesterday was BTC and ETH. When are my ETH at 2,400 and BTC at 82,000 going to hit?
U.S. stocks are rallying, a
post-image
SNDK+1.46%
BTC-0.67%
ETH-1.26%
10.27 Gold Morning Analysis
With macro bullish and bearish factors intertwined and no major data releases this morning, gold prices are likely to remain range-bound, awaiting a news catalyst.
The Bollinger Bands are narrowing, with prices hovering around the moving average. Strong resistance is at 4029.78, with key support at 3978.
Short-term resistance: 4018–4025; strong resistance: 4029–4030; support: 4000; core support: 3978.
Trading strategy: Short in batches if a rebound meets resistance at 4018–4025, with a stop-loss above 4033. Target 4000 first, then 3975 if support breaks.
Note:
The a
post-image
XAUT+0.30%
Turn on the audio, then leave the room.
What will the two of them talk about???
post-image
Evening Market Updates
live-cover
LIVE2,101
Siri understands you, yet leaves it up to you whether to listen.
AI-assisted creation|Source:
post-image
10/27 Gold:
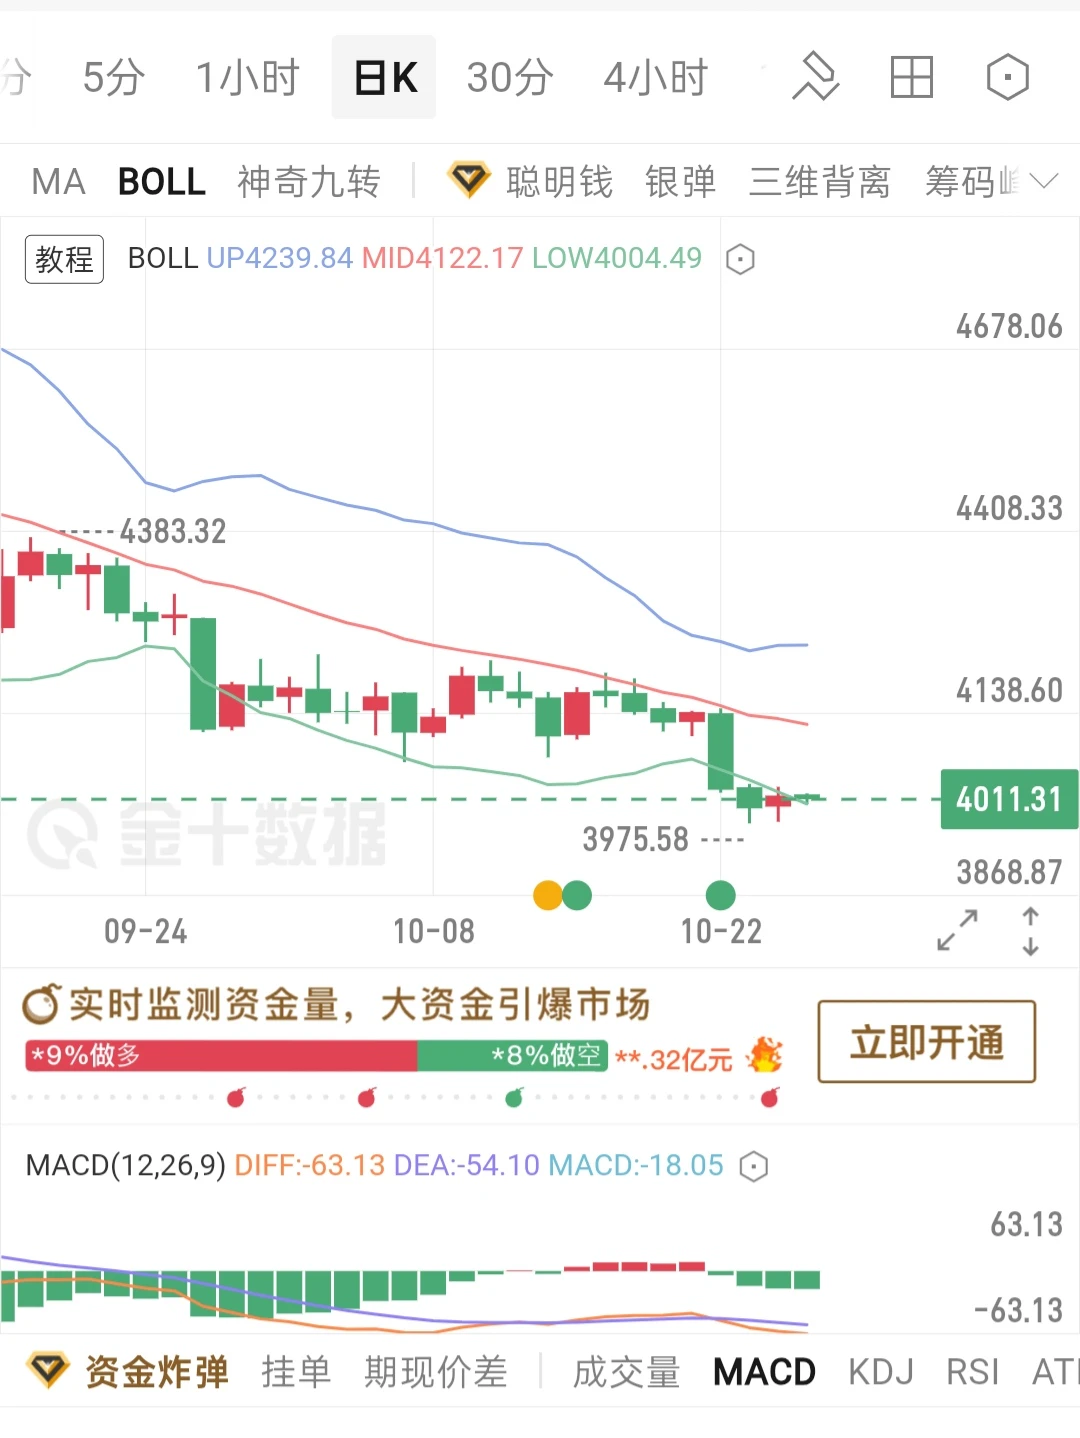
On the daily chart, the Bollinger Bands are opening downward. The current price is moving close to the lower band, with the overall trend biased bearish and resistance above at the middle band.

On the MACD indicator, both the DIFF and DEA lines remain below the zero axis, keeping the broader bearish environment unchanged. The green histogram bars have narrowed slightly, indicating that downward momentum has eased somewhat, but there is no golden cross reversal signal yet. This is merely a brief pause during the decline, not a bullish reversal.

Trading recommendation:
Short at 4
post-image
GLDX-0.40%
PAXG+0.37%
Load More

Join 40 M users in our growing community

⚡️ Join 40 M users in the crypto craze discussion

💬 Engage with your favorite top creators

👍 See what interests you

Trending Topics

USEarningsSeason

153.69k Views2.35k Discussing

The U.S. Q3 earnings season is in full swing, with major tech companies including Tesla and Meta reporting results. Market focus is shifting beyond revenue and profit toward AI spending, capital expenditure, margins and forward guidance. Which company’s earnings are you watching most closely?

KeyMacroWeekAhead

6.97k Views966 Discussing

BTCBattlesFor80000

113.07k Views25.14k Discussing

View More