






Square
Following
Hot
News
Notifications
Profile
Share your thoughts
placeholder
Article
#USOctoberCPIBeatsExpectations

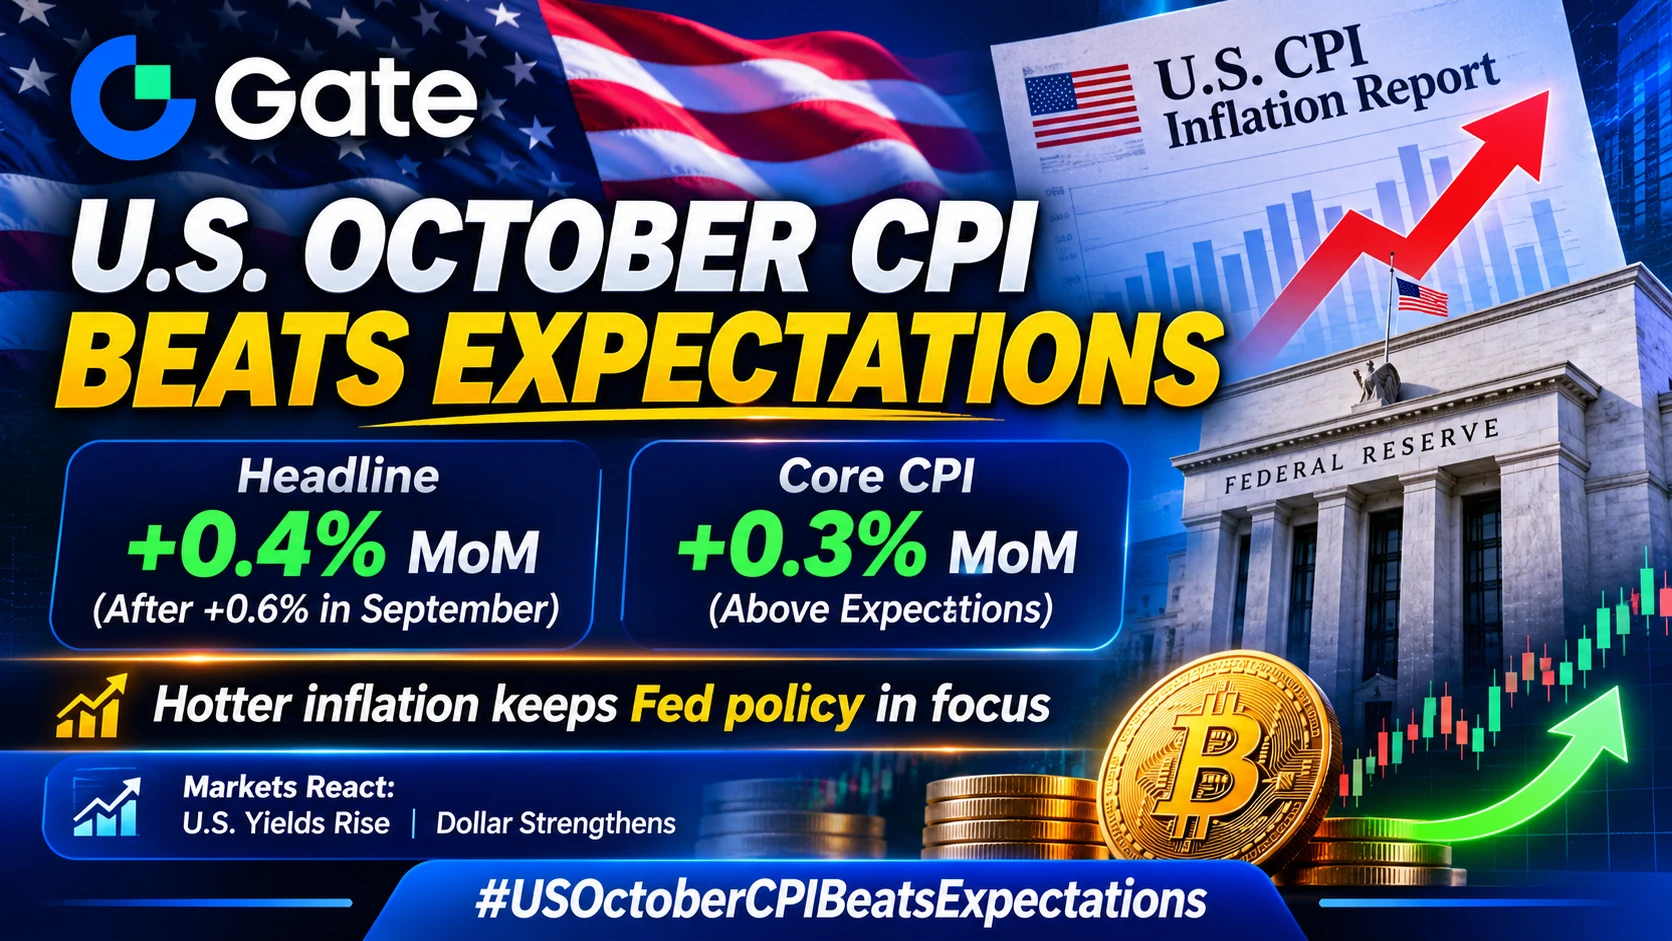
🇺🇸 U.S. October CPI Comes in Hotter Than Expected — Markets Reprice the Fed Outlook

The latest U.S. inflation report has delivered another important signal for global financial markets, with October consumer prices rising faster than economists expected.

According to the U.S. Bureau of Labor Statistics, headline CPI increased 0.4% month-over-month in October, following a 0.6% rise in September. Core CPI, which excludes food and energy, increased 0.3% during the month. Both readings were stronger than the market had anticipated.

🔥 Inflation Remains Sticky

post-image
XAU+0.38%
BTC-0.67%
Why Can Seemingly Legitimate Airdrops Still Be Scams? From Phishing Links to Malicious Approvals, Build an Airdrop Safety Checklist

In the Web3 world, airdrops have long been one way for users to engage with new projects.

Some projects distribute tokens through airdrops, reward early users, or expand community participation. At the same time, scammers exploit users’ hopes of getting free tokens by designing campaigns that look entirely legitimate.

They may use polished campaign pages, impersonate official accounts, create seemingly authentic task lists, and even misuse the names and logos o
post-image
Trenches
mihao
m
bade
b
mihao
4Cxj...pump
Market Cap
$.
Change
.
24h Vol
$.
Holders
.
PIEVERSE
P
bade
b
PIEVERSE
0x0e...25a9
Market Cap
$.
Change
.
24h Vol
$.
Holders
.
HOLD
H
bade
b
HOLD
4iJ7...pump
Market Cap
$.
Change
.
24h Vol
$.
Holders
.
X
X
bade
b
X
9VZe...pump
Market Cap
$.
Change
.
24h Vol
$.
Holders
.
AGT
A
bade
b
AGT
0x5d...e274
Market Cap
$.
Change
.
24h Vol
$.
Holders
.
gm web4 🥐
catch me if u can.. i love this spot
what’s ur favorite spot for breakfast?
post-image
Guys, this ARIA thing—Big Chao is seriously impressed.

In mid-October, it was only 0.036. Now it’s at 0.24, more than 6x in less than a month, and it’s up another 20% today.
We’ve shorted this coin twice. The first time, we shorted at 0.078 and made a profit. The second time, we saw it had risen way too much and shorted again, but it got pumped straight through our stop-loss.

At the time, we even checked the on-chain data because we thought the market maker was pumping it and it would eventually come crashing down.
But they don’t play by the rules—they just kept pushing it up, past 0.1, 0.15
ARIA+22.03%
MSFT-2.15%
NEW MARKET UPDATE
live-cover
LIVE41
Why might a trading strategy that performed exceptionally well on historical data gradually fail in real markets?

A beautiful backtest curve does not mean the strategy has a stable edge in live trading.

The problem is often not that backtesting is worthless, but that we may overestimate what historical data can prove.

There are four key reasons worth paying attention to.

1. Overfitting: The strategy has memorized history without truly understanding the market.

Constantly adjusting parameters until the historical profit curve looks good can easily make a strategy fit past noise rather than
post-image
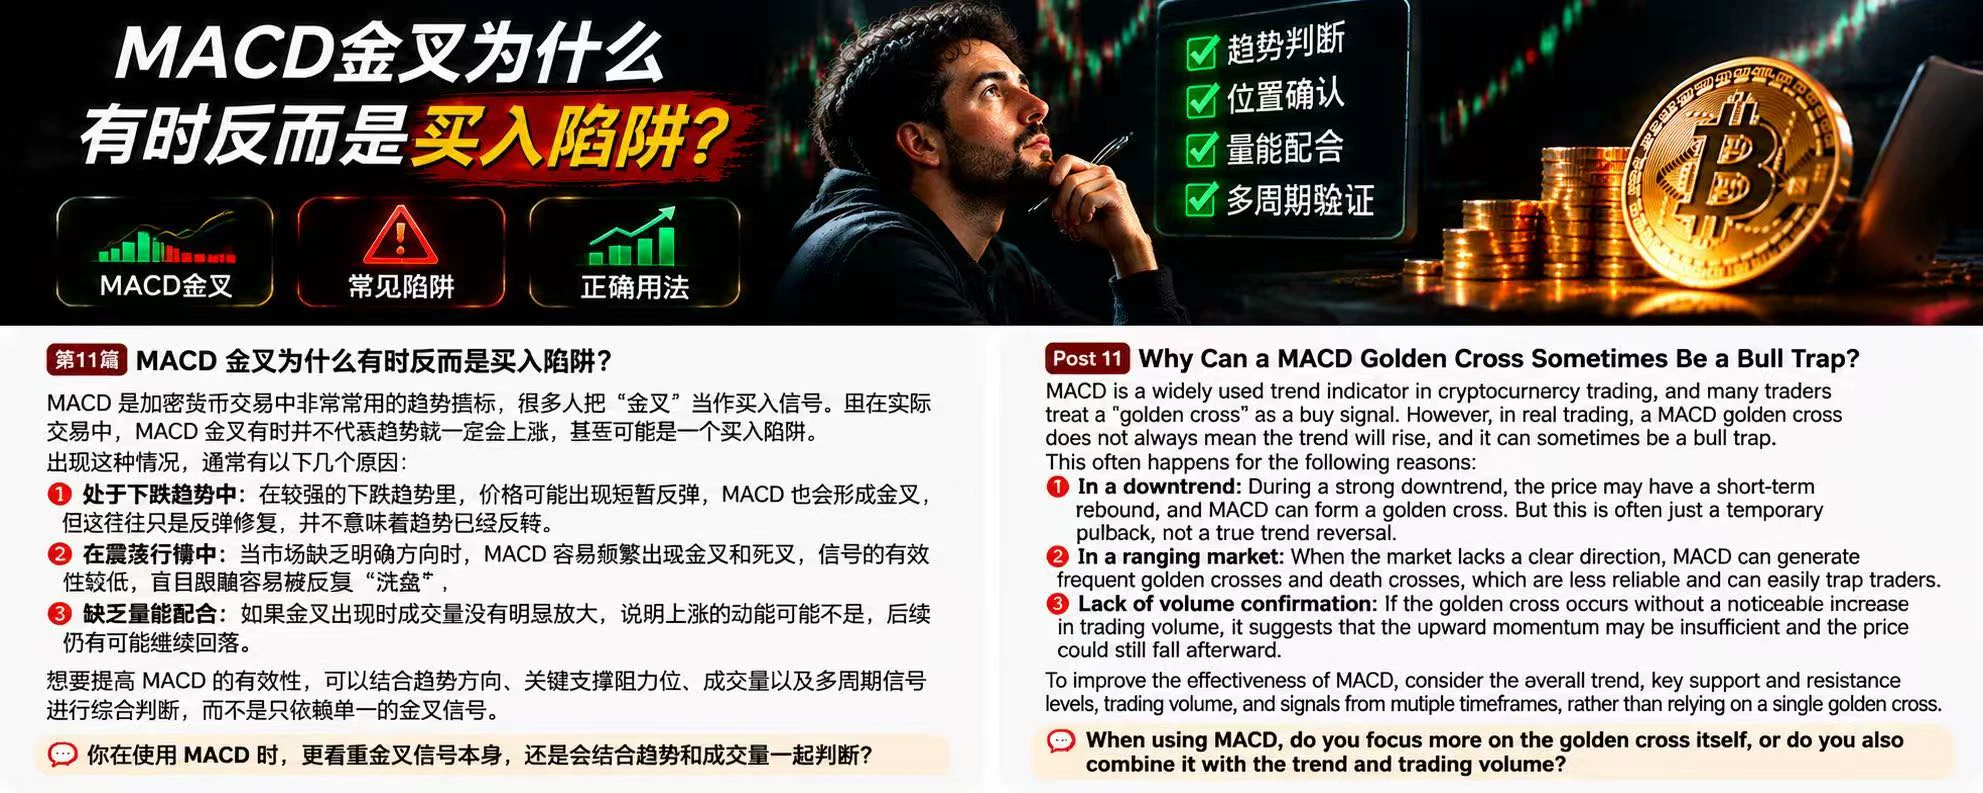
Many traders see RSI above 70 and assume the market has risen too much and prices are about to fall, so they rush to open short positions. But in real market conditions, especially during strong uptrends, BTC may continue to rise even after RSI enters overbought territory, or remain at elevated levels for a long time.

Why does this happen?

First, the trend is strong. In a clear uptrend, buying pressure remains stronger than selling pressure, and RSI may stay above 70 for an extended period. This does not mean prices are about to reverse; it may instead indicate that bullish momentum remains
post-image
BTC-0.67%
11.11
Watched the market last night. BTC continued probing liquidity to the downside. Built a base position for a laddered long at 73000; it’s currently around 74000. Planning to set a break-even stop-loss, with a target of 75000$BTC $ETH #美国10月CPI全面超预期
FyPaymentMadeEasy
11.11
BTC currently has two 4-hour MACD segments, combined with an RSI oversold bullish divergence, but trading volume is still low and the rebound is very weak. Bearish momentum is weakening, so watch for a rebound here to test 75000, as I also mentioned on yesterday’s livestream.
A reversal is only possible if the 75000 resistance is broken and holds.
Spot is currently an opportunity to build a position; everyone built positions in 10 ETH yesterday. Futures traders can establish a starter position to capture a short-term long trade. We’re still watching how U.S. stocks drive BTC tonight$BTC $ETH #美国10月CPI全面超预期
repost-content-media
BTC-0.65%
ETH-1.23%
Official perks are here🎁
Scan the Gate QR code to enter the [CFD Copy Trading Profit Contest]
Find [Jiu Yi Jin Ce No. 1] on the leaderboard and click Copy
Share 12,000 USDT together
post-image
  • 1
What signals indicate that BTC’s upward momentum is weakening as it rises?

In crypto trading, many people see BTC continually reaching new highs and assume the uptrend remains strong. But in reality, rising prices do not mean upward momentum is always sufficient. What really matters is whether the market forces behind the price are changing.

There are four signals worth watching closely.

First, trading volume keeps shrinking. If the price continues to rise while trading volume gradually declines, the buying pressure driving further gains may be weakening.

Second, the RSI shows bearish dive
post-image
🇩🇪 @DeutscheBank, Germany's largest bank, is rolling out crypto custody for institutional clients, starting with Bitcoin and Ether.
Asia expansion is planned for 2027. TradFi keeps moving in.
post-image
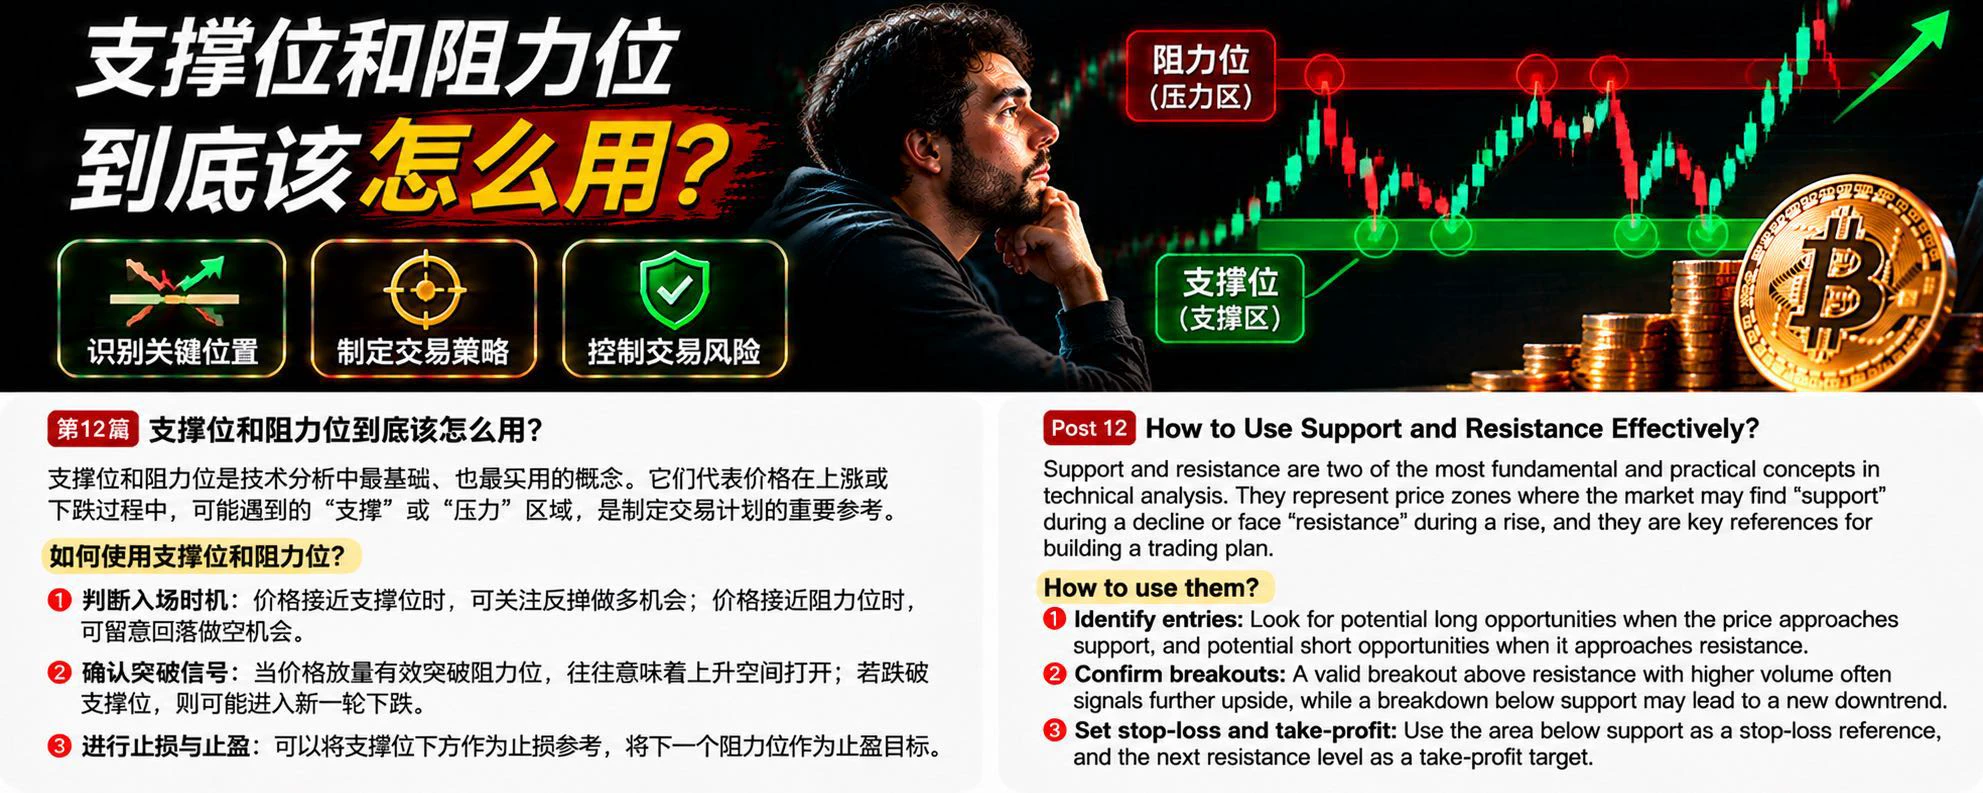
Support and resistance levels are the most fundamental and practical concepts in technical analysis. Many traders study candlesticks and indicators every day, yet overlook an important question: at which price levels are buying and selling forces likely to shift?

First, a support level is an area where buying pressure may increase as the price falls. When the price approaches this area, some buyers may start entering the market, slowing the decline. But a support level does not mean the price definitely won’t break below it.

Second, a resistance level is an area where selling pressure may in
post-image
BTC-0.67%
How can you tell whether a trading strategy truly has an edge, rather than just catching a favorable market?

If a trading strategy has made money consistently over the past few months, does that mean it has a genuine edge?

Not necessarily.

It may have identified a real market pattern, or it may simply suit a particular market phase. It may have genuine profit potential, or its backtest parameters may be overfit to historical data.

The real challenge is not finding a beautiful equity curve, but determining whether the edge behind it can stand up to scrutiny.

I. First, ask: What would happe
post-image
$H That was a brutal plunge: -25.33%, 24h low of 0.0313, current price 0.0326, and trading volume of 15.6M. Here’s a simulation of today’s trading steps in a market maker’s voice: Early in the session, place small bids at 0.036 to make retail traders think support is solid; after 10 a.m., pull the buy orders and turn around to smash through 0.034, triggering stop-losses; accelerate the drop in the afternoon to 0.0313 and liquidate leveraged positions; then slowly buy back around 0.032 toward the close. The 15.6M volume shows that panic selling really came out, but there are signs of support bi
  • 6
  • 1
🔹AI Stocks Plunge Across the Board! Nvidia drops over 5 and IREN tumbles nearly 8. Is there more do
live-cover
LIVE3,265
$CLO I chased in too aggressively at 0.044. It’s now at 0.0351, and I’m sitting on a 20% unrealized loss. I’ll show my position before I say anything.
Two days ago, 24h volume had just climbed above 6M, and the price surged to 0.0457. I saw the order book stacked with buy orders and was afraid of missing out, so I jumped in at 0.044 with 30% of my position. Then last night, volume dropped to 4.9M, and the price slid all the way to 0.0345, down 19.73% over 24h, completely shattering my faith in that bullish candle. My mindset while holding was textbook: at 0.041 I wanted to add, at 0.038 I want
  • 5
  • 2
Good morning CT ☀️
post-image
Why Do DeFi Projects Get Hacked? What Happens from Vulnerabilities to Stolen Funds?

A DeFi project may have publicly available smart contracts, a polished interface, an active community, and even a security audit.

But none of these conditions means it is completely safe.

In the Web3 world, security incidents are often caused by more than one issue. Code flaws, permission design, price data, external dependencies, and human actions can all become points of entry for risk.

More importantly, when a local vulnerability combines with the mechanisms that move funds, what seems like a minor issue
post-image
I still have no idea what Dario went through at Baidu. Here’s a plain-English translation of Anthropic’s latest regional restrictions, which take effect on November 12:

1. If you’re in China, you can’t use it—even if you’re American and have a U.S. account.
2. If your company is registered or headquartered in China, your U.S.-based employees can’t use it with their company accounts.
3. If the company you work for overseas is directly or indirectly controlled by a Chinese company, you can’t use it with your company account.

Starting tomorrow, cherish every friend around you who can use Claude
post-image
Many traders’ first reaction after losing money in their account is to make it back as quickly as possible. But there’s a very important mathematical point that is often overlooked: the percentage loss and the percentage gain needed to break even are not symmetrical.

Suppose your account originally had 1000 USDT.

If you lose 10%, your account is left with just 900 USDT. To get back to 1000 USDT from 900 USDT, you need to gain 100 USDT, which means a rise of about 11.11%, not 10%.

If you lose 20%, your account is left with 800 USDT, and you need a 25% gain to break even.

If you lose 30%, yo
post-image
Load More

Join 40 M users in our growing community

⚡️ Join 40 M users in the crypto craze discussion

💬 Engage with your favorite top creators

👍 See what interests you

Trending Topics

GateGlobalComplianceExpansion

15.89k Views353 Discussing

Gate continues to expand its global compliance footprint, now covering 81 regulated jurisdictions across Europe, North America, Asia, and Oceania. From MiCA and U.S. state-level MTLs to Japan’s FSA, Dubai, and Australia-related regulatory approvals, global exchanges are entering a new stage of compliance competition. Do you think regulatory strength will become as important as products and liquidity for exchanges in the future?

USOctoberCPIBeatsExpectations

87.04k Views2.65k Discussing

AnthropicIPOValuationCouldReach1.4T

12.22k Views1.61k Discussing

View More