Share your thoughts
placeholder
Article
Nobody is talking about the quiet move happening inside $HOME /USDT right now.

$HOME /USDT - SHORT

Trade Plan:
Entry: 0.00545 – 0.00547
SL: 0.00556
TP1: 0.00539
TP2: 0.00534
TP3: 0.00526

Why this setup?
Why now? The daily trend is bearish, the 1h price is sitting at 0.00546, the 15m RSI reads 55.12, the 1h ATR is 0.000041, and the entry zone spans 0.00545 to 0.00547. The bearish daily trend confirms sellers are in control, while the 1h price at 0.00546 sits exactly on the entry reference, making it the precise trigger point. The 15m RSI at 55.12 shows room for further downside before ove
HOME-0.55%
#OracleQ1EarningsBeatStockUpOver5%
Oracle just gave the AI trade another reason to stay on my radar — but the interesting part isn’t simply that earnings beat expectations.
It’s what happened after the beat.
Oracle reported Q1 FY2027 revenue of $19.3B, up 30% YoY, while non-GAAP EPS came in at $1.92, also ahead of expectations. The real headline for me was cloud: total cloud revenue jumped 62% to $11.6B, while Cloud Infrastructure revenue exploded 121% to $7.4B.
Oracle also added more than $30B in new AI cloud contracts during the quarter, pushing remaining performance obligations to a massiv
post-image
ORCL-1.87%
This is purely because market sentiment was good—the market casually tossed out some gold coins, and one just happened to hit me on the head.

When I opened the chart this morning, $ETH had been moving sideways at the bottom for several days. The volume looked like it was gradually picking up, and the signs of funds entering were impossible to hide. I immediately judged that this was accumulation ahead of a breakout, so I opened a long at 2460.01.

It’s now at 2507.72, with returns of +337.29%. Those already on board should be laughing in their sleep, while those who missed it are surely ki
post-image
ETH-0.31%
BTC+0.29%
DOGE-0.50%
Everyone is sleeping on UNI but the numbers refuse to lie.

$UNI /USDT - LONG

Trade Plan:
Entry: 6.256 – 6.300
SL: 6.064
TP1: 6.439
TP2: 6.546
TP3: 6.707

Why this setup?
Why now? The daily trend is firmly bullish, the 1h ATR is sitting at 0.089346 which means volatility is compressed enough for a clean push, and the 15m RSI at 46.71 shows room to run before overbought territory. Entry is anchored at 6.278 with a valid zone between 6.256 and 6.300, targeting TP1 at 6.439 and TP2 at 6.546. The line in the sand is the invalidation level of 6.177, because breaching that proves the setup is de
UNI-0.62%
Everyone calling FLOCK a breakout is about to get blindsided.

$FLOCK /USDT - SHORT

Trade Plan:
Entry: 0.07145 – 0.07381
SL: 0.08393
TP1: 0.06415
TP2: 0.05850
TP3: 0.05003

Why this setup?
Why now? The daily trend is range, meaning the asset has been coiling without a clear direction, and the 1h RSI at 44.57 shows momentum is fading into oversold territory. The 1h ATR of 0.004709 tells us volatility is compressed, so a sharp move toward the entry zone of 0.07263 could ignite a short squeeze. We are targeting TP1 at 0.06415 and TP2 at 0.05850, with the daily range structure favoring downsid
post-image
FLOCK-6.93%
A few days ago I was still calculating whether I had enough money for instant noodles this month; this morning I’m already wondering whether to add sausage. $SKYAI This move started performing right from the opening: dumping, rebounding, then dumping again. No matter how you look at it, it seems like a desperate struggle after running out of steam on the way up. The rebound is weak and selling pressure is heavy—shorting this setup would be the only sensible move. I went short at 0.07390, and some people said I was catching a falling knife. Looking at it now, this isn’t a falling knife—it’s a g
post-image
SKYAI-3.87%
XRP-0.20%
BNB-0.55%
$BTW Signal】4H bullish expansion, go long in the 0.70 range
$BTW RSI 83.53, price 0.70307 is above the Bollinger upper band at 0.6957, and the 4H MACD histogram at 0.0182 is expanding.
Funding rate 0.0889%, OI is flat, and the depth buy/sell ratio is 1.00.
Insufficient 1H data; 4H operating independently.
🎯 Direction: Long
⚡ Entry/pending order: 0.7009608 - 0.7030700
🛑 Stop-loss: 0.6679165
🚀 Target 1: 0.7558002
🚀 Target 2: 0.7821654
🛡️Trade management:
- Execution strategy: Reduce the position by 50% after reaching Target 1 and move the stop-loss up to breakeven. If the price falls bac
post-image
BTW+27.33%
BTC+0.27%
ETH-0.31%
SOL+0.01%
$BTW I missed the first half of this 28% surge, but thanks to a contrarian move, I ended up catching the fattest part of it.
Yesterday afternoon, I placed a buy order at 0.512 because the 24h low of 0.4979 had just been swept once and volume had not expanded—a textbook false breakdown. Half an hour after it filled, the price dumped straight to 0.50, leaving me down 2 percentage points, while the group chat was full of “it’s going to zero.” I made a decision then: instead of cutting my losses, I doubled my position at 0.503. Not because of faith, but because of the trading volume—the 24h volume
BTW+27.08%
#ZECPlungesOver13%
ZEC is interesting right now for one reason: the big rally is still alive, but the easy part of the move may already be over.
The question is no longer “can ZEC pump?” It is whether buyers can defend the latest correction without turning a strong trend into a deeper leverage unwind.
Current Market Snapshot
ZEC is trading around $1,160, with roughly $1.96B in 24h spot volume and a market cap near $19.6B. The latest 24h range is approximately $1,123–$1,213.
The recent move has been extreme. ZEC pushed toward $1,300, then suffered a sharp rejection and leverage flush. That mak
post-image
ZEC-1.10%
$POWER Signal】1H negative funding rate short squeeze, 4H upper-band breakout
$POWER Current price 0.11858, the 4H Bollinger upper band at 0.1140 has been breached, while the 1H upper band at 0.1183 is close at hand. RSI 1H is 78.16, RSI 14 is 92.27, indicating short-term overheating. The 4H MACD bullish histogram is expanding, and the 1H MACD bullish histogram is also growing. Funding rate is -0.1469%, OI Stable, order book depth imbalance is 36.58%, the bid-to-ask depth ratio is 2.15, and dense buy orders are stacked below. Negative funding with a resilient price means the short-covering win
post-image
POWER+35.71%
GOLD OPEN TONIGHT
live-cover
LIVE28
#WeeklyShare
Solana has slipped below the psychologically important $100 level, with SOL/USDT trading around $99.99, down 1.59% over the last 24 hours, according to Gate market data.
The move is small on a percentage basis, but the $100 level matters technically and psychologically. Once a major round-number support is lost, traders usually start watching whether price can quickly reclaim it or whether the level turns into resistance.
The first signal to watch is $99–$100. If buyers defend this area and SOL moves back above $100 with stronger volume, the breakdown could prove to be only a sho
post-image
SOL+0.01%
Range-bound $SOXL /USDT hides a bearish trap most traders ignore right now.

$SOXL /USDT - SHORT

Trade Plan:
Entry: 117.17 – 117.69
SL: 119.88
TP1: 115.59
TP2: 114.36
TP3: 112.52

Why this setup?
Why now? The daily trend is range, and the 1h ATR sits at 1.021919, confirming the volatility is compressed enough for a directional breakdown. The 15m RSI reads 52.33, showing the 1h price has not yet overextended, which keeps the short setup valid. The entry zone between 117.17 and 117.69 aligns with the 1h price of 117.43, offering a precise trigger. From there, TP1 at 115.59 and TP2 at 114.36
SOXL-3.31%
I wasn’t watching the market or thinking about it—it was jumping around on its own, as if working overtime for me. A few days ago before bed, $PRL the rebound was weak, selling pressure was strong, trading volume was low, and there was resistance above, so I casually set up a short order. From 0.33936 to 0.11229, +1316.89%—feeling good, really satisfying.
Close 80% first, leaving 20% with a protective stop. Let profits run if it keeps dropping, and don’t give them back if it rebounds. Waiting for good news; we’ll reassess when a new structure emerges.
Have a strategy before the market opens,
post-image
PRL-4.30%
DOGE-0.50%
ADA+0.72%
$SKHY /USDT is quietly compressing before a violent breakout that nobody sees coming.

$SKHY /USDT - LONG

Trade Plan:
Entry: 180.42 – 180.94
SL: 177.40
TP1: 183.14
TP2: 184.78
TP3: 187.23

Why this setup?
Why now? The daily trend is range-bound, which usually hides explosive directional moves until price finally decides. The 1h ATR of 1.050024 tells us volatility is about to expand, giving enough room for a clean push to the first target. With the 15m RSI at 36.39, momentum is neither exhausted nor overbought, creating the perfect setup for a long entry. The entry zone between 180.42 and 1
SKHY-3.19%
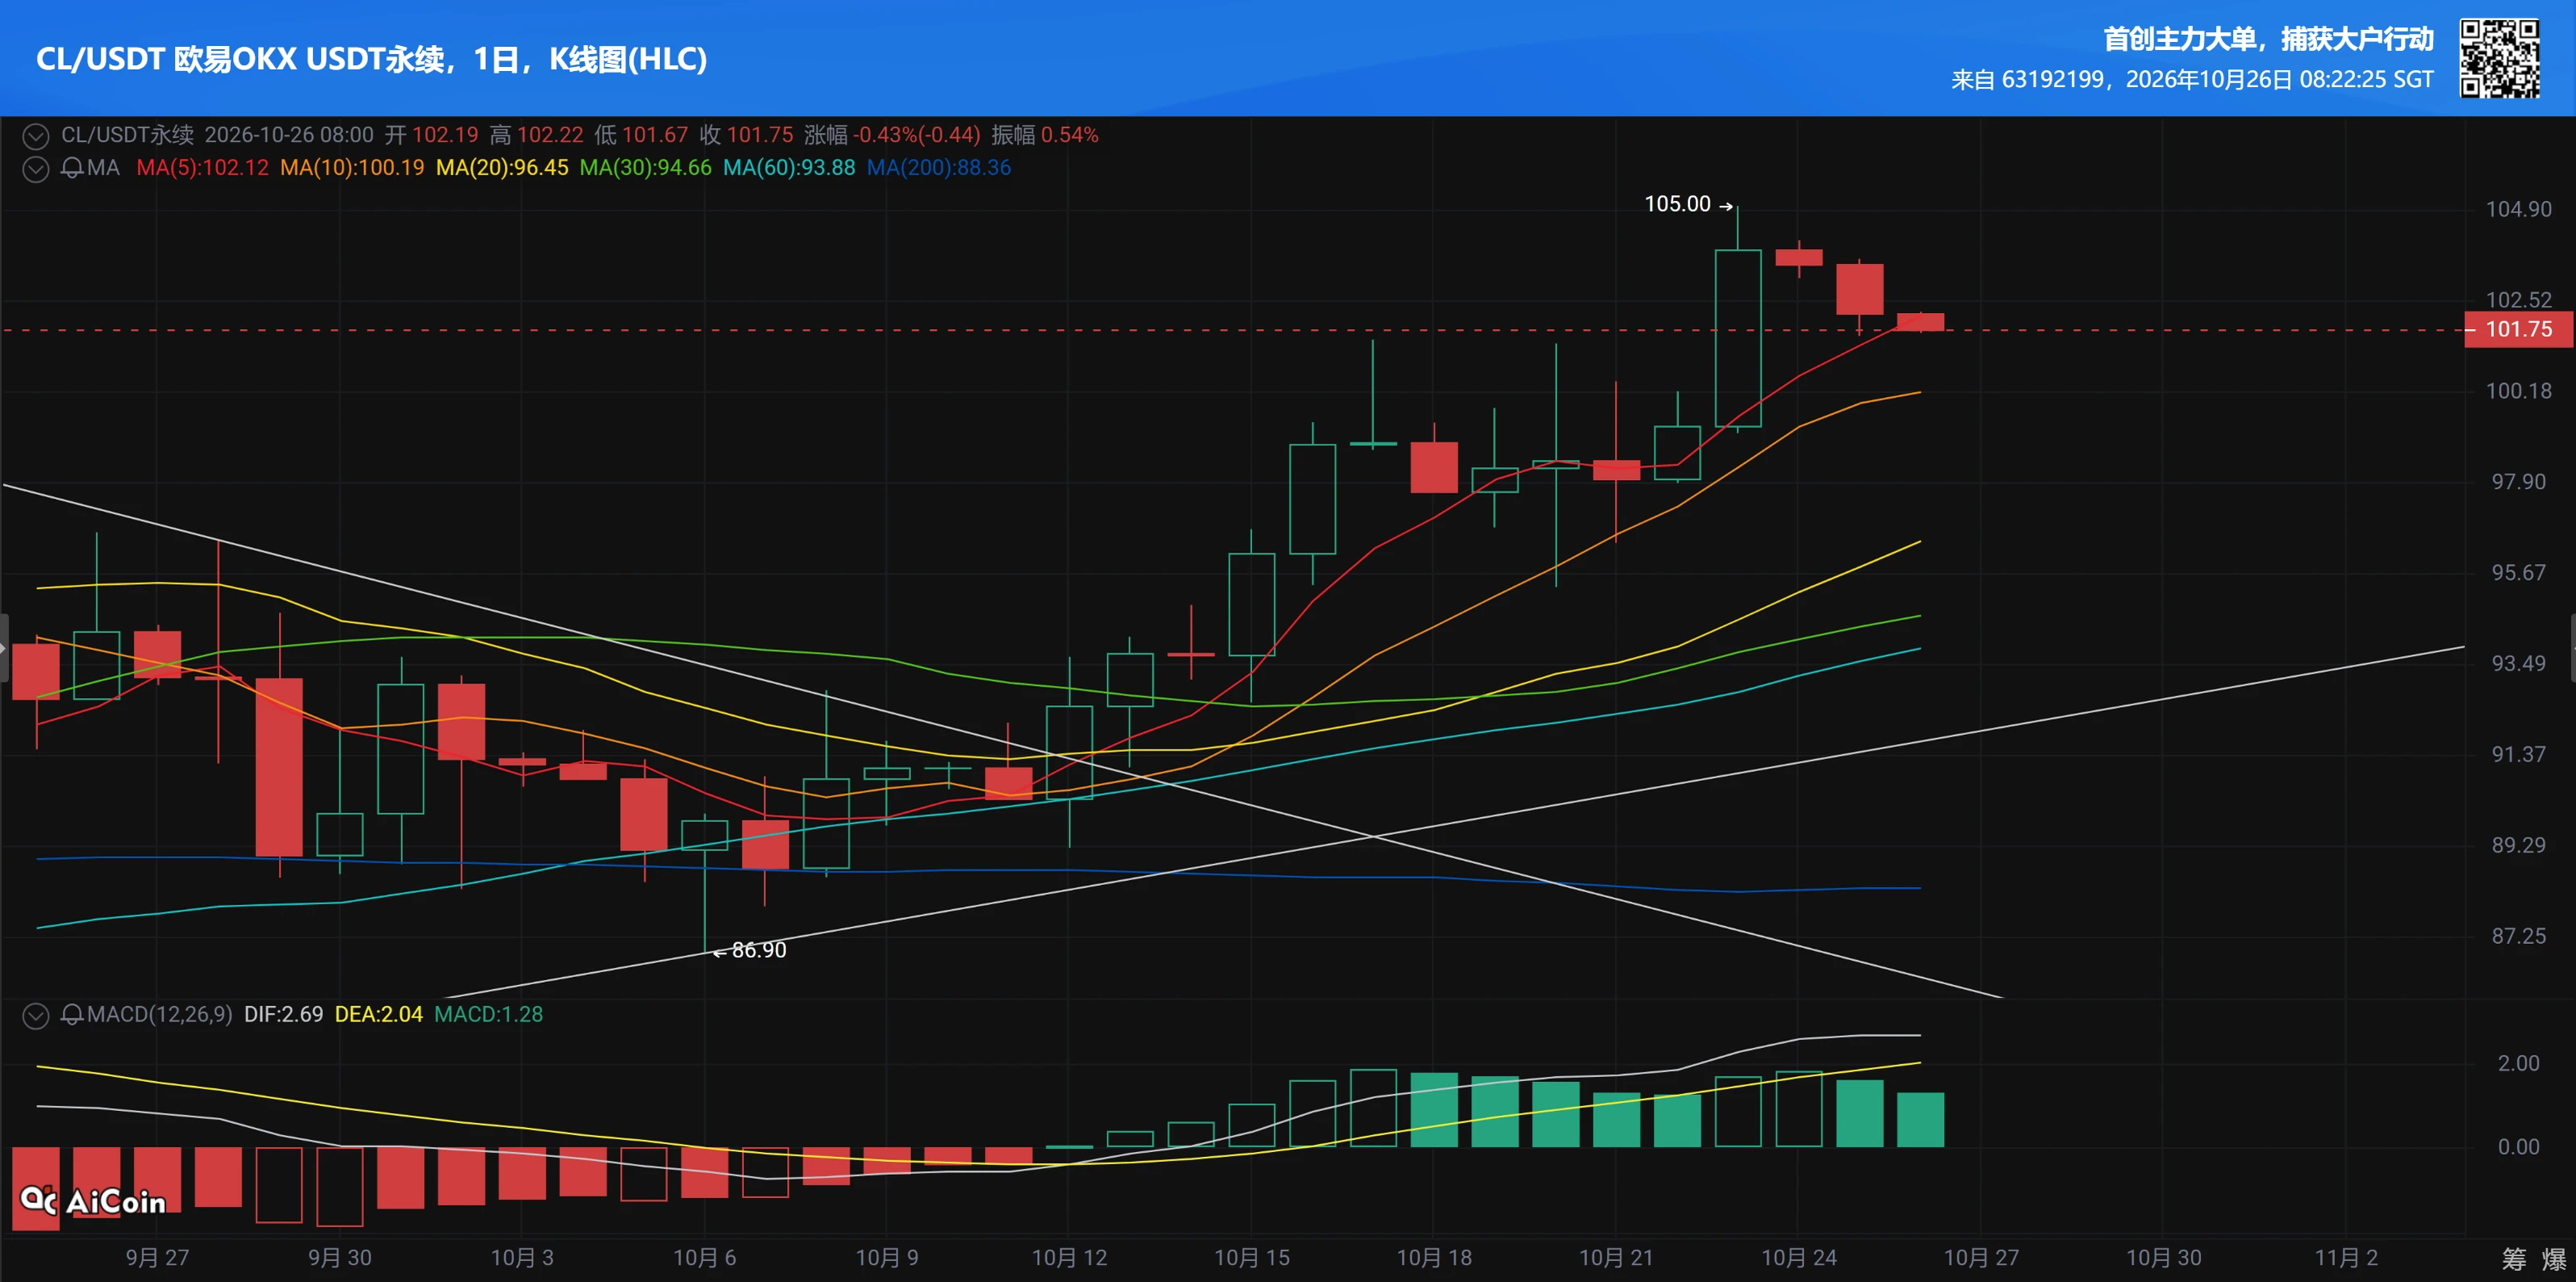
Nobody is talking about the quiet setup forming in $CL /USDT right now.

$CL /USDT - SHORT

Trade Plan:
Entry: 97.17 – 97.35
SL: 98.13
TP1: 96.61
TP2: 96.17
TP3: 95.52

Why this setup?
Why now? The 1h price is holding at 97.26 inside a tight range, but the 15m RSI at 63.43 shows momentum is not exhausted yet. With the 1h ATR at 0.361787, the current consolidation is compressing before a decisive move. The daily trend being range-bound means we are positioned for a directional breakdown rather than a continuation. The entry zone between 97.17 and 97.35 offers a precise trigger, with TP1 at 9
CL+1.64%
#Gate主流CEXTop4
August delivered a useful signal for the global crypto exchange market: trading activity recovered sharply, but the recovery was not distributed evenly across every venue. Total centralized-exchange volume climbed 12.7% month over month to $4.29 trillion, with spot volume rising 18.7% to $891 billion and derivatives increasing 11.3% to $3.40 trillion. Against that broader recovery, Gate maintained its position as the 4 global CEX by combined spot and derivatives volume, processing roughly $327 billion during August.
The composition of that $327 billion is more important than th
post-image
BTC+0.29%
ETH-0.31%
AAPL+1.71%
Nobody is talking about the $XAU /USDT setup hiding in plain sight right now.

$XAU /USDT - SHORT

Trade Plan:
Entry: 4347.6 – 4349.8
SL: 4359.4
TP1: 4340.7
TP2: 4335.4
TP3: 4327.3

Why this setup?
Why now? The 1h price is 4348.7, sitting at the exact entry_ref, while the daily trend is range, meaning this market has been coiled and waiting for a directional snap. The 15m RSI is 46.93, a barely-bearish reading that signals momentum is leaning down without being oversold, so a short has room to breathe. The 1h ATR is 4.448837, which tells us this is a volatile enough session that a clean mov
XAU-0.19%
Load More

Join 40 M users in our growing community

⚡️ Join 40 M users in the crypto craze discussion

💬 Engage with your favorite top creators

👍 See what interests you