





Square
Following
Hot
News
Profile
Share your thoughts
placeholder
Article
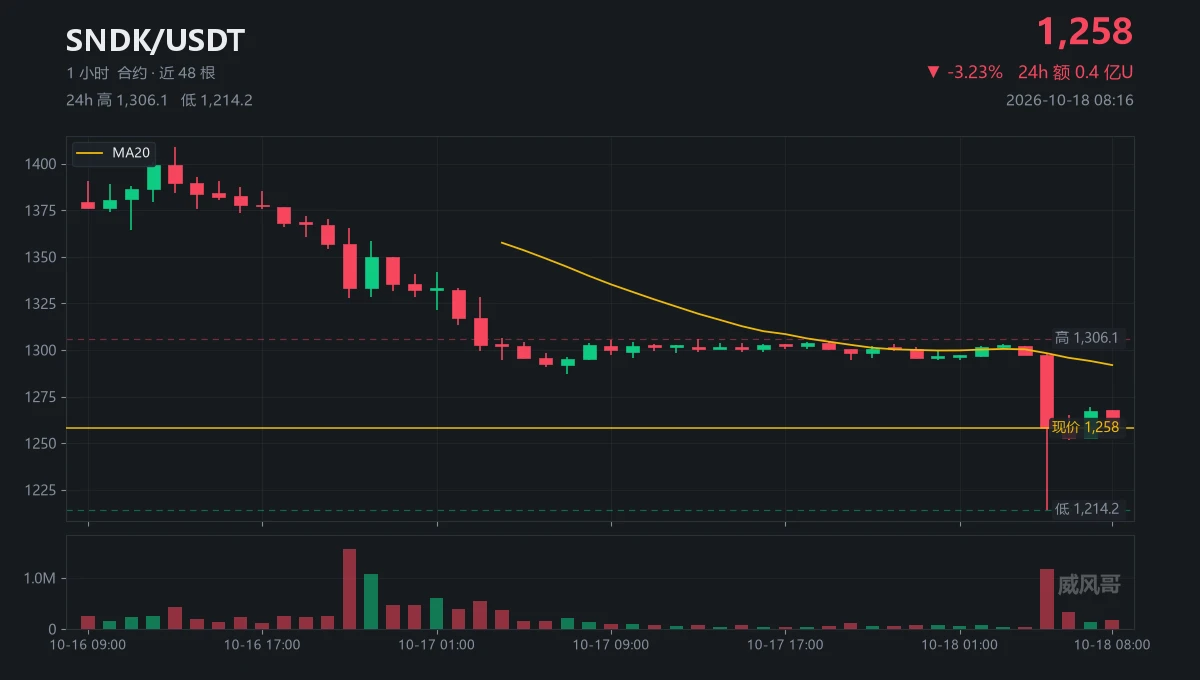
After going through forty-eight candles, there’s one I’m not comfortable fast-forwarding through.
A wick spike.
The 05:00 candle plunged to 1214.16, while the previous one was still above 1297.
Volume picked up: 1.17 million in a single hour, compared with just 35,000 in the previous one.
It rebounded to 1269.44 over the next three hours, but has now slid back to 1257.97.
The peak at 1408.95 was reached at 13:00 on 10-16; after that, each high kept moving lower.
$SNDK In forty hours, it went from 1408.95 to 1214.16, a drop of 13.8%.
As usual: a low formed on heavy volume only counts if it hold
post-image
SNDK-3.19%
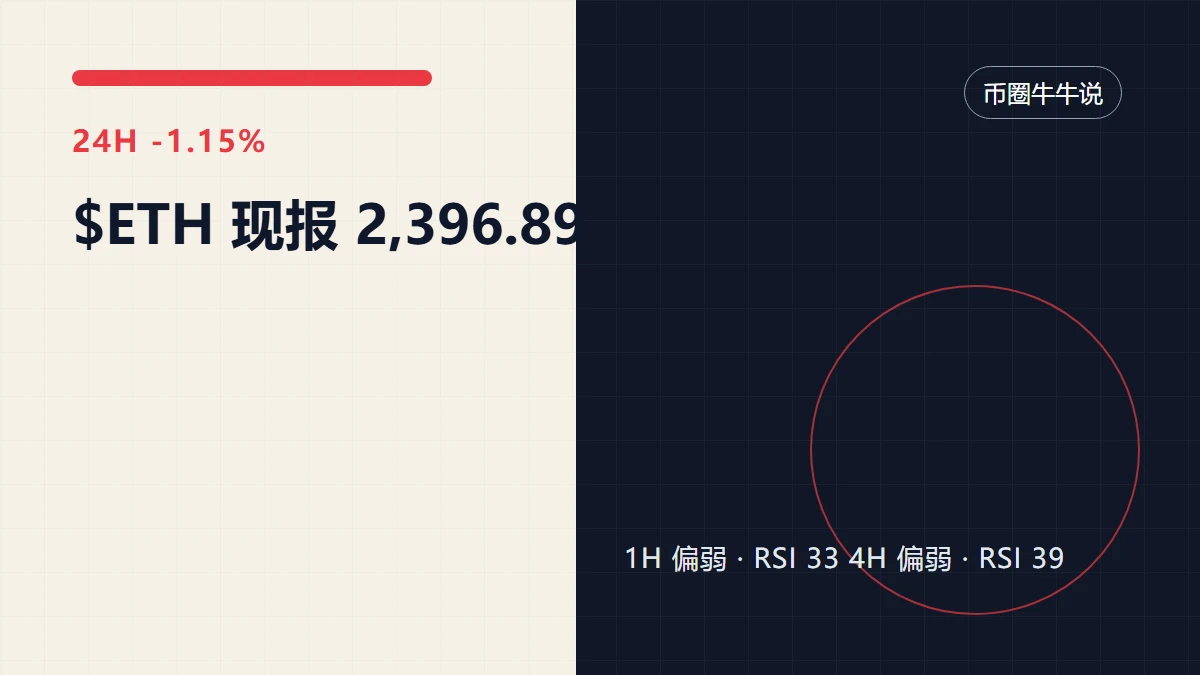
$ETH is currently at 2,396.89, down 1.15% over 24 hours, with volume at 0.12 times the average over the past 20 candles. Put these figures together, and the key point to explain is that $ETH’s price has already moved, but trading activity and volume have not followed.
One verifiable update: Gate’s official announcement reads, “Gate Research: Corporate Earnings Support U.S. Stocks, KR1 Launches Ethereum Validator Nodes…”. It may explain why people are paying attention, but it cannot answer which way the price will move.
You can tentatively trust the direction, but not assume the move will conti
post-image
ETH-0.88%
Trenches
AGT
A
bade
b
AGT
0x5d...e274
Market Cap
$.
Change
.
24h Vol
$.
Holders
.
CNPY
C
bade
b
CNPY
0xc6...ddd2
Market Cap
$.
Change
.
24h Vol
$.
Holders
.
COVENANT
C
bade
b
COVENANT
0xcd...de79
Market Cap
$.
Change
.
24h Vol
$.
Holders
.
Q
Q
bade
b
Q
0xc0...0589
Market Cap
$.
Change
.
24h Vol
$.
Holders
.
Gato
G
bade
b
Gato
55A3...pump
Market Cap
$.
Change
.
24h Vol
$.
Holders
.
Something doesn't look right. $AVA is currently at 0.3957, up 34.73% in 24 hours, but look at this candle—the low was 0.2810, the high was 0.4226, a 50% swing, with $72.9M in trading volume. This isn't normal turnover; someone's aggressively sweeping up.
Three possibilities: first, someone positioned early in the derivatives market, with spot buying helping push the price up; second, low-priced holders have finished rotating their positions, and the whales are testing the selling pressure above; third, it's a pure sentiment-driven short squeeze, with 24-hour volume piling above $70M as short-
AVA+37.11%
If you had invested $10k in the best-performing assets a month ago, the difference in returns would be astonishing...=> $NEA
=> $AD
=> $LIN
post-image
LIN+1.04%
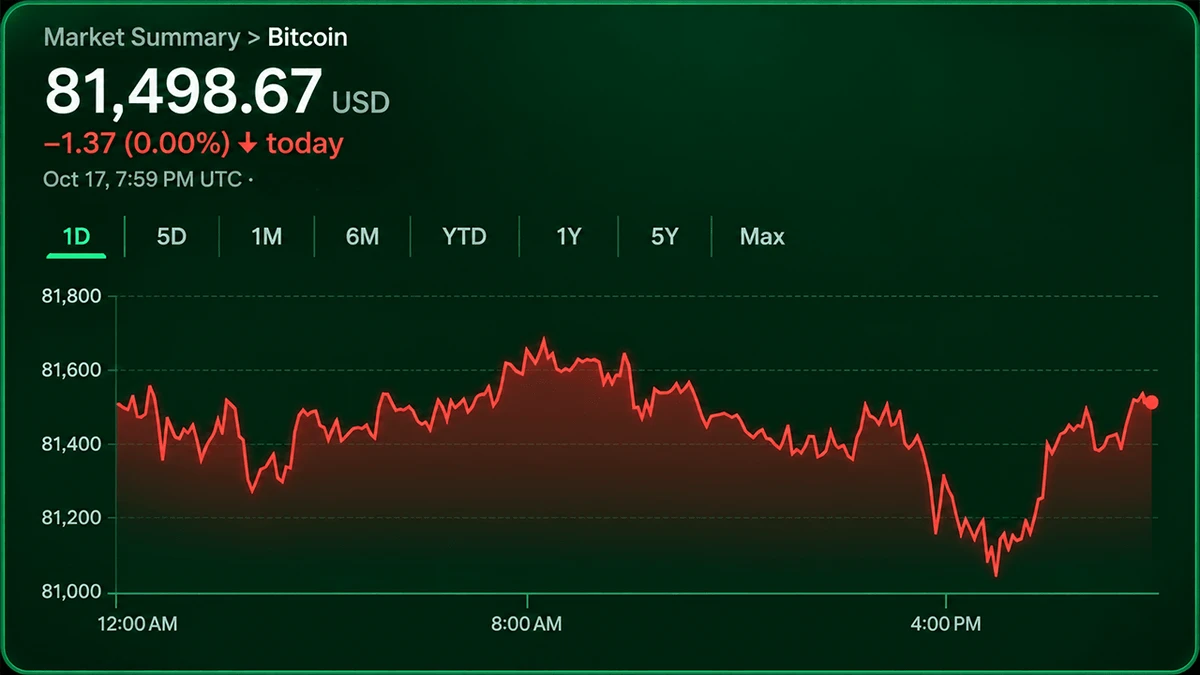
Bitcoin at $81,500 as bulls and bears lock in a tug-of-war
Bitcoin is trading around $81,500 on October 17, 2026, caught in a technical standoff that has left the market searching for direction. Short-term moving averages are flashing bearish signals, while longer-term averages continue to support buyers. The Relative Strength Index (RSI) sits at 46, and the overall technical assessment remains neutral.
With a market cap of roughly $1.639 trillion, daily trading volume of $13.967 billion, and a 24-hour range spanning $81,108.80 to $81,733.01, the market is locked in a tight consolidation patte
post-image
BTC-0.21%
#DOGE #WCTCS9 Dogecoin May See Its First Major Daily Death Cross of 2026: Is a Potential Trend Reversal Coming?
A potential trend reversal could offset bearish pressure and invalidate the current pattern.
Dogecoin could see its first daily death cross of 2026 as moving averages suggest they will converge in the coming days. The daily 50-day moving average is currently trending downward, while the daily 200-day moving average is flattening, highlighting the potential for a death cross. Dogecoin saw its first daily golden cross since 2026 in October, but profit-taking in the crypto market drove
post-image
ThisIsTranslateContent:
#DOGE #WCTCS9 Dogecoin may see its first major daily death cross of 2026: Is a potential trend shift approaching?
A potential trend shift could counter bearish pressure and invalidate the current setup.
Dogecoin could see its first daily death cross of 2026, as moving averages point to convergence in the coming days. The daily 50-day moving average is currently sloping downward, while the daily 200-day moving average is flattening, highlighting the potential for a death cross. Dogecoin saw its first daily golden cross of 2026 in October, but profit-taking in the crypto market drove its price down to a low of $0.077. Bears seem to be making an aggressive effort to negate this bullish signal, with the possibility of a death cross drawing near.
The timing of a death cross remains uncertain, as a trend shift could counter the bears’ push and invalidate the current pattern. At the time of writing, Dogecoin was up 3.19% over the past 24 hours to $0.081, after briefly selling off as investors weighed higher-than-expected inflation data and the latest remarks on interest rates from Fed Chair Kevin Warsh.
Inflation data released this week was strong: the Producer Price Index released Thursday showed wholesale prices rose 6.3% year over year in September, the biggest increase since 2022. The Consumer Price Index also rose in data released Wednesday. Fed officials responded in September by approving the first rate hike in more than three years; markets expect the Fed to hold rates steady in October and hike again in December.
Could a trend shift be coming? The last time Dogecoin saw a death cross on the daily chart was in November 2025, followed by months of selling until a golden cross appeared recently. This has focused market attention on price action in case a death cross ultimately appears again.
Crypto analyst Ali recently posted a contrarian take on X, sharing three reasons to be bullish on Dogecoin.
First, the TD Sequential indicator has previously marked potential turning points for Dogecoin several times, and this time it issued a buy signal on the daily chart as the price neared $0.081.
Second, URPD data shows that about 36 billion DOGE previously traded near $0.081.
Third, whales appear to be buying near this support level, having accumulated 600 million DOGE since October 12.
If $0.081 holds and Dogecoin rebounds, Ali identifies the $0.16 to $0.17 range as a potential profit-taking zone. $DOGE

repost-content-media
DOGE-1.74%
Strong rebound in the main FVG zone on the 1-hour chart, with a pullback expected to the main liquidity area around $0.255–$0.260. ‼️Long $GTC Entry price: 0.235 - current price Take profit: 0.257 Stop loss: 0.215 Trade here $GTC 👇
post-image
GTC
GTC芝麻币
Gate.Fun
MC:$0.1Holders:1
0%
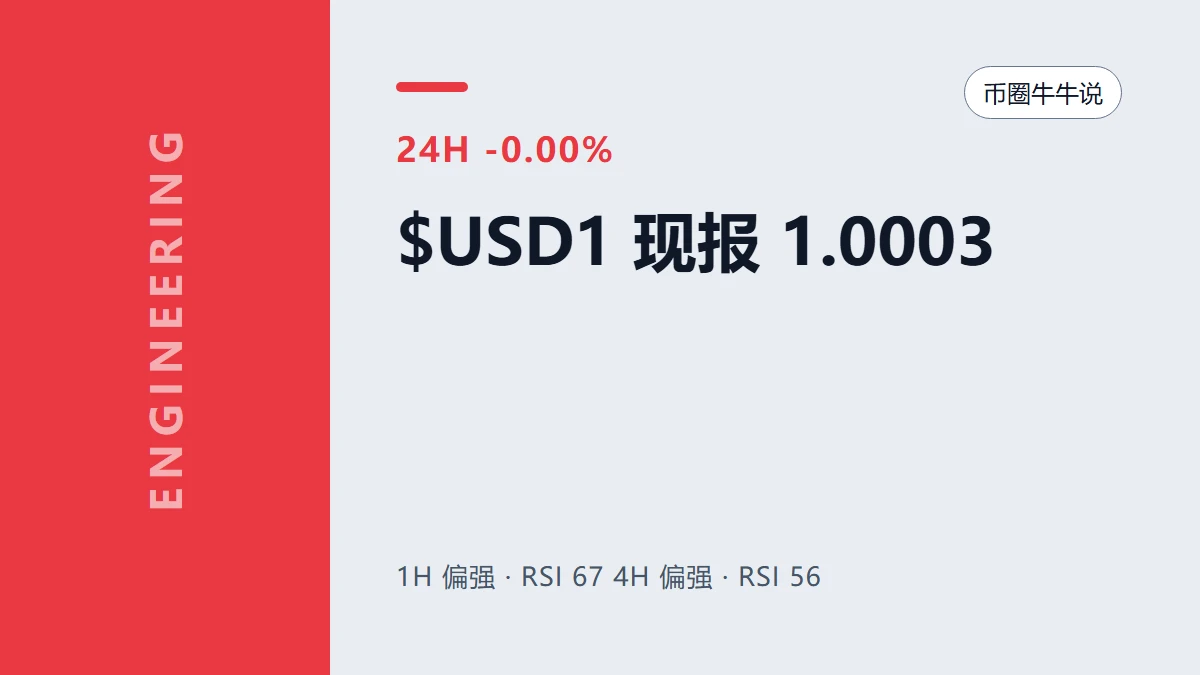
$USD1 has reached 1.0003USDT, but hourly trading participation is only 0.30x, making the move look somewhat weak. The price has moved, but volume has not followed. In this situation, focusing only on candlestick colors can easily lead you to overestimate the move’s staying power. The price has already broken above the 1-hour support at 1.0001, while the 1-hour resistance at 1.0004 still lies ahead. This looks more like a tentative breakout than the start of a genuine trend.
If 1.0004 is actually broken, the credibility of this rally will improve significantly. But low participation currently u
post-image
USD1-0.01%
I really like this feature of ChatGPT: Based on your recent work, email exchanges, recent activity and changes in cloud storage services like Google Drive, as well as changes to GitHub repositories, it reminds you of some things that may need attention.
This gives you the feeling of having an Agent proactively helping you work, moving tasks forward, and identifying problems. I think this is the main form the future will take. You don't need to worry about things yourself—it brings the tasks you need to handle right before your eyes, and all you have to do is make decisions.
The only downside i
post-image
The Polish prime minister said outright that they’re preparing for war with Russia. Two years ago, that would’ve sounded alarmist. Now nobody’s laughing. As the U.S. shifts its focus, Europe will have to handle Ukraine on its own. If it can’t, Poland’s border will be the next line. The great powers step back, and the frontline countries pay the price. If you think I’m talking nonsense, take a screenshot and save it.
post-image
$STRK This 12.86% plunge is a high-risk game, so I placed a limit order at 0.0635 and picked up the first batch. First, a position update: I’m currently flat and waiting for an entry. I closed yesterday’s short from 0.0710 at 0.0652 to take profit, capturing most of this drop. The 24h low of 0.0631 landed right at the lower edge of a previous high-volume trading zone. Turnover of 148.9M is clearly up, suggesting that some buyers are picking up coins amid the panic selling. But the large bearish candle from 0.0747 to 0.0631 had no meaningful rebound, so short-term sentiment remains bearish.
My
STRK-11.68%
EIA data determines the short-term direction of crude oil
live-cover
LIVE1,413
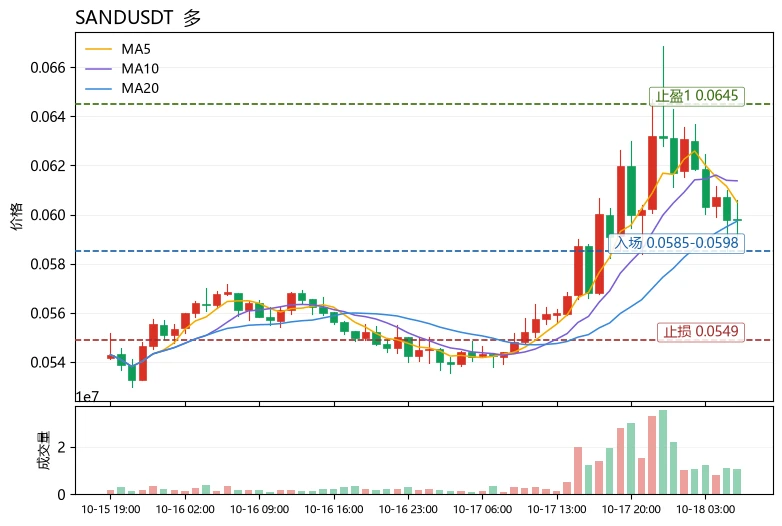
$SAND Bottom line: Short-term bias is bullish, but this is a short squeeze driven by crowded shorts, not a trend reversal. Wait for a pullback confirmation before chasing higher.
The funding picture is the key factor right now. The funding rate is -0.1930%, making it extremely costly to hold short positions, while the price has risen 9.97% over 24h to 0.05978, indicating that shorts are being squeezed and funding is being pushed toward the long side. But beware: the MACD histogram remains negative at -0.00023, and the RSI is only 52.7, so momentum is unconfirmed; the range over 30 candles is a
post-image
AVAX-1.67%
Set it up this way to automatically clean up 99% of comments.
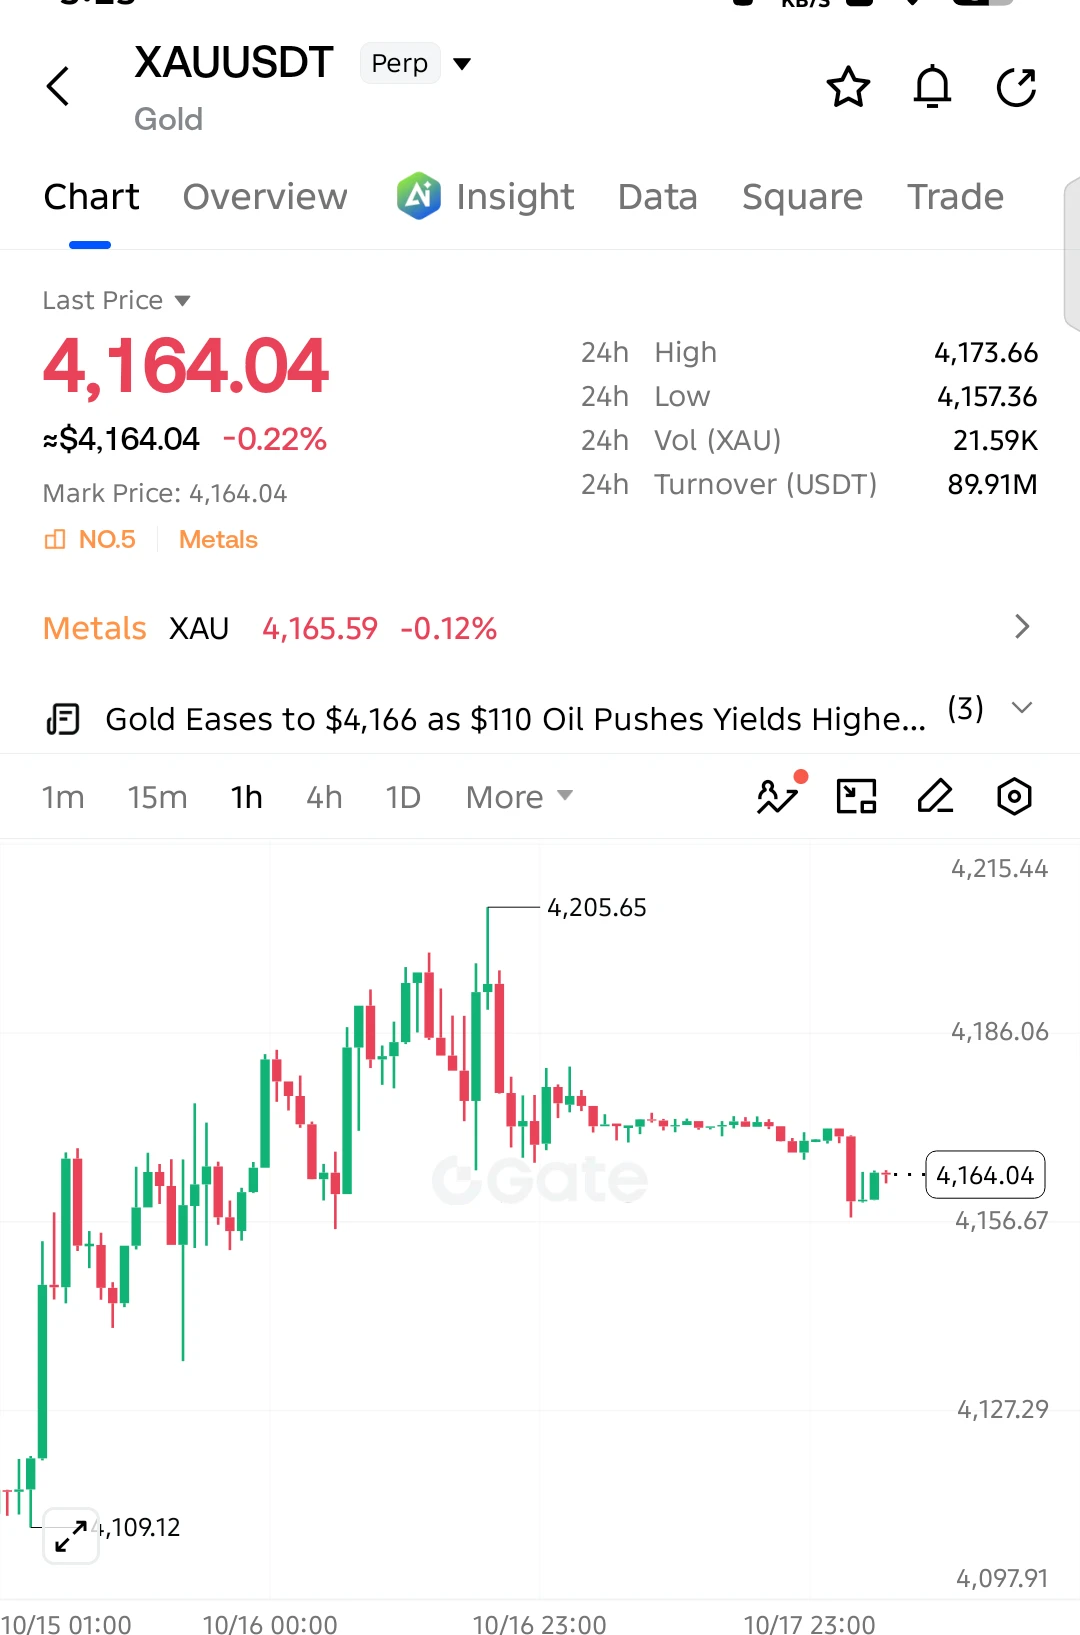
$XAU SHORT SETUP — GOLD FACING SELLING PRESSURE 📉**
Entry: 4164 – 4172 (Short)
SL: 4182
TP1: 4155
TP2: 4145
TP3: 4130
Gold is struggling to recover after rejection from 4205.65. Buyers look weak, and sellers are defending the recovery.
As long as 4182 holds, another downside move remains possible.
**Watch for rejection near entry before taking the trade.**
post-image
XAU-0.19%
  • 2
$BTC Tonight’s market action is interesting. I’m still watching. What’s really worth keeping an eye on isn’t these minute-by-minute moves in BTC, but the Altcoin Season Index climbing from 50 to 60—a frustrating middle ground, neither here nor there. It shows that capital is starting to venture out from BTC, but we’re not yet at a full-on risk-on phase: 60 looks more like the “early stages of rotation,” still a long way from the 80–90 range where everything has historically taken off. In other words, altcoins have potential, but it’s not time to sit back and expect easy gains just yet.
celesti
post-image
BTC-0.25%
TIA-6.08%
#KOSPIJumps3.3% #ShareWeekly
KOSPI Rebounds After a 7.6% Crash: Is the Semiconductor Sell-Off Over, or Is More Volatility Ahead?
The Asian stock market experienced a dramatic shift on October 15–16, 2026, as semiconductor stocks came under heavy selling pressure before staging a partial recovery. South Korea’s KOSPI index suffered a sharp 7.6% decline on October 15, dropping to 5,554 points and triggering a circuit breaker. The index touched its lowest level since April, highlighting how quickly market sentiment can change when inflation concerns, interest-rate expectations, and uncertainty s
SK Hynix+0.79%
JPN225+0.29%
NAS100-0.53%
CXMT-1.78%
$GTC Strong rebound from the key FVG area on the 1-hour chart; expected to pull back to the major liquidity zone around $0.255 to $0.260.‼️
Long $GTC Entry: 0.235 - Current price Take profit: 0.257 Stop loss: 0.215 Trade here $GTC 👇
post-image
$Online Loan Life: Borrow money to enter the market, stay up all night watching charts, and keep adding to the position.
Act like nothing’s wrong during the day; stare blankly at red candles at night.
When liquidation hits, debt collection texts arrive more punctually than market moves.
Interest keeps accruing, but the position is down to zero.
We’re not gamblers, just ordinary people trying to survive in crypto.
Online loan life: the most honest portrait of crypto bros.
post-image
Load More

Join 40 M users in our growing community

⚡️ Join 40 M users in the crypto craze discussion

💬 Engage with your favorite top creators

👍 See what interests you

Trending Topics

USSeptemberPPIBeatsExpectations

91.35k Views1.93k Discussing

US September PPI came in at 6.3% YoY, well above the 5.3% market expectation, pointing to renewed producer-side inflation pressure. Weekly jobless claims were 199K, broadly in line with forecasts. Could hotter inflation further reduce room for rate cuts, and what does it mean for $BTC, US stocks, and gold?

GateWCTCS9GlobalTradingCompetition

37.87k Views6.68k Discussing

GateBTCAndETHFuturesVolumeRanksTop3

53.8k Views1.81k Discussing

View More