Share your thoughts
placeholder
Article
Major CPI release tonight! Get ahead of 3 market scenarios

Yesterday’s initial jobless claims came in at 206,000, showing steady data; PPI rose 5.4% year-over-year, significantly exceeding expectations, and BTC immediately plunged after the data was released.
CPI takes center stage at 20:30 tonight, with the market expecting 3.4% year-over-year and core CPI at 2.4%.

The real key is not the numbers themselves, but rate hike expectations: CME rate hike odds have already surged to 72.4%, compared with just 49% a week ago. The market has already priced in the possibility of a rate hike.
The si
post-image
BTC-1.20%
ETH-0.17%
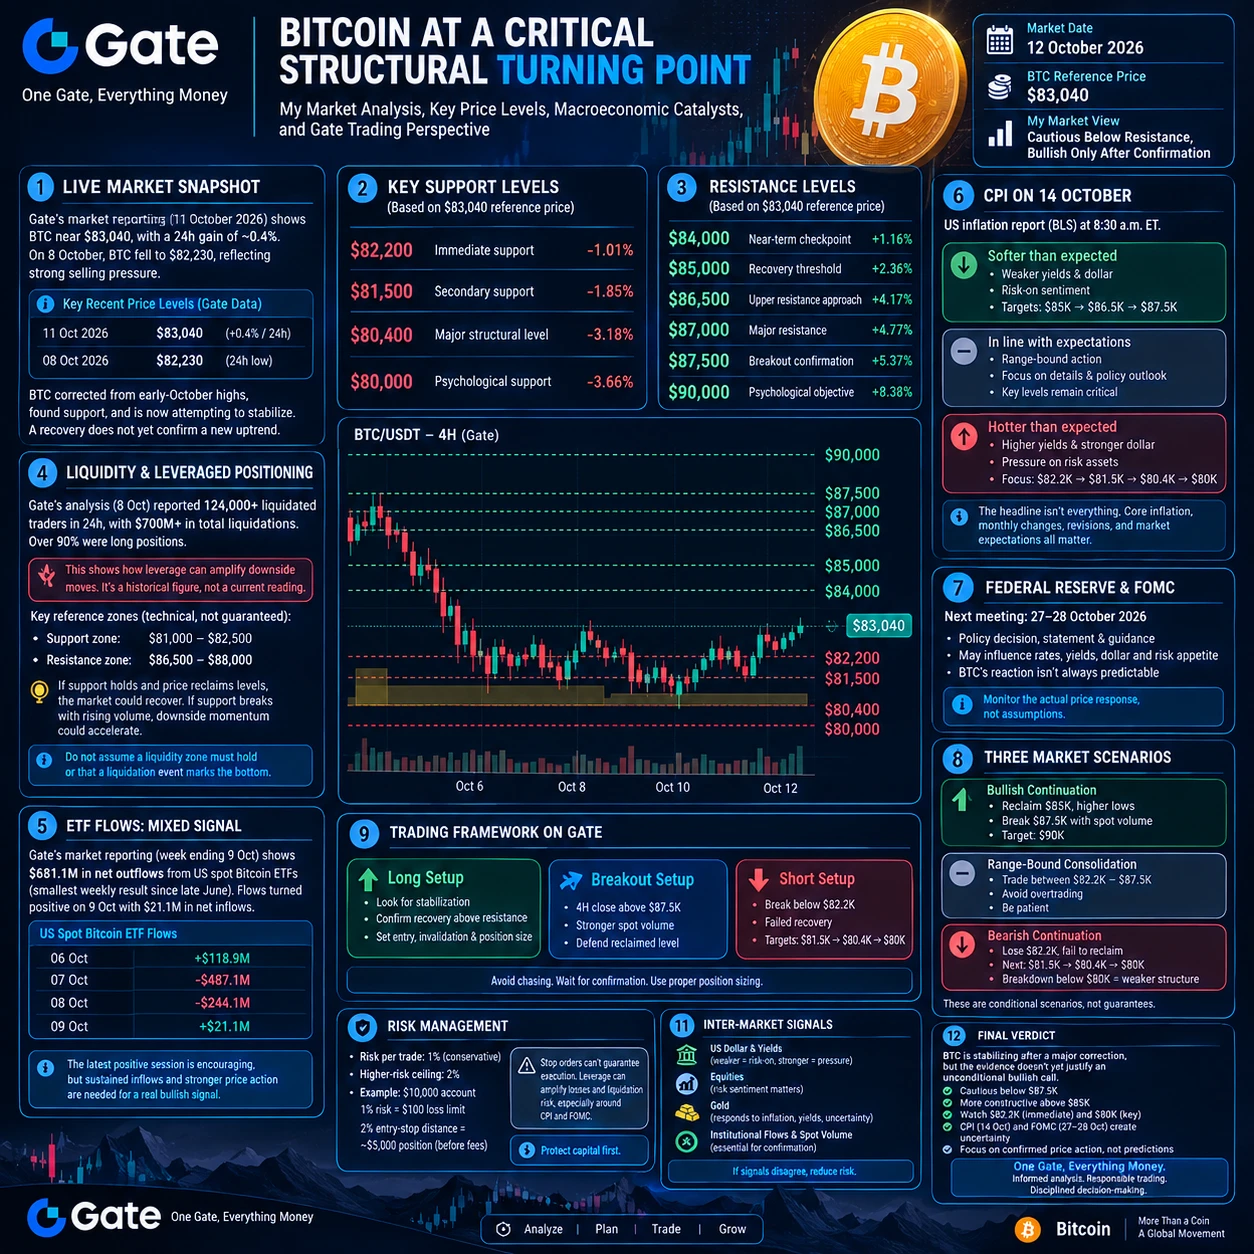
⚡Tonight’s CPI report is here! Will it directly determine whether the Federal Reserve raises rates in September?
Market expectations: headline CPI +0.4% month over month and core CPI +0.2% month over month. With both PPI and nonfarm payrolls coming in stronger than expected, plus crude oil breaking above $100, the probability of a September rate hike has now surged to 70%. Tonight’s CPI report could be the final catalyst.
Three scenarios
🔴CPI comes in above expectations (inflation rebounds): Rate hike expectations continue to rise, Treasury yields spike, and the dollar strengthens.
👉High-val
post-image
GLDX-1.17%
PAXG-1.08%
BTC-1.25%
ETH-0.25%
Nobody is talking about the quiet setup forming inside $CL /USDT right now.

$CL /USDT - SHORT

Trade Plan:
Entry: 95.68 – 96.28
SL: 98.84
TP1: 93.83
TP2: 92.40
TP3: 90.26

Why this setup?
Why now? The 1h price is pinned at 95.98 inside a range-bound daily trend, giving the short bias a structured playground. The 15m RSI sits at 34.74, signaling exhaustion without yet triggering a panic flush. The 1h ATR of 1.192224 tells us volatility is compressed, so a clean breakdown could unfold rapidly. The entry zone between 95.68 and 96.28 aligns perfectly with that pinned 1h price, offering a tight
CL+0.89%
$TA /USDT Perp – "Heavy Breakdown – Short"**
**Trading Plan Short $TA
Entry: 0.0475
SL: 0.0495
TP1: 0.04579
TP2: 0.04417
Explanation: Sharp drop from the 0.05370 high, failing to hold the 0.04927 yellow line. MACD is negative. Targeting the 0.04579 purple support, with an extension to 0.04417.
#weeklyshare
post-image
TA-15.98%
  • 5
  • 2
XRP is coiling tighter than most traders expect right now.

$XRP /USDT - LONG

Trade Plan:
Entry: 1.3207 – 1.3263
SL: 1.2887
TP1: 1.3496
TP2: 1.3670
TP3: 1.3930

Why this setup?
Why now? The daily trend is range-bound, which usually traps breakout traders, but the 15m RSI is sitting at 24.94, signaling a sharp short-term oversold bounce is overdue. The 1h ATR of 0.011143 tells us the next hourly move will be volatile enough to push through the entry zone near 1.3235. If that bounce triggers, the first target is TP1 at 1.3496, followed by a deeper test of TP2 at 1.3670. The real line in the
XRP-3.52%
I wasn't watching the charts or using my brain—it was jumping around on its own, like it was working overtime for me. During the repeated intraday fluctuations, I saw that the rebound was weak and the resistance above was too obvious. Every upward push fell just short, so I went straight into a short position.
I entered at 0.02694, and it has already been pushed down to 0.00819, with the return firmly holding at +1703.96%. The late nights weren't in vain—this short position really delivered. Those already on board must have woken up laughing, right?
The market is won by waiting, and profits ar
post-image
BNB-0.59%
SNDK-2.31%
[CPI]🔹U.S. August CPI is about to be released, with the market expecting headline CPI to rise appr
live-cover
LIVE2,082
📌 #ASTER
The range movement that has continued since February is still ongoing. Although it moved upward in recent days, it failed to hold. Therefore, it can essentially be traded within the $0.57–$0.77 range.
⚠️ #This is not a promotion or investment advice. The chart and commentary are for analytical purposes.
post-image
ASTER-4.37%
Nobody is talking about the quiet move forming inside NEAR right now.

$NEAR /USDT - LONG

Trade Plan:
Entry: 2.4391 – 2.4705
SL: 2.3038
TP1: 2.5681
TP2: 2.6436
TP3: 2.7569

Why this setup?
Why now? The daily trend is firmly bullish, setting the stage for continuation. The 1h RSI at 52.79 shows room to run before overbought, while the 1h ATR of 0.062933 confirms real volatility is present. The entry zone sits at 2.4548, offering a precise fill above the 1h price of 2.4550. We target TP1 at 2.5681 and TP2 at 2.6436, but the line in the sand is the invalidation level at 2.2339.

Debate:
Are
NEAR+0.79%
Daily target: $300–500 in profit. Anyone interested in joining and following each other?
post-image
CPI Is Coming! Rate-Hike Expectations Are Rising
live-cover
LIVE1,873
I was just about to head to the forum and rant, but then I checked my account—never mind, the market is always right. During the intraday bottoming grind, I almost thought this trade would drag on into next quarter.
The logic isn’t complicated: buying pressure is strengthening, and there are buyers whenever it gets dumped—things are just moving slowly. I went long around 1206.57, and I said at the time: the longer it grinds, the more abruptly it will move.
Sure enough, $OPENAI is now at 1501.92, with +482.64% secured. It was truly sluggish at first, but the move feels great now that it’s under
post-image
OPENAI-2.31%
BNB-0.59%
ZEC-10.69%
The reason OpenAI paused its $200 Pro membership tier is simple: does a gym owner prefer customers who sign up and come once or twice a month, or those who buy an annual membership and come every day?
post-image
$BTC is starting to look very similar to the previous cycle bottom.
September brought the weakness first. price pushed lower before the real bottom formed, then Q4 became the turning point and the bigger rally followed.
we’re seeing a similar setup again.
This September weakness could be the final shakeout before the Q4 reversal.
and if the same cycle structure plays out, $150K–$170K by 2029 starts looking very interesting.
post-image
BTC-1.25%
XRP formed Wave 1 on the daily time frame & continued consolidating.
We see the sinusoidal (up-and-down, like a radio wave) movement inside the green zone, which is normal.
The Bull Flag pattern continues, so we can expect a strong reversal as long as the green zone is intact.
$1.33 is the key support, and $1.88 is the key target!
⁽ⁿᵒᵗ ᶠⁱⁿᵃⁿᶜⁱᵃˡ ᵃᵈᵛⁱᶜᵉ ᵇᵘᵗ ʲᵘˢᵗ ᵐʸ ᵗʰᵒᵘᵍʰᵗˢ ᵒⁿˡʸ⁾
Enjoy your Friday!
post-image
XRP-3.67%
No conviction, can't hold on—the profit on this move is paper-thin, but I love it. When I checked the chart after lunch, $SKHYNIX held on the pullback, with solid support below. I figured it could push a bit higher, so I told everyone not to mess with their long positions. Choppy markets are the most grueling, but the structure hasn't broken, so what's there to panic about?

From 1235.91 to 1360.14, +712.75% landed in your hands. The grind earlier was maddening, but now all I can say is it was worth it.

Take 80% profit first and protect the remaining 20% at breakeven. Move the stop loss to
post-image
SKHYNIX-0.99%
SNDK-2.31%
ZEC-10.69%
#AugustCPIDropsTonight August CPI Drops Tonight
Tonight we get the August Consumer Price Index report and it is the single most important data release this month for markets, for policy, and for households. The numbers come out this evening and they will directly influence expectations for interest rates, for equity positioning heading into Q4, and for how consumers feel about their budgets going into the holiday season.
I have been watching inflation data closely all year because 2026 has been a year of transition. We moved from the high inflation period of 2022 and 2023, into the cooling pha
  • 1
100-10000
or
100-0
Next-day record
Currently 115
post-image
$BTC is doing what it does best — chopping sideways, building the base for the next leg. Most people forget that Bitcoin spends 70-80% of its time in ranges, not ripping faces. The explosive moves? They're the minority. The real work happens in consolidation — price absorbing supply, sweeping liquidity, setting up the spring.
Right now we're mid-range. No breakout imminent. I'm looking at $90K–$95K as the next upside target once this thing finally breaks, but that's not a December story. More likely late Q1 2027. Until then, expect chop, fakeouts, and patience.
This is accumulation. If you're
post-image
$IOST /USDT Perp – "Steep Downtrend – Short"**
**Trading Plan Short $IOST
Entry: 0.000935
SL: 0.000980
TP1: 0.000894
TP2: 0.000870
Explanation: Downtrend from the 0.001058 peak. Shorting the weak bounce targets the 0.000894 purple support, with a secondary target of 0.000870.
#weeklyshare
IOST-14.72%
  • 5
  • 1
Load More

Join 40 M users in our growing community

⚡️ Join 40 M users in the crypto craze discussion

💬 Engage with your favorite top creators

👍 See what interests you

View More