Square
Following
Hot
News
Profile
Share your thoughts
placeholder
Article
[ NEW STREAMER ] TODAY MARKET TALK
live-cover
LIVE2,027
Korean Stocks Plunge Enough to Trigger Trading Curbs! KOSPI activates its sidecar mechanism. Is a bi
live-cover
LIVE2,672
🚨 BITMINE CONTINUES ACCUMULATING ETH, TARGETING 5% OF TOTAL SUPPLY
Bitmine has just purchased another 12,532 ETH (~$32 million), raising its holdings to over 6 million ETH.
The company is only about 76,000 ETH away from its goal of owning 5% of ETH’s total supply and will stop buying once it reaches this milestone.
According to Tom Lee, the next growth cycle could be the largest in crypto history, driven by 4 key forces:
1️⃣ Asset tokenization: Expanding blockchain applications into traditional finance.
2️⃣ Younger generations: Inherited assets could drive new capital into crypto and stocks.
post-image
BMNR-0.89%
ETH-1.36%
Middle East oil tanker attacked! $CL Plunged after surging to 94— is 91.9 a bull trap?
Brothers, oil prices driven up by war always come back down the way they went up. Don’t catch a falling knife amid the sound of artillery!
The attack on an oil tanker in the Middle East, coupled with uncertainty over an energy ceasefire between Russia and Ukraine, sent Brent above 107 and WTI past 94, with risk aversion running high. CL is currently at 91.92. After surging from 89.21 to a high of 93.69, MACD formed a death cross at elevated levels, the green bars expanded, and RSI fell to 27, indicating extr
post-image
CL+2.16%
META+3.39%
Jupiter routed $13.40B in Solana swaps in the past 30 days, nearly half of the $28.52B that went through all aggregators on the network. DFlow ranked second at $9.09B.
@JupiterExchange
JUP-8.13%
Friendly reminder:
The bull market will be over in 962 days!!!
#牛来 #MarsCoin #VenusCoin
#PONS #UNI
post-image
牛来-6.14%
MARSCOIN-13.81%
PONS-18.78%
UNI-5.23%
QNT suffers massive capital outflows as a powerful short-selling storm approaches!
Trading Recommendation
Direction: Short
Entry: On a rebound to around 228–230.
Targets: First target 218, second target 210.
Rationale: Fund flows: Market funds are fleeing in one direction, with net outflows exceeding 10 million over the past 24 hours, indicating extremely heavy short-term selling pressure. Technicals: The MACD on the 4-hour chart has formed a bearish death cross and is moving downward, while bearish momentum continues to expand; the price is clearly suppressed by the middle Bollinger Band, lea
post-image
QNT-3.98%
SNDK-5.98%
#每周来晒 #韩股大跌你会抄底吗 Korean stocks plunge 3.65%: This is not a “pullback,” but the “payback moment for the AI bubble in the first half” — bottom-fishing? First see whether foreign capital returns
Today (10/12), the KOSPI plunged 3.65% to close at 6,384 points, hitting a new low since 8/11; Samsung Electronics fell 4.39%, while SK hynix fell 4.52%
Is this a “short-term pullback”? No — this is the squeezing out of the valuation bubble from the “world’s strongest AI rally” in the first half (the KOSPI once rose over 101%), the middle stage of a “medium-term correction,” not an “unjustified sell-off.”
  • 2
  • 1
#韩股大跌你会抄底吗 The KOSPI Index fell sharply, weighing on semiconductor stocks such as Samsung Electronics and SK hynix. This decline presents both risks and opportunities, with the key being to distinguish short-term sentiment shocks from long-term fundamental changes.
In the short term, risks remain.
This decline resulted from multiple factors: weakness in the U.S. stock market’s memory chip sector overnight, consecutive net foreign selling, the early termination of large-scale buyback plans by Samsung and SK hynix, and growing concerns that the memory cycle has peaked. In particular, ChangXin Me
INDEX-14.32%
SK Hynix-9.28%
DRAM-4.34%
  • 4
  • 1
Gold prices pulled back to solid support at the bottom during the early session before rebounding. Those who got in can reduce their positions at the current price first, leaving a small portion to continue targeting 4190-4200! #黄金 #伦敦金 $XAUUSD
post-image
ThisIsTranslateContent:DustyA
October 13 Gold Morning Analysis
Yesterday’s Asian session saw spot gold briefly rise to $4,217 before pulling back from its highs. It then declined steadily during the European and US sessions, reaching an intraday low near $4,154, before edging higher late in the session and ultimately closing near $4,171. On the daily chart, this represented a retracement test of the gains made since last Wednesday.
Fundamentally, gold is still being driven by the tug-of-war between expectations for Federal Reserve rate hikes and the direction of the US Dollar Index. After rebounding yesterday, the US Dollar Index weakened again, but only modestly, failing to provide sufficient upside momentum for gold prices. Meanwhile, US crude oil returned to the $93 level yesterday, while Brent crude rose toward $106. The logic of rising oil prices → stronger inflation expectations → difficulty for US Treasury yields to decline → pressure on gold prices remains unchanged.
Technically, gold prices formed their first bearish candle on the daily chart after two consecutive days of gains, but did not break below the previous breakout platform in the 4150-4160 area. The close also remained firmly above 4170, indicating that this pullback was more of a technical correction than a trend reversal.
In the short-term hourly timeframe, gold prices quickly reclaimed 4170 after retesting 4154, forming a clear long lower-wick structure. The MACD green bars also began to narrow, showing signs of fading bearish momentum; the KDJ indicator formed a golden cross at low levels, while short-term rebound momentum is building.
For today’s trading, it is recommended to focus primarily on buying on pullbacks, with particular attention to whether support in the 4150-4160 area holds. If this area stabilizes and remains unbroken, a small long position may be opened, with a stop-loss below 4140 and a target in the 4190-4200 area.
The above analysis is for reference only and does not constitute any investment advice. Financial markets are highly volatile, and investment involves risks. Please exercise caution when entering the market.#黄金 #伦敦金 $XAUUSD ‌
repost-content-media
XAUUSD+0.40%
$PONS Circulating market cap fell below $200 million
$AI Circulating market cap fell below $90 million
So miserable...
PONS-18.78%
📈10.13 Midday Market Outlook.📈
$BTC Viewpoint:
BTC pulled back all the way down, breaking below the 82301 support, and even wicked below 81444 in a fake breakdown. Fortunately, it reclaimed 81444 and is now trading above it. Does the area indicated by the red arrow below count as a second retest of the previous low? In my subjective opinion, yes.
Because it did not break below the previous low, a second retest does not have to return to the previous low at 80379 with absolute precision. As long as it retests around 80379 without breaking below 80379, it counts as a second retest.
BTC-0.32%
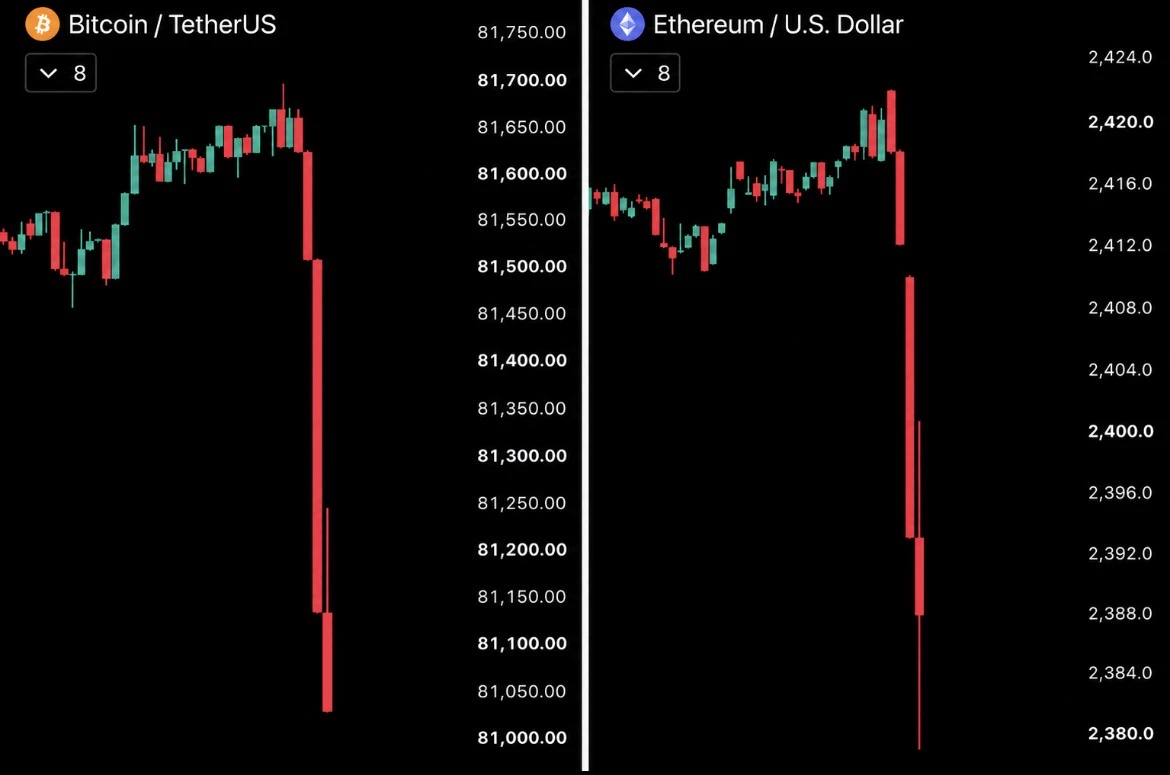
$BTC 140,000 liquidated, $670 million wiped out! The moment the Middle East opened fire, crypto crashed first
When the shells ring, gold is worth ten thousand taels, but crypto has become a meat grinder.
News-wise: Once fighting broke out in the Middle East, oil prices immediately surged to a one-month high. Concerns about inflation resurfaced, and with U.S. CPI data due soon, the market panicked and rushed for the exits. Bitcoin surged to 84300 before suddenly plunging below 82000. Altcoins fared even worse, with BOME down 30% and ENA and NEAR down more than 13%. Over 24 hours, 140,000 people
post-image
BTC-0.28%
ZEC-5.35%
#GateWCTCS9GlobalTradingCompetition
#WCTCS9 #BTC Bitcoin Pulls Back Again: Is the Short-Term Rally Losing Momentum?
1. Long-Term Potential Remains, but Short-Term Risks Are Rising
Bitcoin has once again come under selling pressure, raising concerns about whether its recent rebound can continue. While the long-term outlook remains a subject of optimism among some analysts, short-term market conditions suggest that investors should remain cautious.
Some market observers believe Bitcoin could reclaim its all-time high before mid-2027 and potentially establish a new cycle peak in 2028. Historical
post-image
BTC-0.28%
  • 3
#ETH Yesterday’s ETH subscription trade and the precise high-level short position at 2575 shared with everyone in the livestream repeatedly emphasized that ETH had not finished falling; after reducing the position, it could continue to be held. This morning brought us a surprise😂, directly capturing over 100 points in profit!🎉🎉🎉
Congratulations to everyone who kept pace.
ETH-1.42%
  • 1
While everyone stared at a boring $83K Bitcoin chart this week, the big players were buying.
Metaplanet bought 11,000 BTC.
Nearly $950 million in one go.
Strive added another 2,000 BTC.
Strategy kept stacking and now holds 848,000 BTC.
Retail is bored.
Corporations are accumulating.
That gap usually doesn't last forever.
But watch Friday, October 16.
MSCI decides whether Bitcoin treasury companies like Strategy and Metaplanet get screened out of its indexes.
That one decision could move this whole market. 👀
post-image
BTC-0.28%
ASST-0.21%
SATA+0.31%
MSCI+0.52%
Woke up!
Winning in games, losing at the casino!
post-image
#韩股大跌你会抄底吗 The KOSPI Index fell sharply, weighing on semiconductor stocks such as Samsung Electronics and SK hynix. This decline presents both risks and opportunities, with the key being to distinguish short-term sentiment shocks from long-term fundamental changes.
In the short term, risks remain.
This decline resulted from multiple factors: weakness in the U.S. stock market’s memory chip sector overnight, consecutive net foreign selling, the early termination of large-scale buyback plans by Samsung and SK hynix, and growing concerns that the memory cycle has peaked. In particular, ChangXin Me
  • 9
  • 1
$DEXE vs. $TRUMP
: As both consolidate at the $1.8 support level, which one will touch $1 first? 🎯DEXEPriceAnalyisis
post-image
DEXE-0.60%
Insiders are not talking about this SYMBOL setup yet.

$SUI /USDT - LONG

Trade Plan:
Entry: 1.0320 – 1.0408
SL: 0.9810
TP1: 1.0780
TP2: 1.1057
TP3: 1.1472

Why this setup?
Why now? The daily trend is firmly bullish, setting the stage for a sustained move higher. The 1h ATR of 0.017757 shows volatility is compressed and ready to expand, while the 15m RSI at 48.1 signals room to run before overbought. The entry zone anchored at 1.0364 aligns perfectly with the current 1h price, and the plan targets TP1 at 1.0780 and TP2 at 1.1057. The line in the sand is the invalidation level at 1.0990, whi
SUI-5.60%
  • 2
Load More

Join 40 M users in our growing community

⚡️ Join 40 M users in the crypto craze discussion

💬 Engage with your favorite top creators

👍 See what interests you

Trending Topics

GateRanksTop2inCEXNetInflows

39.9k Views810 Discussing

According to DefiLlama, Gate ranked top 2 among global centralized exchanges by 24-hour net inflows at $12.21 million, with capital inflows remaining strong. What's your take? [👉 Read more](https://www.chaincatcher.com/article/2295824)

GateWCTCS9GlobalTradingCompetition

35.81k Views5.6k Discussing

SanDiskPlunges6%MemoryStocksFall

122.72k Views3.77k Discussing

View More