Share your thoughts
placeholder
Article
#GateEventContractTradeSharingChallenge
🎯 WHAT IF TRADING WASN’T ONLY ABOUT PRICE?
Crypto trading has always been about trying to understand what comes next.
Will Bitcoin break higher?
Will Ethereum hold its momentum?
Can Solana continue outperforming?
Will a major event push the market in one direction?
These questions are at the center of every trader’s decision.
Now, Gate is giving users another way to express those market expectations through its Event Contract Trading & Sharing Challenge, which is currently live through September 10.
What makes this campaign different is that it combine
BTC+0.68%
ETH+1.36%
SOL+3.20%
GT-1.08%
ZEC+19.74%
#RedBullTradingTourSeason6 🏎️
THE MARKET HAS A STARTING GRID — ARE YOU READY TO RACE?
Crypto never waits.
One second the market is calm, and the next, Bitcoin can move thousands of dollars, altcoins can explode, and volatility can completely change the trading landscape.
That is exactly what makes the Red Bull Trading Tour Season 6 so interesting.
Running from August 31 to September 28, 2026, Season 6 brings the adrenaline of racing into the world of crypto trading, giving traders a chance to compete while testing their strategy, execution and consistency.
And with a potential prize pool of u
BTC+0.68%
GT-1.08%
Everyone’s watching ADA’s 4h chart, but the real trap is hiding in the 15m RSI.

$ADA /USDT - SHORT

Trade Plan:
Entry: 0.2215 – 0.2227
SL: 0.2278
TP1: 0.2179
TP2: 0.2150
TP3: 0.2108

Why this setup?
- ADA/USDT is pinned at 0.2221 with a weak SHORT bias (55% confidence) – not a conviction call, just a pressure test.
- 1D trend is *range*, so this isn’t a breakout – it’s a squeeze. The 4h structure says sellers control the 0.2227 ceiling.
- 15m RSI at 59.5 is the tell: buyers are tired, but not dead. That’s why entry zone 0.2215–0.2227 is a knife’s edge.
- TP1 at 0.2179 is a 1.9% drop
ADA+1.97%
When all hope seems lost, let that unyielding heart of yours beat once more.
post-image
This trend, I don't even need to use my brain—the account is dancing on its own🤣.

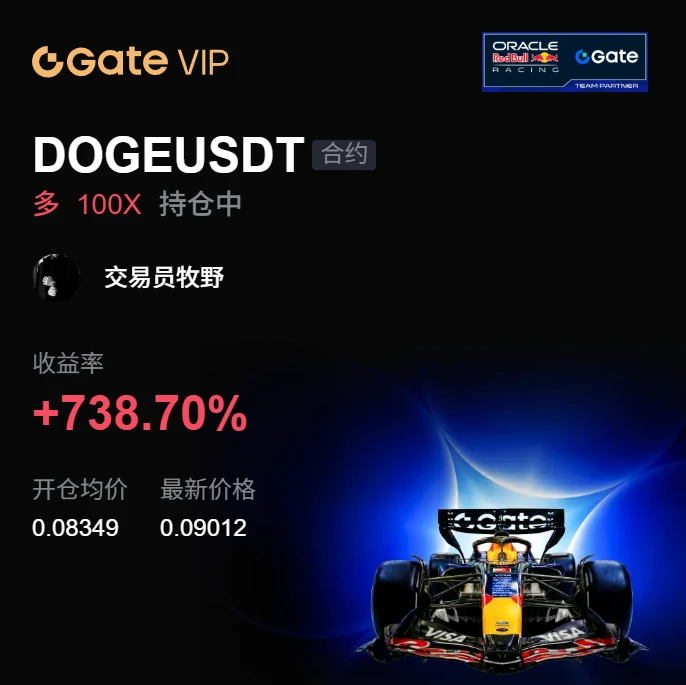
With the screen glowing green, $DOGE /DOGE was lying on the ground, clearly moving sideways at the bottom. I watched it three times and decisively went long. Everyone else was running, but I chose to buy.

Fine, the market gave its answer. Entered at 0.08349, took profit at 0.09014, and walked away with +739.81% profit. Staying bullish wasn't in vain.

Take off 75% first, and place protection on the remaining 20% at the entry price. Don't let floating profit spend the night in your hands and turn into a float
post-image
DOGE+1.08%
BTC+0.71%
ADA+1.97%
Everyone’s staring at TRUMP’s 2.322—but the 4h chart is quietly building a trapdoor.

$TRUMP /USDT - SHORT

Trade Plan:
Entry: 2.315 – 2.329
SL: 2.388
TP1: 2.272
TP2: 2.239
TP3: 2.190

Why this setup?
Why now?
- 1D range + 4h SHORT bias = mean reversion, not breakout.
- RSI 15m at 50.82 = no momentum fuel; price is stalling mid-range.
- ATR 1h (0.0275) shows thin volatility—easy to slap down to TP1 (2.272) before news hits.
- Entry 2.322 with SL 2.388 gives you a 2.8:1 reward-to-risk if TP2 (2.239) prints.
- Confidence 55% isn’t screaming, but the range’s lower half is the path of
TRUMP-1.89%
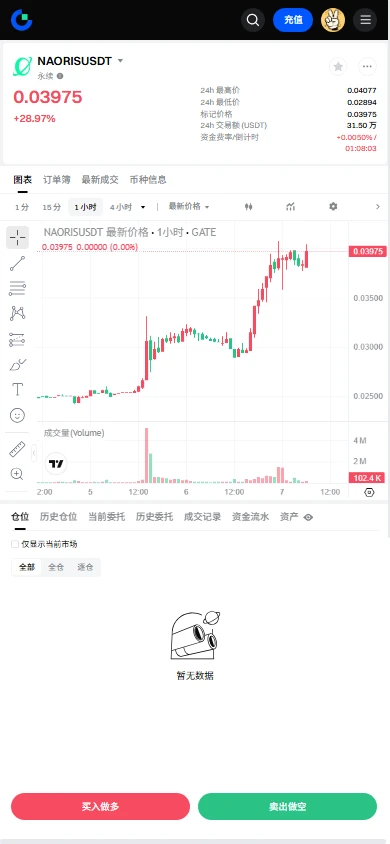
$NAORIS Signal】Long + End of High-Level Consolidation
$NAORIS 4H is pushing upward along the upper Bollinger Band at 0.0397, while RSI is flattening at a high level of 84.8. 1H MACD momentum is contracting, and the price has not broken down. Order book depth imbalance is -7.04%, with sell-side orders slightly thicker. The funding rate is 0.0323%, long/short positioning interest is stable, and OI is steady. There is a short stop-loss zone near 0.0405 above; a breakout could easily trigger cascading buy orders. The current price is at the end of a 15-minute consolidation.
🎯Direction: Long
⚡Ent
post-image
NAORIS+29.90%
BTC+0.68%
ETH+1.36%
SOL+3.20%
✨A 5-year fishing ban on the Yangtze River reveals a simple truth:
When fewer people fish, more fish are naturally born!
The Yangtze River's 10-year fishing ban has only been in place for five years. Schools of fish now appear across the river, Yangtze finless porpoises are frequently spotted, and there are more fish than anyone can count.
There is no complicated magic. Humans are simply taking and fishing less, giving nature room to rest and recover. All living things have their own power to reproduce.
Many things cannot be rushed. By easing excessive demands, reducing the exhaustion of the r
$RAY
RAY is up approximately 40.85% over 24 hours, currently at 1.2816 USDT, with a trading volume of approximately 3.43M USDT. On the 1-hour timeframe, it rose continuously from around 0.90, touched 1.4416, and then pulled back. For now, it looks more like high-volatility turnover than one-sided acceleration.
In the short term, watch the 1.25—1.26 support first; if it breaks, look to 1.20. Above, 1.33—1.40 is the first resistance zone, while 1.4416 is the key high for this move. Raydium is a decentralized trading and liquidity protocol on Solana, covering AMM, concentrated liquidity, LaunchL
post-image
RAY+39.13%
Rewards are being distributed! Open your mystery box now and win up to 100 USDT worth of tokens!
Everyone’s staring at $ETH /USDT’s range—but the 4h clock just started ticking for the quiet exit.

$ETH /USDT - SHORT

Trade Plan:
Entry: 2492.99 – 2499.19
SL: 2525.89
TP1: 2473.74
TP2: 2458.85
TP3: 2436.50

Why this setup?
Why now? The 1D says “range,” but the 4h frame is whispering SHORT with 55% conviction. Price is parked at 2496, right on the entry ref. ATR (12.41) is thin—volatility is coiled. RSI 15m at 51.7 shows zero momentum, meaning longs aren’t committed. The path of least resistance is down to TP1 (2473) then TP2 (2458), unless we invalidate above 2470.67—wait, that’s the inva
ETH+1.38%
The 10x contract $UNI rises every day; I should be able to achieve financial freedom.
UNI+2.78%
TrendForce: Easing Notebook CPU Supply in 2H26 to Narrow the Full-Year Decline in Global Notebook Shipments
post-image
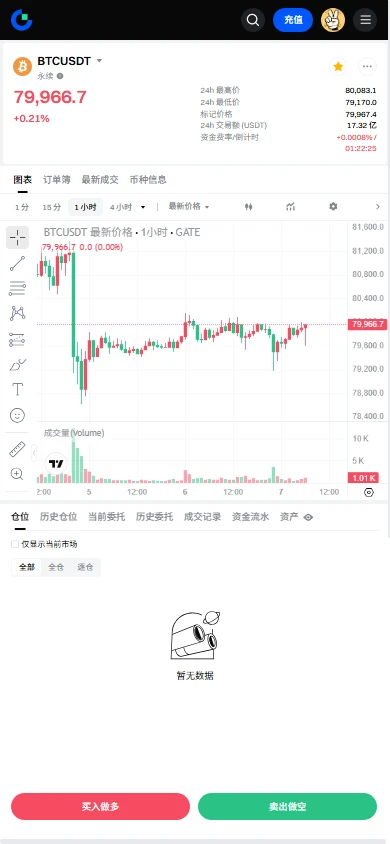
$BTC Signal】1H pullback accumulation, 4H trend intact—go long
$BTC 1H MACD bearish crossover, volume contracted to 1025 BTC, but the 4H Bollinger Bands narrowed to a 2600-point gap between the upper and lower bands, with price tracking the EMA50 and clear signs of buying support.
🎯Direction: long
⚡Entry/limit order: 79585.641 - 79701.400
🛑Stop-loss: 78904.386
🚀Target 1: 80896.921
🚀Target 2: 81494.681
🛡️Trade management:
- Execution strategy: After reaching Target 1, reduce the position by 50% and move the stop-loss up to breakeven. If the price falls back to the entry level, exit automat
post-image
BTC+0.71%
Financial News, Crypto Updates, Real-World Strategies
live-cover
LIVE1,438
September 7 Strategy Plan
Priority ranking, for regular followers only
Operation priority ranking
Priority 1: Go long on a pullback to 2498-2502
The win rate/risk-reward ratio is relatively balanced, making this the ideal long entry zone today.
Priority 2: Go long on a shallow pullback to 2510-2513
Suitable for a strong market, but since the current price is relatively high, keep the position light.
Priority 3: Chase long after a pullback following a firm hold above 2523
Only trade after a confirmed breakout; do not blindly chase near 2520.
Priority 4: Short under pressure at 2531-2535
A quick
post-image
ETH+1.38%
BTC ETH
live-cover
LIVE88
This $ETH trade was handled relatively steadily, using a strategy of taking profits in batches. The entry premise was simple: the higher timeframe was still in a bullish structure, while the lower timeframe was merely undergoing a rapid shakeout, trapping those who chased shorts before quickly recovering. I judged this to be a shakeout rather than a reversal, so I opened a long position at a key panic level. After the market confirmed the move, I did not rush to exit everything, but first took profits on 80% to lock in the existing unrealized gains, while using a protective level to trail the
post-image
ETH+1.38%
BTC+0.71%
ZEC+19.75%
I just took profit on my long position, so I’m reviewing it while the memory is still fresh. The market was moving sideways at the time, with the moving averages on the hourly chart converging, volatility narrowing further, and the chips clearly being compressed. I judged that the direction would most likely break upward, so I first positioned part of my long near the lower boundary of the range.

The move started a little later than I expected, with even several false dips in between. However, none of the dips broke down the range structure, and the key levels were actually moving higher. Th
post-image
ZEC+19.75%
BNB-1.87%
Everyone’s staring at the 4H chart, but ENA just whispered a secret that most retail missed.

$ENA /USDT - SHORT

Trade Plan:
Entry: 0.17527 – 0.17685
SL: 0.18368
TP1: 0.17035
TP2: 0.16654
TP3: 0.16083

Why this setup?
- 1D trend says "range," but the 4H bias flips SHORT with 55.4 confidence—that’s the tell.
- RSI on 15m sits at 55.56: not overbought, not exhausted, just ripe for a mean reversion.
- Entry at 0.17606 with a tight ATR (0.003173 on 1H) means the squeeze is building; TP1 at 0.17035 is a 3.2% drop before you blink.
- Why now? The "waiting" status is the calm before the dum
ENA+2.30%
Load More

Join 40 M users in our growing community

⚡️ Join 40 M users in the crypto craze discussion

💬 Engage with your favorite top creators

👍 See what interests you

View More