Boss3344

vip
Active for: 0.2y
Peak Tier 0
No content yet
BTC ETH UPDATE
live-cover
LIVE81
XAU BTC
live-replay-cover
239 views09-04 17:59
00:49:35
BTC PREDICTION
live-replay-cover
333 views09-02 05:08
02:10:37
live prediction
live-replay-cover
594 views09-02 03:33
01:22:01
#HYPE
Current Price Structure
HYPE is trading around the upper-$70s after recently reaching a new all-time high near $83.30. The broader structure remains strongly bullish because price has advanced through a sequence of higher highs and higher lows, moving from the low-$50s earlier in August toward the $80 region. The latest pullback should therefore be viewed in the context of a much larger expansion rather than as an isolated weakness. The key issue now is whether HYPE can consolidate near the highs without giving back the breakout structure.
24-Hour and 7-Day Performance
The short-term pe
MrFlower_XingChen
#HYPE
Current Price Structure
HYPE is trading around the upper-$70s after recently reaching a new all-time high near $83.30. The broader structure remains strongly bullish because price has advanced through a sequence of higher highs and higher lows, moving from the low-$50s earlier in August toward the $80 region. The latest pullback should therefore be viewed in the context of a much larger expansion rather than as an isolated weakness. The key issue now is whether HYPE can consolidate near the highs without giving back the breakout structure.
24-Hour and 7-Day Performance
The short-term performance shows how aggressive this move has become. HYPE has gained roughly 30%+ over the past seven days, while the latest 24-hour performance has cooled from the strongest part of the rally. This creates an important distinction between momentum and exhaustion. A strong weekly trend can remain intact even if the next few sessions are sideways or slightly negative. After such a fast move, the market needs time to establish new support instead of immediately assuming that another vertical candle is required.
Trading Volume
HYPE's volume has expanded dramatically alongside price, with roughly $1B in reported 24-hour trading activity across the market. That confirms that the breakout is attracting substantial participation rather than being driven by extremely thin liquidity. The next volume signal matters more than the previous one: if volume contracts while price holds above $76–$80, that would suggest healthy consolidation. If large volume starts appearing mainly during declines, it could indicate that early buyers are distributing into strength.
Liquidity and Liquidation Zones
The most important liquidity areas are concentrated around $76, $80 and the previous high near $83.30. These levels are obvious enough to attract stop orders, breakout orders and leveraged liquidations. A fast move through one of them can create a cascade because multiple order types become active simultaneously. That is why a temporary wick below support or above the previous high should not automatically be treated as a confirmed breakout or breakdown. The market's reaction after the liquidity event is more informative.
Immediate Support
The first support zone is around $76–$77. This area is important because HYPE is currently close enough to the recent high for buyers to defend the latest breakout without needing a deep retracement. Holding this region would allow price to consolidate while preserving the short-term bullish structure. A brief sweep below $76 followed by a strong recovery would be less concerning than several consecutive closes underneath the level.
Major Support
Below $76, the next meaningful demand zone is around $72–$74. This region sits closer to the previous acceleration area and could become the foundation for another higher low. If HYPE reaches this zone and buyers step in with strong volume, the larger trend can remain constructive. A decisive break below $72, particularly with increasing selling volume, would show that the market is giving back more of the recent expansion.
Structural Support
The $68–$70 region is the deeper structural level. This zone matters because it represents an area where the previous bullish momentum was established. If HYPE holds above it, the broader breakout can still be considered intact despite a sizeable correction. A daily close below $68–$70 would significantly weaken the current structure and increase the probability that the recent rally was an overextended momentum phase rather than the beginning of sustained price discovery.
Resistance and ATH
The immediate resistance remains the $82–$83.30 area, with $83.30 representing the latest all-time high. Bulls need to reclaim this zone convincingly to restart the strongest part of the trend. A single wick above $83.30 would not be enough because price discovery can produce liquidity sweeps. The stronger signal would be a breakout followed by sustained trading above the previous high, ideally supported by strong spot participation.
Psychological Levels
The $80 level is now the most important psychological number. It sits directly beneath the recent high and provides a simple reference for market sentiment. Above $80, buyers have control of the immediate structure; below $80, the market becomes more vulnerable to profit-taking. Above $83.30, $85 becomes the next psychological checkpoint, followed by $90. These should be treated as reaction zones rather than guaranteed targets.
Derivatives Positioning
HYPE's derivatives activity is particularly important because Hyperliquid is one of the largest perpetual-futures venues in crypto. Strong derivatives participation can amplify price movements in both directions. Rising open interest alongside rising price can support momentum when backed by genuine spot demand, but excessive leverage can make the market fragile. If HYPE continues rising while open interest expands much faster than spot volume, the probability of a sharp liquidation-driven pullback increases.
Liquidation Risk
The recent rally has likely removed a significant amount of short positioning, but new leveraged longs can replace those positions quickly after an all-time-high breakout. This creates a different type of risk: instead of a short squeeze driving the next move, crowded longs could become the source of downside fuel. A healthy market would allow leverage to normalize while price remains above major support. If HYPE suddenly loses $76 with open interest still elevated, liquidation pressure could accelerate the move toward $72–$74.
Protocol Fundamentals
The fundamental backdrop is one of the strongest arguments behind HYPE's valuation. Hyperliquid continues to generate substantial trading activity and protocol fees, reflecting real usage rather than a purely speculative token narrative. Recent reports have highlighted periods where Hyperliquid's daily fees reached several million dollars, showing that the underlying trading ecosystem remains active. Continued growth in volume and fees would provide stronger fundamental support for the token if the trend persists.
Regulatory Catalyst
Regulatory developments are another important catalyst. Recent comments from President Trump indicated that the CFTC is working toward bringing Hyperliquid into the United States in a compliant framework. The market reacted positively because greater regulatory clarity could expand Hyperliquid's potential addressable user base. However, this remains a catalyst to monitor rather than a completed development. Actual regulatory implementation would carry considerably more weight than headlines alone.
Token Supply and Unlocks
Supply is an important medium-term risk. HYPE's circulating supply is below its maximum supply, meaning future token emissions and unlocks can introduce additional sell pressure. Reports have pointed to a significant scheduled contributor unlock in early September. The market may begin pricing this supply event before it arrives, especially if HYPE remains near all-time highs. Strong protocol demand could absorb the additional supply, but weakening momentum would make the unlock more significant.
Broader Crypto Market
Bitcoin remains the main external driver for HYPE. BTC's recent recovery has created a supportive environment for high-beta assets, allowing capital to rotate into stronger altcoin narratives. HYPE has significantly outperformed the broader market during the latest move, which indicates specific demand rather than simple market correlation. However, if Bitcoin experiences a sharp reversal, high-beta assets such as HYPE could experience larger percentage declines because leveraged traders tend to reduce risk quickly.
Relative Strength
HYPE's relative performance is one of the strongest signals on the chart. The token has gained substantially more than the broader crypto market over the same period and has established a new all-time high while many major altcoins remain below their previous peaks. This shows that capital is specifically targeting the Hyperliquid ecosystem. Sustained relative strength would support continuation, while a sharp loss of HYPE/BTC strength alongside a break below $76 would indicate that the market is rotating away from the narrative.
Bullish Scenario
The bullish path begins with HYPE defending $76–$77, then reclaiming $80 and retesting the $82–$83.30 resistance zone. A sustained breakout above $83.30 with strong spot volume would confirm another price-discovery phase. From there, $85 becomes the first psychological checkpoint and $90 the next major round-number level. The stronger bullish structure would be price breaking the previous high while derivatives leverage remains controlled rather than exploding alongside the breakout.
Bearish Scenario
The bearish path begins with repeated rejection around $82–$83.30 followed by a decisive loss of $76. That would open the door toward $72–$74. If buyers fail to defend that area, $68–$70 becomes the major structural test. A daily close below $68–$70 would seriously weaken the current bullish thesis and suggest that HYPE is entering a deeper correction. A simultaneous Bitcoin sell-off would make this bearish scenario considerably stronger.
Key Confirmation and Invalidation
For bulls, the clearest confirmation is a sustained break above $83.30 with healthy spot participation and controlled derivatives positioning. For the short-term structure, $76 is the key defense level. For the broader breakout, $68–$70 is the major invalidation zone. This creates a simple framework: above $83.30, momentum expands; between $76 and $83.30, consolidation remains possible; below $76, correction risk increases; below $68–$70, the current breakout structure is seriously damaged.
Overall Market Read
My current read is bullish on HYPE's structure but cautious about chasing the latest move. The token has strong momentum, exceptional volume, genuine protocol activity, regulatory catalysts and clear relative strength. At the same time, the move has been extremely fast, derivatives exposure is significant and future token unlocks remain a supply consideration. The healthiest outcome would be consolidation above $76 followed by another attempt at the all-time high.
What Matters Next
The next move should be judged through price, volume and leverage together. If HYPE holds $76–$80 while volume remains healthy and excessive leverage cools, the market can build a stronger base for another breakout. A clean break above $83.30 would then confirm renewed price discovery. If $76 fails and $72–$74 cannot hold, the market likely needs a deeper reset. For now, HYPE remains one of the strongest momentum assets, but the quality of its next consolidation will matter more than the size of its next candle.
$HYPE

repost-content-media
#BTCBreaks80k
BTC MARKET STRUCTURE: THE $80K TEST IS NOW REAL
Bitcoin has moved into a completely different short-term structure. BTC is trading around $80,800, up roughly 4.9% over the last 24 hours and 25.7% over the past seven days, with around $57 billion in 24-hour spot volume. The important part is not simply the size of the rally; it is the sequence. BTC reclaimed the mid-$70Ks, pushed through $77K, challenged $80K, and is now trading around the psychological barrier that previously rejected price. That makes the current area a decision zone rather than a level to chase blindly.
PRICE
MrFlower_XingChen
#BTCBreaks80k
BTC MARKET STRUCTURE: THE $80K TEST IS NOW REAL
Bitcoin has moved into a completely different short-term structure. BTC is trading around $80,800, up roughly 4.9% over the last 24 hours and 25.7% over the past seven days, with around $57 billion in 24-hour spot volume. The important part is not simply the size of the rally; it is the sequence. BTC reclaimed the mid-$70Ks, pushed through $77K, challenged $80K, and is now trading around the psychological barrier that previously rejected price. That makes the current area a decision zone rather than a level to chase blindly.
PRICE STRUCTURE: BULLISH, BUT EXTENDED
The short-term structure remains bullish because buyers are still producing higher highs and higher lows. BTC briefly reached around $81,200 today before pulling back, showing that sellers are already becoming active above $80K. The next technical resistance is around $81,033, followed by the previous May high near $82,814. If BTC can turn those areas into support instead of repeatedly rejecting from them, the recovery would become much more convincing.
VOLUME AND PARTICIPATION: THE MOVE HAS REAL FUEL
This rally is not happening on completely empty volume. CoinGecko currently shows roughly $57 billion in 24-hour BTC trading volume, while Coinbase reports substantial activity across the broader seven-day period. That matters because a price breakout supported by expanding participation has more credibility than a thin-volume spike. At the same time, the market has already travelled a long distance in a short period, so volume needs to remain strong around $80K rather than disappear after the breakout attempt.
LIQUIDITY: $80K IS THE BATTLEFIELD
The liquidity picture is becoming especially interesting around the $80K–$82K region. Analysts have noted that trading above $80K is relatively thin, which can make BTC move quickly when large orders or liquidations hit the book. A sustained break higher could force bearish positions to cover and create another acceleration toward $82K–$85K. On the other side, failure to hold $80K could send price back toward the recent breakout area around $77K–$76K, where buyers now need to prove that the previous resistance has become support.
LIQUIDATION ZONES: WATCH BOTH SIDES
I would treat $80K–$82K as the first major upside liquidity zone rather than assuming every move above $80K will immediately continue. A clean expansion through this area could squeeze remaining shorts, while a sharp rejection could trap late longs. Below price, the important downside liquidity region is around $76K–$74K, because this area contains the recent breakout structure and the market mean near $75,968. A move into that zone would not automatically destroy the bullish trend, but losing it decisively would change the character of the rally.
DERIVATIVES: LEVERAGE HAS RESET, BUT RISK IS BUILDING AGAIN
The derivatives market is sending a mixed but useful signal. Recent data showed Bitcoin futures open interest falling about 2.65% while funding stayed close to its baseline, suggesting that part of the excessive leverage was cleared during the weekend pullback rather than simply adding more crowded longs. At the same time, broader futures positioning remains large, with offshore Bitcoin futures exposure reported near $47.9 billion. This means derivatives can amplify whichever side wins the $80K battle.
INSTITUTIONAL FLOWS: THE SPOT SIDE IS SUPPORTIVE
The strongest part of the current setup is that the rally is not purely a futures story. Bitcoin ETFs have recently seen a meaningful return of demand, with five consecutive sessions of inflows totaling nearly $2 billion according to recent reporting. IBIT alone attracted roughly $1 billion during the previous week, including a particularly strong single-day inflow. If that spot demand continues while derivatives funding remains controlled, the market has a healthier foundation for continuation.
WHALE ACTIVITY: LARGE TRANSFERS ARE WORTH WATCHING
There are also signs that large holders are actively moving coins. A $52 million Bitcoin transfer from Coinbase Institutional was reported today, described as an outflow that could reflect institutional custody or positioning rather than immediate selling. One transfer cannot prove accumulation, but it becomes more interesting when exchange balances, ETF demand and price structure are all moving in the same direction. I would watch whether similar large outflows continue instead of treating one transaction as a guaranteed bullish signal.
CORPORATE DEMAND: STRATEGY IS PAUSING, NOT DUMPING
Strategy remains another important part of the institutional picture. The company reportedly ended the latest week with 840,447 BTC and had neither bought nor sold Bitcoin for the second consecutive week. That is significant because Strategy previously sold thousands of BTC over a four-week period, so the current pause removes one potential source of supply pressure even though it does not represent new buying.
MOMENTUM: BULLS HAVE CONTROL, BUT THE MARKET IS HOT
The biggest short-term warning is momentum itself. BTC has gained roughly a quarter in seven days, and one recent technical reading placed the 14-day RSI around 80.5, clearly showing an overheated short-term condition. Overbought does not automatically mean bearish; strong trends can remain overbought for longer than traders expect. But after such a vertical move, consolidation around $78K–$80K could actually be healthier than another immediate vertical candle.
MACRO: LIQUIDITY IS HELPING THE RISK-ON MOVE
The broader macro backdrop has also become more supportive. The U.S. Treasury's plan to increase purchases of longer-dated Treasury securities has been linked to improved liquidity conditions, while a weaker dollar and expectations for clearer U.S. crypto regulation have improved sentiment toward risk assets. Bitcoin has also benefited from the broader demand for alternative assets as investors watch U.S. fiscal conditions and Treasury yields. The important question now is whether these macro tailwinds remain strong enough to support spot demand after the initial short squeeze fades.
BULLISH SCENARIO: $80K BECOMES SUPPORT
The clean bullish scenario is simple: BTC holds above $79K–$80K, absorbs the sellers around $81K, and produces a convincing daily close above $81K–$82K with strong spot volume. A successful breakout above the $82,814 May high would be an even stronger confirmation that the market is transitioning from recovery into a larger upside phase. In that case, the next psychological areas naturally come into focus around $85K, $90K and eventually $100K.
BEARISH SCENARIO: THE BREAKOUT FAILS
The bearish scenario starts with repeated rejection above $80K followed by a loss of the $77K–$76K breakout area. If BTC then breaks below the roughly $75,968 market mean, the recent rally would begin losing its strongest short-term support. A deeper move toward $74K would become possible, and a decisive break beneath that zone would make the recovery structure considerably weaker. The key distinction is between a normal pullback and a structural failure: holding $76K keeps the bullish recovery alive, while losing $74K would demand much more caution.
MY MARKET READ: CONFIRMATION MATTERS MORE THAN PREDICTION
Right now, BTC has the stronger bullish structure, but the market is sitting directly underneath a major resistance cluster after an unusually fast seven-day advance. I would not call $80K an automatic launchpad or an automatic top. The cleaner signal is how price behaves after the first rejection: holding $79K–$80K and reclaiming $81K–$82K would favor continuation, while losing $76K and then $74K would shift the structure toward a deeper correction. For me, the most important story is no longer whether Bitcoin can touch $80K—it already has. The real test is whether buyers can turn $80K from a psychological ceiling into a genuine support zone.
$BTC
repost-content-media
BTC-2.03%
COING-3.60%
#SOLBreaks100
SOL breaks $100: breakout or another trap?
SOL has finally reclaimed the $100 area, marking its first move above this psychological level since February. The important part is not simply touching $100 — it is whether buyers can turn that former resistance into support. Recent market data shows SOL had already climbed more than 30% over seven days, making this a powerful momentum move but also one that is becoming increasingly stretched.
The price structure is turning bullish.
The recent move has taken SOL through the $90 region and above the 200-day EMA, which had previously act
MrFlower_XingChen
#SOLBreaks100
SOL breaks $100: breakout or another trap?
SOL has finally reclaimed the $100 area, marking its first move above this psychological level since February. The important part is not simply touching $100 — it is whether buyers can turn that former resistance into support. Recent market data shows SOL had already climbed more than 30% over seven days, making this a powerful momentum move but also one that is becoming increasingly stretched.
The price structure is turning bullish.
The recent move has taken SOL through the $90 region and above the 200-day EMA, which had previously acted as a major ceiling. That changes the short-term structure from recovery into a potential trend reversal. For me, $100 is now the first level that needs to hold. Above it, $105–$110 becomes the immediate resistance zone, while a clean daily close through that area would put $120 into focus.
Momentum is strong, but the move is not completely spot-driven.
The derivatives market is doing a lot of the heavy lifting. Current data shows roughly $6.5B in SOL futures open interest, with about $14.7B in futures volume over 24 hours versus roughly $1.74B in spot volume. That tells me leverage is playing a major role in the rally. Strong derivatives activity can accelerate a breakout, but it also means the market can reverse quickly if crowded positions start unwinding.
The liquidation picture adds another layer.
Recent data recorded more than $20M of SOL futures liquidations over 24 hours, while the broader rally has been associated with a significant wave of short liquidations across crypto. Short squeezes can push price through technical levels much faster than normal buying would. The danger is that once the forced buying disappears, SOL may need a pullback to find genuine spot demand.
Whale positioning is still mixed.
Tracked Hyperliquid accounts currently show approximately $82.6M of SOL longs against $111.9M of shorts, leaving the tracked group net short by roughly $29.3M. That is interesting because price has been moving higher while some large tracked traders remain positioned against the rally. If SOL continues climbing, those shorts could become fuel for another squeeze; if momentum fails, their positioning could reinforce downside pressure.
Institutional demand is the stronger fundamental signal.
U.S. spot Solana ETFs have accumulated roughly $1.15–$1.16B of net inflows, with recent sessions showing renewed buying. That gives this rally a different character from a purely speculative meme-driven move: there is evidence of persistent investment demand behind the asset. Continued ETF inflows would strengthen the case that dips are being absorbed rather than simply traded by short-term leverage.
The network catalyst is also real.
Agave 4.2 has shipped on mainnet, bringing cheaper rent, larger transaction capacity and faster slots. Solana's recent mainnet feature activation reduced slot times from 400ms to 350ms, while further reductions toward 200ms are part of the broader upgrade roadmap. These improvements matter because they strengthen the network's performance narrative while SOL is simultaneously receiving renewed market attention.
The broader market is helping SOL.
This is not an isolated Solana move. Crypto experienced a powerful risk-on rebound during the past week, with Bitcoin and other large-cap assets recovering sharply and a major short squeeze adding fuel. Treasury liquidity developments have also improved the tone for risk assets. That broader environment is important because SOL usually performs best when Bitcoin is stable-to-bullish and capital starts rotating toward higher-beta assets.
Bullish scenario: $100 becomes the launchpad.
The clean bullish setup is a sustained hold above $100 followed by a break of $105–$110 with expanding spot participation. If that happens, $115 becomes the next area to watch, followed by the psychological $120 level. A move toward $120 would be much more convincing if ETF inflows remain positive while futures open interest stops expanding excessively relative to spot demand.
Bearish scenario: the $100 breakout fails.
The main warning would be a fast rejection back below $100 followed by a loss of $95. That would suggest the breakout was heavily driven by leverage rather than durable spot demand. Below $95, the previous $90 breakout zone becomes the key test. Losing $90 would weaken the current bullish structure and increase the probability of a deeper retracement toward the mid-$80s.
My read: bullish structure, but chasing the candle is the risky part.
SOL has genuine catalysts behind this move — ETF demand, stronger network performance, improving market liquidity and a major technical breakout — but derivatives leverage is also elevated. I would treat $100–$95 as the key battleground rather than assuming $120 is automatic. Holding that zone keeps the breakout thesis alive; losing it would turn the recent surge into a potential failed breakout. The next major confirmation is therefore not simply another green candle — it is whether SOL can prove that $100 has changed from resistance into support.
$SOL @Gate_Square
repost-content-media
SOL-1.92%
HYPE-3.48%
BTC-2.03%
#GateStockInsightsChallenge
SNDK is at a critical technical crossroads
SanDisk ($SNDK) is showing exactly why high-momentum semiconductor names can be difficult to trade: the long-term fundamental story remains powerful, but the short-term chart has suddenly become much weaker. The latest completed session closed at $1,493.12, down 6.45%, with 14.03 million shares changing hands. After reaching $1,827.99 on August 17, the stock has given back a large part of that rally. The important question now is not whether SNDK has an AI narrative — it clearly does — but whether buyers can defend the cur
MrFlower_XingChen
#GateStockInsightsChallenge
SNDK is at a critical technical crossroads
SanDisk ($SNDK ) is showing exactly why high-momentum semiconductor names can be difficult to trade: the long-term fundamental story remains powerful, but the short-term chart has suddenly become much weaker. The latest completed session closed at $1,493.12, down 6.45%, with 14.03 million shares changing hands. After reaching $1,827.99 on August 17, the stock has given back a large part of that rally. The important question now is not whether SNDK has an AI narrative — it clearly does — but whether buyers can defend the current correction.
The recent price action is telling us momentum has cooled
The sequence is more important than one red candle. SNDK closed at $1,786.85 on August 17, dropped sharply on August 18, fell another 3.50% on August 19, recovered 2.02% on August 20, and then slipped again on August 21 before the much larger 6.45% decline on August 24. The August 24 range was especially important: price traded from $1,416.56 to $1,517, meaning buyers did respond aggressively from the lows, but they still failed to recover the $1,500 area by the close.
Volume makes the sell-off harder to ignore
The 14.03M shares traded on August 24 were considerably higher than the 7.58M recorded on August 21 and above the 11.46M on August 20. August 19 also produced 16.28M shares during a 3.50% decline. That combination of expanding volume and falling price suggests genuine distribution rather than a completely quiet pullback. At the same time, August's earlier rally also attracted very heavy volume, so this remains a two-sided institutional battle rather than a simple one-way exit.
The first real battleground is $1,400–$1,500
I would treat $1,400–$1,500 as the main decision zone. The August 24 low at $1,416.56 makes the lower boundary especially relevant, while $1,500 is now a psychological level and an important short-term reclaim point. If buyers can defend this area and push back above $1,500, the correction can start forming a base. If sellers repeatedly reject rebounds below $1,500, the market is showing that former buyers are becoming potential supply.
Below $1,400, the chart becomes much more fragile
A clean break below $1,400 would put the recent recovery structure under serious pressure. The next areas I would watch are approximately $1,330–$1,350, followed by the $1,200–$1,250 region. These are not guaranteed reversal points; they are historical reaction areas where price previously found demand during the August recovery. The key difference is whether SNDK reaches those zones and immediately attracts buyers or simply continues making lower highs and lower lows.
Above $1,500, buyers still have several obstacles
A reclaim of $1,500 alone would not completely reverse the bearish short-term structure. The next resistance area sits around $1,570–$1,600, followed by $1,640–$1,680. These levels matter because price spent meaningful time around them before the latest decline. A sustained move above $1,600 would be the first sign that buyers are regaining control; a move through $1,680 would be much stronger confirmation.
The $1,780–$1,830 zone is the major supply test
The August 17 high near $1,828 created the latest major swing point. That entire region is now important overhead supply. If SNDK eventually returns there, I would expect much stronger resistance than at the smaller levels below it. A decisive breakout above $1,830 would be technically significant because it would remove the most obvious lower-high structure from the current correction and put the market back into price-discovery territory.
The derivatives market is amplifying the volatility
SNDK's stock-perpetual market has also been moving aggressively. The available perpetual data shows a sharp 12.03% decline on August 18, followed by a 1.10% recovery on August 19, while volume remained substantial. This confirms that leveraged exposure is adding another layer of volatility around the underlying stock. However, I would not pretend that public data gives us a perfectly accurate liquidation map for every leveraged position. The better approach is to treat the major price zones as potential areas where forced positioning and fresh demand could interact.
The options market is pricing a large move
The options market has also been expecting unusually high volatility. Recent coverage before the August earnings event showed an implied post-earnings move of roughly 13%, which is enormous for a large-cap stock. That does not tell us the direction, but it does confirm that traders are pricing SNDK as a stock capable of moving violently around catalysts. In this environment, a seemingly small change in sentiment can create a much larger technical move.
The fundamental story is still very different from the short-term chart
SanDisk's fiscal Q4 results were strong. The company reported approximately $8.97B in revenue, above the roughly $8.64B consensus cited in recent coverage, while its data-center business has become an increasingly important part of the AI-storage narrative. Recent analysis also highlighted very strong enterprise demand and expanding margins. So the current decline should not automatically be interpreted as a collapse in the underlying business.
But guidance and valuation are the uncomfortable part of the story
The market has already priced an extraordinary amount of future growth into SNDK. That creates a problem: strong results may no longer be enough. Investors increasingly want evidence that AI infrastructure spending, enterprise SSD demand and NAND pricing can justify the enormous valuation. Recent coverage also pointed to weaker-than-expected revenue guidance as one reason the stock struggled after earnings. This is why SNDK can report impressive numbers and still sell off aggressively.
AI-storage demand remains the biggest bullish catalyst
The long-term bull case is still connected to the explosive growth of AI infrastructure. Data centers need increasingly large amounts of storage, and SanDisk is positioning its NAND and enterprise SSD business around that demand. Recent company developments around faster flash technology have strengthened the AI-storage narrative, while analysts have continued to highlight the company's exposure to the structural memory upcycle.
The broader AI market is now the biggest external risk
SNDK is not trading in isolation. The entire AI trade has become more sensitive to valuation and spending concerns, and Nvidia's upcoming earnings are being treated as an important test for the sector. Recent market coverage specifically identified SanDisk, Micron and other AI-related names among stocks under pressure. If the broader semiconductor complex weakens further, SNDK could struggle even if its own company-specific fundamentals remain solid.
Bullish scenario: buyers build a base
My bullish scenario starts with SNDK defending $1,400–$1,500 and reclaiming $1,500 with improving volume. The next confirmation would be a sustained move through $1,600, followed by $1,680. If buyers eventually reclaim $1,780–$1,830, the current correction would look increasingly like a reset rather than a trend reversal. Above $1,830, the market would once again be challenging the broader 2026 high structure.
Bearish scenario: the $1,400 floor breaks
The bearish scenario becomes much more convincing if SNDK loses $1,400 and cannot reclaim it. That would expose approximately $1,330–$1,350, and a further breakdown could bring $1,200–$1,250 back into focus. The important confirmation is not simply touching those levels; it is continued acceptance below them with lower highs and strong selling volume. A fast recovery back above $1,500 would weaken this bearish interpretation.
My overall read
For me, SNDK is currently neutral-to-bearish in the short term but still structurally interesting on the fundamental side. The AI-memory thesis has not disappeared, but momentum has clearly cooled after the stock failed to hold the $1,700–$1,800 region. I would rather see buyers prove themselves around $1,400–$1,500 than assume every dip is automatically a buying opportunity. The cleanest bullish confirmation is above $1,600–$1,680; the key bearish warning is a decisive loss of $1,400.
The levels I would keep on the screen
Support: $1,416 → $1,400 → $1,330–$1,350 → $1,200–$1,250.
Resistance: $1,500 → $1,570–$1,600 → $1,640–$1,680 → $1,780–$1,830.
Bullish confirmation: reclaim $1,600, then break $1,680 with expanding volume.
Bearish confirmation: lose $1,400 and fail to reclaim it.
Major invalidation of the current bearish structure: sustained acceptance above $1,680, followed by a break of $1,830.
SNDK is still one of the most aggressive AI-memory stories in the market, but the chart is asking for proof. The next important move will likely be decided around the $1,400–$1,600 range: hold and reclaim it, and buyers can rebuild the trend; lose it, and the market may need a deeper reset before the next serious recovery attempt.
$SNDK ‌
repost-content-media
#GoldmanSachsBullishOnCXMT
CXMT is becoming one of the most important names in China’s semiconductor push. Goldman Sachs has initiated coverage on ChangXin Memory Technologies with a Buy rating and a CNY 129 price target, but the more interesting part of the report is the reasoning behind that target: Goldman sees a combination of expanding DRAM capacity, stronger domestic substitution and growing AI-memory demand creating a multi-year earnings opportunity.
Capacity expansion is the biggest part of the thesis. Goldman expects CXMT’s monthly wafer capacity to rise from roughly 270,000 units in
MrFlower_XingChen
#GoldmanSachsBullishOnCXMT
CXMT is becoming one of the most important names in China’s semiconductor push. Goldman Sachs has initiated coverage on ChangXin Memory Technologies with a Buy rating and a CNY 129 price target, but the more interesting part of the report is the reasoning behind that target: Goldman sees a combination of expanding DRAM capacity, stronger domestic substitution and growing AI-memory demand creating a multi-year earnings opportunity.
Capacity expansion is the biggest part of the thesis. Goldman expects CXMT’s monthly wafer capacity to rise from roughly 270,000 units in 2026 to 447,000 in 2028 and 665,000 by 2030. That is more than a 2x increase in four years. The important distinction is that this is future production capacity, not current market share. Goldman estimates that the expanded supply could eventually represent around 50% of China’s DRAM demand by 2028, assuming investment, yields and customer validation progress as expected.
The industry backdrop is unusually supportive. Counterpoint says global DRAM demand continues to exceed supply as AI infrastructure expands, while conventional DRAM prices have already risen sharply. CXMT was also the fastest-growing DRAM supplier in its Q2 2026 assessment, with revenue growth of roughly 716% year over year. That combination of strong demand and rapidly expanding CXMT shipments is exactly the type of environment where additional capacity can translate into significant revenue growth.
But capacity alone does not justify CNY 129. The market ultimately needs to see that additional wafers become profitable products. Yield rates, utilization, product mix, pricing and manufacturing efficiency will determine how much of CXMT’s future capacity actually converts into earnings. This is why Goldman’s valuation is based on much more than volume growth: its CNY 129 target assumes substantial improvement in profitability as CXMT moves further up the technology curve.
HBM is the high-upside part of the story. Goldman expects HBM-related revenue to increase from around 2% of CXMT revenue in 2026 to 27% by 2030. That would materially change the company's product mix because AI accelerators require high-bandwidth memory with much greater value per unit than conventional DRAM. The catch is that HBM is technically demanding, so customer qualification, yields and production scale will be critical before investors can treat this forecast as a certainty.
There is already evidence that CXMT is gaining global relevance. Reuters identified CXMT as the world's fourth-largest DRAM maker in 2025, with approximately 7.7% market share, while its July IPO raised about CNY 57.9 billion. That capital gives the company significant resources to fund capacity expansion and technology development. The IPO itself was extraordinary, with shares closing dramatically above the CNY 8.66 offering price on the first trading day.
The valuation is where the debate becomes serious. Goldman’s report reportedly had CXMT around 10x estimated 2027 earnings, while its CNY 129 target corresponds to roughly 24x 2027 earnings. In other words, reaching the target requires investors to pay a significantly higher multiple while simultaneously believing that earnings will expand rapidly. That makes execution and future DRAM pricing just as important as the headline capacity numbers.
The biggest structural risk is that memory remains cyclical. A strong DRAM environment can create exceptional profits, but aggressive capacity expansion across the industry can eventually change the supply-demand balance. If CXMT and other manufacturers add capacity faster than AI and server demand grows, memory prices could weaken and compress margins. This is particularly important because the current bullish semiconductor environment is already attracting substantial investment. Goldman itself expects China’s semiconductor capital expenditure to reach around $82 billion by 2030, highlighting both the opportunity and the potential for future oversupply.
Competition also cannot be ignored. Samsung, SK hynix and Micron remain the dominant global DRAM players, while CXMT is still developing its technology and scale. Counterpoint currently estimates Samsung at 39% of global DRAM revenue in Q2 2026, followed by SK hynix at 26% and Micron at 25%. CXMT's growth is impressive, but moving from rapid domestic expansion toward sustained global competitiveness will require continued improvement in process technology, yields and advanced-memory products.
The geopolitical angle strengthens the long-term narrative. China’s semiconductor strategy is increasingly focused on reducing dependence on overseas technology and building domestic supply chains. Goldman estimates China’s IC volume self-sufficiency rate reached about 70% by June 2026, up significantly from previous years. CXMT sits directly inside that strategic push because memory is a critical component across smartphones, servers, PCs and AI infrastructure.
For the market setup, the CNY 60–62 region is the first major technical checkpoint. CXMT has already experienced an extraordinary repricing since its IPO, so investors should distinguish between a fundamentally improving company and a stock that has already priced in a large amount of future growth. A sustained move through the recent highs with strong turnover would indicate that buyers are still willing to absorb elevated valuations. A rejection around the highs followed by a loss of the recent consolidation area would suggest that momentum is cooling and that the market needs to reset expectations.
Bullish scenario: CXMT maintains strong DRAM pricing, ramps capacity close to Goldman’s projections, improves yields, expands HBM production and continues gaining domestic market share. In that case, earnings estimates could keep moving higher and the CNY 129 target becomes increasingly defensible. The strongest confirmation would be rising revenue and margins alongside capacity growth, rather than price appreciation alone.
Bearish scenario: capacity ramps faster than demand, DRAM prices weaken, HBM development takes longer than expected or manufacturing yields disappoint. That would expose the gap between CXMT’s current valuation and its future earnings assumptions. Because the stock has already undergone an exceptional post-IPO repricing, disappointment could produce a much larger valuation reset than in a normal semiconductor name.
My read is bullish on the business trend but more cautious on the stock valuation. Goldman’s report gives CXMT a credible long-term growth framework: expanding capacity, AI-memory exposure, domestic substitution and a supportive DRAM cycle. But CNY 129 should be treated as an analyst scenario, not a guaranteed destination. The next stage of the story will be decided by actual production, pricing, HBM qualification, margins and cash-flow generation. If those numbers confirm the growth narrative, CXMT could become a serious global memory competitor; if they fail to keep pace with expectations, the market will quickly focus on valuation instead.
$CXMT
repost-content-media
GS-0.03%
SK Hynix+3.19%
SKHY+8.12%
SKHYV-0.98%
MU+5.89%
#BessentPlansToShakeBondBears
Bessent is taking a much more active approach to the Treasury market, and the real battle is happening at the long end of the curve. U.S. Treasury Secretary Scott Bessent has doubled planned buybacks of 10- to 30-year Treasuries to at least $4 billion per operation beginning in September, while also signaling that the size could go higher. The objective is clear: improve liquidity, support long-duration bonds and push back against the recent rise in long-term yields.
The market reaction shows why this matters. The initial announcement triggered a sharp drop in lo
MrFlower_XingChen
#BessentPlansToShakeBondBears
Bessent is taking a much more active approach to the Treasury market, and the real battle is happening at the long end of the curve. U.S. Treasury Secretary Scott Bessent has doubled planned buybacks of 10- to 30-year Treasuries to at least $4 billion per operation beginning in September, while also signaling that the size could go higher. The objective is clear: improve liquidity, support long-duration bonds and push back against the recent rise in long-term yields.
The market reaction shows why this matters. The initial announcement triggered a sharp drop in long-term yields, but much of that move was quickly reversed. The 10-year yield returned toward 4.7%, while the 30-year yield remained around 5.2% after recently reaching its highest level in nearly two decades. That reversal is important because it suggests investors are not convinced that Treasury buybacks alone can change the underlying direction of the bond market.
The TGA angle makes the story even more interesting. Bessent has indicated that Treasury could use money sitting in the Treasury General Account, which was around $940 billion, to help finance buybacks rather than relying entirely on new short-term borrowing. That gives Treasury another tool for managing the composition of its debt, but it does not eliminate the government's need to finance deficits and refinance existing debt.
This is essentially a maturity-management strategy, not traditional monetary easing. Treasury can buy longer-dated securities, potentially reducing pressure in the 10- to 30-year sector, while adjusting issuance elsewhere. Higher bond prices mean lower yields, so the mechanism makes sense technically. But this should not be confused with Federal Reserve quantitative easing: Treasury is managing its own debt portfolio rather than creating new money to purchase government bonds.
The problem is scale. The Treasury market is enormous, with more than $32 trillion of debt outstanding, while the government still faces substantial borrowing requirements. Reuters noted that the additional buybacks are tiny relative to the overall market and do not change the underlying deficit. That means Treasury can influence liquidity and positioning at the margin, but it cannot simply buy away persistent supply pressure.
The bond bears are watching the fundamentals, not just Treasury headlines. Investors are demanding more compensation for holding long-duration debt because of concerns around fiscal deficits, inflation, rising debt issuance and uncertainty over future monetary policy. The World Gold Council highlighted the changing balance between Treasury supply and investor demand, including competition for capital from large corporate borrowing tied to AI and data-center investment.
That is why the 10-year yield remains the key macro signal. If Treasury's actions are successful, we should see the 10-year yield stabilize below recent highs and the long end of the curve begin to flatten or at least stop repricing aggressively higher. If yields continue making new highs despite larger buybacks, the market would effectively be saying that fiscal and inflation concerns are stronger than Treasury's intervention.
The 30-year is the higher-risk pressure point. The long bond has been particularly sensitive to fiscal concerns, and its recent move above 5% shows how much additional yield investors are demanding. A sustained move back toward the recent 5.3% area would be a warning that the market remains uncomfortable with duration risk. Conversely, a decisive retreat from that zone would give Treasury's strategy much stronger credibility.
There is also a bigger question about what happens if the strategy works only temporarily. A short-term reduction in yields can provide breathing room for mortgages, corporate borrowing and government interest costs. But if investors ultimately believe deficits, inflation and debt supply are still moving in the wrong direction, yields can simply rise again after the intervention fades. Recent price action has already shown how quickly the relief rally can disappear.
The bullish bond scenario is a stabilization of the long end. If Treasury continues increasing buybacks, liquidity improves, inflation expectations cool and the Federal Reserve provides a less restrictive outlook, long-duration Treasuries could see a stronger recovery. In that environment, the initial Treasury intervention would become the beginning of a broader duration trade rather than a one-day headline reaction.
The bearish scenario is a failed policy signal. If the 10-year pushes decisively above its recent 4.7%–4.75% region while the 30-year returns toward or through its recent 5.3% high, investors would be signaling that the structural supply-demand problem remains dominant. That would keep pressure on long-duration bond prices and could also tighten financial conditions across equities, mortgages and corporate credit.
For TLT, the setup is therefore highly sensitive to yields rather than simply to Treasury headlines. TLT holds long-duration U.S. Treasuries, so falling long-term yields generally support its price while rising yields create pressure. The key confirmation would be sustained weakness in the 10- and 30-year yields, not merely another temporary reaction to a buyback announcement.
My read: Treasury has shown that it has tools, but the market is asking whether those tools are powerful enough to overcome the fundamentals. Bessent can influence liquidity, maturity supply and market psychology, and the nearly $1 trillion TGA gives Treasury meaningful flexibility. But deficits, inflation expectations, debt issuance and investor demand ultimately determine where long-term yields settle. The next major signal will be whether bond bears actually retreat when the larger buybacks begin — or whether they use every Treasury rally as another opportunity to sell duration.
$TLT
repost-content-media
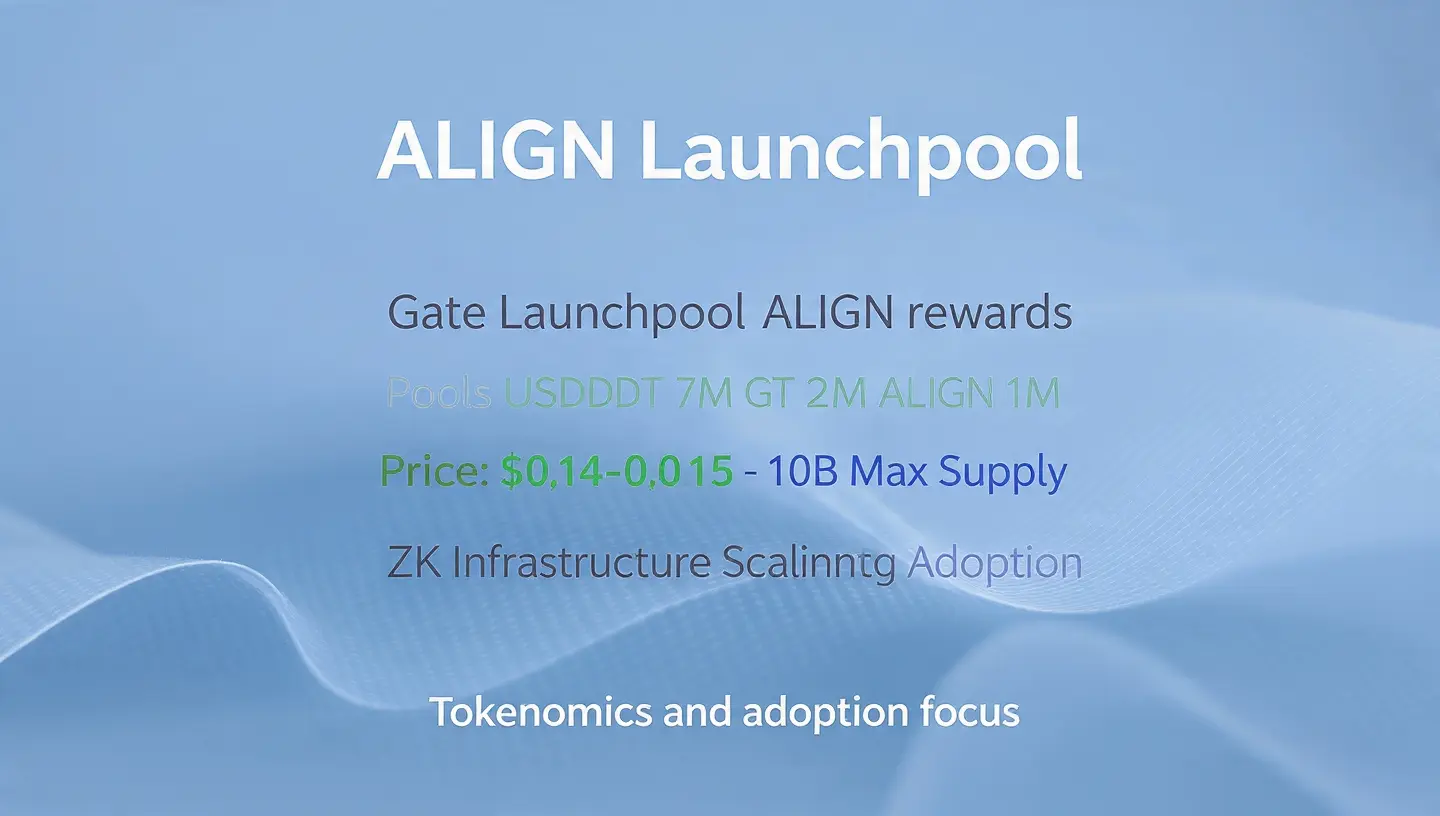
#StakeALIGNShare10MTokens
ALIGN is getting attention for more than just a new token listing. Gate has launched the ALIGN Launchpool with a 10,000,000 ALIGN reward pool, putting Aligned directly in front of traders at a time when Zero-Knowledge infrastructure, Ethereum scaling and institutional blockchain adoption are becoming increasingly important market themes. The interesting question is not simply how many tokens can be earned, but whether Aligned can turn that early attention into sustainable ecosystem growth.
Aligned is positioning itself as infrastructure rather than another short-term
MrFlower_XingChen
#StakeALIGNShare10MTokens
ALIGN is getting attention for more than just a new token listing. Gate has launched the ALIGN Launchpool with a 10,000,000 ALIGN reward pool, putting Aligned directly in front of traders at a time when Zero-Knowledge infrastructure, Ethereum scaling and institutional blockchain adoption are becoming increasingly important market themes. The interesting question is not simply how many tokens can be earned, but whether Aligned can turn that early attention into sustainable ecosystem growth.
Aligned is positioning itself as infrastructure rather than another short-term narrative token. Its focus is on making Ethereum easier for fintech companies, institutions and enterprises to integrate through a unified stack covering areas such as wallets, rollups, interoperability and Zero-Knowledge services. The broader idea is straightforward: instead of every business building complex blockchain infrastructure from scratch, Aligned wants to provide a simpler connection layer that can accelerate deployment.
That positioning matters because ZK technology is moving beyond experimentation. Zero-Knowledge proofs can allow applications to verify information without exposing the underlying data, making the technology relevant to scaling, privacy, identity and institutional applications. If Ethereum-based financial services continue expanding, infrastructure providers that make these systems easier to deploy could capture value from that growth. The challenge is turning the technology narrative into actual users, transactions and recurring demand.
The token launch itself is creating a powerful attention cycle. ALIGN entered the market with a relatively small circulating portion compared with its 10 billion maximum supply, meaning investors need to pay close attention to future unlocks. Early price action can look extremely strong when liquidity is limited, but the same structure can amplify downside volatility when additional tokens enter circulation. This makes supply schedules just as important as headline market capitalization.
Current trading activity is another piece of the puzzle. ALIGN has recently traded around the $0.014–$0.015 area, with daily turnover reaching tens of millions of dollars. That level of activity gives the new token considerably more visibility and liquidity than an illiquid launch, but volume alone does not prove long-term demand. The key signal will be whether trading activity remains healthy after the initial listing and Launchpool excitement fades.
The Gate Launchpool is where the story becomes particularly interesting. The program offers a total of 10 million ALIGN, distributed across three staking pools: 7 million ALIGN for USDT, 2 million for GT and 1 million for ALIGN. That means the USDT pool represents 70% of the total rewards, making it the largest allocation by a wide margin and potentially the most accessible route for participants who do not already hold ALIGN.
The reward structure is designed to distribute tokens over time rather than through a single lottery-style payout. Rewards are calculated periodically according to each participant's eligible stake and pool participation, giving users a clearer mechanism for accumulating ALIGN. The published minimums also make the pools accessible to smaller participants, while individual caps prevent a single account from taking the entire hourly distribution.
But the headline 10 million figure needs context. Reward tokens are not the same thing as guaranteed profit. The economic value of the rewards depends on ALIGN's market price, liquidity and future demand. If the token appreciates, the rewards become more valuable; if the market falls sharply, the dollar value of accumulated tokens can decline just as quickly. The Launchpool changes how participants receive exposure, but it does not remove market risk.
Tokenomics could become the most important factor after the initial hype. With a maximum supply of 10 billion ALIGN and only part of that supply initially circulating, future unlocks can increase available market supply. Investors should watch the timing and size of releases carefully. A strong product story can coexist with short-term selling pressure if circulating supply grows faster than demand.
The bullish case rests on adoption, not just exchange listings. If Aligned attracts meaningful fintech, enterprise and institutional users, expands its Ethereum infrastructure, increases ZK-related activity and successfully develops its aggregation technology, the project could build a stronger fundamental foundation. In that scenario, the current token launch becomes the beginning of an ecosystem growth cycle rather than the peak of initial speculation.
The bearish case is more straightforward. If early trading enthusiasm fades, liquidity declines, token unlocks increase selling pressure or actual ecosystem adoption fails to match expectations, ALIGN could retrace significantly. Newly launched assets can experience large price swings even when the underlying project continues developing. That is why the token's market structure needs to be evaluated separately from the quality of the technology.
There is also a broader market catalyst behind ALIGN. Ethereum scaling, ZK infrastructure, stablecoin payments and institutional blockchain adoption are all attracting capital and developer attention. Aligned sits at the intersection of several of these themes, which gives it a potentially attractive narrative. But being exposed to strong narratives is only the starting point; sustained usage is what eventually separates infrastructure projects from temporary market trends.
For Gate users, the three pools create different risk profiles. The USDT pool provides the largest share of the reward allocation without requiring an existing ALIGN position, while the GT pool connects participation with Gate's ecosystem token. The ALIGN pool is more directly aligned with users who already want exposure to the project and are willing to keep their tokens staked. The right choice depends on the asset already held and the participant's tolerance for ALIGN price volatility.
The most important thing to watch after the Launchpool begins is what happens when incentives meet real demand. If ALIGN maintains healthy spot volume, holds important support levels, attracts new holders and continues announcing meaningful integrations, the reward campaign could help create a stronger community base. If volume collapses immediately after the incentive period, that would suggest much of the early activity was reward-driven rather than organic.
My view is constructive on the project narrative but measured on the token. Aligned has an interesting position in the ZK and Ethereum infrastructure landscape, and Gate's 10 million ALIGN Launchpool gives the project significant early exposure. At the same time, a fresh token with a large future supply and limited trading history deserves careful risk management. The strongest signal will not be the size of the reward pool — it will be whether Aligned can convert technology, incentives and early attention into lasting adoption.
The opportunity is therefore bigger than a simple staking campaign. ALIGN gives the market a way to participate in a developing ZK infrastructure story, while Gate's Launchpool provides a structured mechanism for distributing early token rewards. The next chapter will be decided by three things: real network adoption, sustainable liquidity and disciplined token-supply management. If those three pieces develop together, ALIGN has room to build a much stronger long-term case beyond the excitement of its launch.
@@Gate_Square @GateSquare $ALIGN
repost-content-media
ALIGN-0.43%
ETH-2.16%
ZK-0.67%
GT-1.06%
#CXMTDebutsWith90.1BTradingVolume
The spotlight is now shifting toward CXMT as market interest continues to build, and Gate is giving traders an opportunity to benefit from both market activity and exclusive trading rewards.
The Gate CXMT contract hot-coin campaign is officially live, giving users the chance to trade one of the most talked-about assets while competing for a share of a 50,000 USDT cash prize pool. As volatility increases around trending assets, active traders can take advantage of both price movements and campaign incentives.
Here's what participants can earn:
• First CXMT con
MrFlower_XingChen
#CXMTDebutsWith90.1BTradingVolume
The spotlight is now shifting toward CXMT as market interest continues to build, and Gate is giving traders an opportunity to benefit from both market activity and exclusive trading rewards.
The Gate CXMT contract hot-coin campaign is officially live, giving users the chance to trade one of the most talked-about assets while competing for a share of a 50,000 USDT cash prize pool. As volatility increases around trending assets, active traders can take advantage of both price movements and campaign incentives.
Here's what participants can earn:
• First CXMT contract trade: Receive 5 USDT.
• Daily contract trading check-in: Earn rewards worth up to 35 USDT.
• Trade alongside the community: Share a 50,000 USDT prize pool, with rewards of up to 200 USDT per participant.
Campaign Link:
https://gate.onelink.me/7pdk/85bcc47edd99c275
As always, high-volatility markets can create exciting opportunities, but they also require proper risk management. Having a clear trading plan, using appropriate position sizing, and avoiding emotional decisions remain essential for long-term success.
If you're following the latest hot assets, this campaign is a great opportunity to stay active, explore CXMT price action, and earn additional rewards while trading on Gate.
Join here:
https://gate.onelink.me/7pdk/85bcc47edd99c275
#SummerCreationCamp @Gate_Square
repost-content-media
CXMT+0.04%
Live BTC XAU Trade
live-replay-cover
365 views07-27 00:58
01:06:06
BTC Prediction
live-replay-cover
1,124 views07-24 17:28
01:41:34
#Ethereum Eyes the $2,000 Breakout: Can Bulls Sustain the Momentum?
Ethereum (ETH) has started showing renewed strength after several weeks of consolidation, attracting fresh buying interest as market sentiment gradually improves. While Bitcoin continues to dominate headlines, Ethereum is quietly building a stronger technical structure that has caught the attention of both retail traders and institutional investors. With ETH currently trading in the $1,880–$1,940 range, the next few trading sessions could determine whether the market is preparing for a breakout above the important $2,000 psych
MrFlower_XingChen
#Ethereum Eyes the $2,000 Breakout: Can Bulls Sustain the Momentum?
Ethereum (ETH) has started showing renewed strength after several weeks of consolidation, attracting fresh buying interest as market sentiment gradually improves. While Bitcoin continues to dominate headlines, Ethereum is quietly building a stronger technical structure that has caught the attention of both retail traders and institutional investors. With ETH currently trading in the $1,880–$1,940 range, the next few trading sessions could determine whether the market is preparing for a breakout above the important $2,000 psychological level or another period of consolidation.
Market Structure Remains Constructive
From a technical perspective, Ethereum continues to trade within a healthy recovery pattern. Buyers have consistently stepped in during pullbacks, preventing the price from falling below major support levels. This steady demand suggests that market participants are becoming more confident, even as volatility remains relatively moderate.
The overall price action indicates that bulls still have control, but confirmation will require Ethereum to break through several resistance levels before a larger rally can begin.
Key Support Levels
The first area traders should monitor is the $1,800–$1,840 support zone. This range has become an important short-term demand area where buyers have repeatedly defended the price. As long as ETH remains above this region, the current recovery trend remains technically valid.
Below that, the next major support is around $1,718, which closely aligns with the 20-day Exponential Moving Average (EMA). A move toward this level would not necessarily invalidate the broader recovery, but it would indicate that bullish momentum is weakening and sellers are regaining short-term control.
Holding these support levels will be essential if Ethereum is to continue building toward higher price targets.
Momentum Continues to Improve
Momentum indicators also support the improving outlook.
The 14-day Relative Strength Index (RSI) is trading in the mid-60s, reflecting healthy buying pressure without entering overbought territory. This is generally considered a constructive signal because it suggests there is still room for additional upside before momentum becomes overheated.
Healthy RSI readings often accompany sustainable rallies, provided buying volume continues to increase alongside price.
Institutional Demand Adds Confidence
Beyond technical indicators, institutional participation remains one of Ethereum's strongest fundamental drivers.
Steady net inflows into spot Ethereum ETFs continue to demonstrate growing interest from larger investors. Unlike speculative buying alone, institutional accumulation often provides stronger market stability because positions are typically held over longer periods.
This continued demand has helped Ethereum establish a stronger foundation above key psychological price levels while reducing the impact of short-term market volatility.
The Next Challenge: Breaking $2,000
The most important resistance area now sits between $1,945 and $1,960, where the 100-day EMA is currently located.
A decisive daily close above this region would likely trigger renewed bullish momentum and could force short sellers to exit their positions, creating additional buying pressure through a short squeeze.
If this breakout is confirmed, Ethereum's next destination becomes the highly anticipated $2,000 psychological resistance. Markets often react strongly around round-number price levels because they attract increased trading activity and investor attention.
Successfully reclaiming $2,000 would represent an important technical victory for buyers and could improve confidence across the broader cryptocurrency market.
Medium-Term Price Outlook
Should Ethereum successfully establish $2,000 as a new support level, the technical picture improves considerably.
The next upside targets emerge around $2,160, followed by $2,400, both of which align with broader recovery projections for the current quarter.
These levels would indicate that Ethereum has moved beyond a simple relief rally and is transitioning into a more sustainable medium-term uptrend supported by improving market structure and continued institutional demand.
Macro Resistance Still Lies Ahead
Despite the encouraging recovery, one major obstacle remains.
The 200-day EMA near $2,240 continues to represent Ethereum's most significant long-term resistance level.
This moving average often separates bear market rallies from genuine trend reversals. A successful breakout above this level would strengthen the argument that Ethereum is entering a new bullish phase rather than experiencing only a temporary rebound.
For long-term investors, this remains one of the most important technical levels to monitor during the coming weeks.
Trading Strategy to Watch
For bullish traders, the ideal confirmation would be a strong daily candle closing above $1,960 with increasing trading volume. Such a move would significantly improve the probability of a rally toward $2,000 and potentially higher targets.
On the downside, losing the $1,800 support zone would weaken the current bullish structure and increase the likelihood of a decline toward $1,715, where buyers may attempt to rebuild support.
Patience remains important, as confirmation is often more valuable than attempting to predict breakouts before they occur.
Market Outlook
Ethereum continues to display improving technical strength supported by healthy momentum, resilient support levels, and ongoing institutional accumulation. While resistance near $1,960–$2,000 remains the immediate challenge, the broader outlook stays cautiously bullish as long as the market continues defending the $1,800 support region.
The coming sessions could prove decisive. A successful breakout above resistance would place Ethereum on track for higher medium-term targets, while failure to overcome these barriers may result in another period of consolidation before the next major move develops.
#ETHBreaks1900 @Gate_Square
repost-content-media
ETH-2.16%
#VIPExclusive4%APY
Why Let Your USDT Sit Idle? Gate's VIP Exclusive 4% APY Could Make Every Stablecoin Count
Every crypto investor has faced the same situation at some point. You sell a position, move your profits into USDT, and decide to wait for the next opportunity. Days turn into weeks, and your stablecoins simply remain in your wallet doing nothing. While waiting for the perfect entry into Bitcoin, Ethereum, or another digital asset, your capital isn't growing—it's just sitting idle.
This is where passive income products become valuable. Instead of allowing stablecoins to remain unused,
MrFlower_XingChen
#VIPExclusive4%APY
Why Let Your USDT Sit Idle? Gate's VIP Exclusive 4% APY Could Make Every Stablecoin Count
Every crypto investor has faced the same situation at some point. You sell a position, move your profits into USDT, and decide to wait for the next opportunity. Days turn into weeks, and your stablecoins simply remain in your wallet doing nothing. While waiting for the perfect entry into Bitcoin, Ethereum, or another digital asset, your capital isn't growing—it's just sitting idle.
This is where passive income products become valuable. Instead of allowing stablecoins to remain unused, they can generate returns while you stay ready for your next investment. Recognizing this need, Gate has introduced an upgraded VIP Exclusive Savings campaign, giving eligible VIP users the opportunity to earn up to 4.0% APY on their USDT through fixed-term savings.
The concept is simple, but the impact can be significant for investors who believe that every dollar should continue working, even during periods when they are not actively trading.
A Smarter Way to Manage Idle Capital
Many traders focus entirely on buying and selling assets, but experienced investors understand that portfolio management is about more than executing trades. Capital efficiency is equally important.
If your USDT is waiting on the sidelines for the next market opportunity, why not allow it to generate additional returns in the meantime?
Gate's VIP Exclusive Savings is designed around this idea. Rather than leaving funds inactive, users can place their USDT into a fixed-term savings product and receive interest over the selected period. It transforms idle capital into a productive asset without requiring constant market monitoring or active trading.
What Is VIP Exclusive Savings?
VIP Exclusive Savings is a fixed-term wealth management product available to eligible Gate VIP users. Instead of offering unlimited withdrawals like flexible savings, this product locks funds for a predefined period in exchange for a higher annual yield.
The current promotional rates include:
• 30-Day Fixed Savings – 4.0% APY
• 7-Day Fixed Savings – 3.8% APY
These enhanced rates are part of a limited-time promotion and are available on a first-come, first-served basis. Once the subscription quota is filled, users must wait for future availability.
Understanding What 4% APY Really Means
One of the most misunderstood terms in crypto wealth management is APY.
APY stands for Annual Percentage Yield, representing the estimated annual return if the same interest rate remained unchanged for an entire year.
Since Gate offers 7-day and 30-day fixed-term products, your actual earnings are calculated according to the duration of your subscription—not the full annual percentage.
The important takeaway is that the advertised rate allows investors to compare different savings opportunities using a standardized annual benchmark.
Why USDT Holders Should Pay Attention
USDT has become one of the most widely used assets in cryptocurrency because it provides price stability while allowing investors to move quickly when opportunities appear.
Many traders temporarily convert volatile assets into USDT after taking profits. Others hold stablecoins while waiting for major economic announcements, ETF decisions, Federal Reserve meetings, or favorable technical setups.
During these waiting periods, idle funds generate no additional value unless they are allocated to a savings product.
Gate's VIP Exclusive Savings helps bridge that gap by allowing stablecoins to continue earning while investors remain prepared for their next trade.
Who Can Join?
This campaign is designed exclusively for eligible Gate VIP users.
VIP members on Gate receive access to a variety of premium platform benefits, including lower trading fees, exclusive promotional events, and enhanced wealth management products.
If your account qualifies for VIP status, you can access the savings section and subscribe while allocations remain available.
Simple Subscription Process
One reason this product appeals to many investors is its straightforward subscription process.
First, ensure you have USDT available in your Gate account.
Next, visit the VIP Savings page and choose either the 7-day or 30-day product based on your investment preference.
After confirming your subscription, your funds remain locked for the selected period. Once the term reaches maturity, your original principal and earned interest are credited according to the product rules.
The process requires no active trading, no technical analysis, and no constant monitoring.
Why Fixed-Term Savings Can Be a Strategic Choice
Some investors mistakenly assume that wealth management products are only useful during bear markets.
In reality, fixed-term savings can play an important role during every market cycle.
When prices become highly volatile, investors often move into stablecoins while waiting for confirmation of the next trend.
Instead of allowing those funds to remain inactive, fixed-term savings provide an opportunity to continue generating returns until new investment opportunities appear.
This approach helps improve overall capital efficiency without forcing unnecessary trades simply to remain active in the market.
Advantages of the Campaign
Several features make this promotion particularly attractive:
• Earn passive income without active trading.
• Promotional yields higher than many standard savings products.
• Two different fixed-term options to suit different liquidity needs.
• Straightforward subscription process.
• Opportunity to make idle USDT more productive.
• Exclusive benefits reserved for eligible VIP users.
For investors who regularly maintain stablecoin balances, these advantages can contribute to better long-term portfolio management.
Important Considerations Before Subscribing
Every financial product should be understood before participation.
Because VIP Exclusive Savings is a fixed-term product, subscribed funds cannot be freely withdrawn before maturity under normal product conditions.
Investors should therefore allocate only the amount they do not expect to use during the selected subscription period.
It is also important to remember that promotional quotas are limited. Since subscriptions are accepted on a first-come, first-served basis, delaying participation may result in missing the available allocation.
A Growing Trend in Crypto Investing
The cryptocurrency industry has matured considerably over the past decade.
Investors are no longer focused solely on speculative trading. Increasingly, users are seeking balanced strategies that combine active investing with reliable passive income opportunities.
Stablecoin savings products have become an important part of this evolution because they allow investors to preserve flexibility while generating returns on assets that would otherwise remain idle.
As digital asset markets continue to develop, efficient capital management is becoming just as important as identifying the next profitable trade.
Market Perspective
Whether the market is bullish, bearish, or moving sideways, idle capital always represents an opportunity cost.
Gate's VIP Exclusive Savings campaign addresses this by giving eligible VIP users a practical way to earn returns on USDT while maintaining exposure to one of the most widely used stablecoins in the crypto ecosystem.
With promotional yields of 4.0% APY for 30 days and 3.8% APY for 7 days, combined with a simple subscription process and limited-time availability, this campaign offers a compelling option for investors who believe that every asset in their portfolio should remain productive.
In today's fast-moving crypto market, smart investing isn't only about finding the next winning trade—it's also about making sure your capital keeps working, even while you wait.
#SummerCreationCamp
@Gate_Square @GateSquare
repost-content-media
BTC-2.03%
ETH-2.16%
#USDTDepositEarningsDoublePlay
One Deposit, Two Opportunities: Why Gate's USDT Deposit Earnings Double Play Is More Than Just Another Promotion
In every market cycle, investors spend a lot of time searching for the next profitable trade, but they often overlook something just as important—how efficiently their capital is being used while they wait. It is common for traders to sell a position, move their profits into USDT, and leave those funds sitting idle until the next opportunity appears. The money remains safe and liquid, but it isn't working.
As the crypto industry continues to mature, e
MrFlower_XingChen
#USDTDepositEarningsDoublePlay
One Deposit, Two Opportunities: Why Gate's USDT Deposit Earnings Double Play Is More Than Just Another Promotion
In every market cycle, investors spend a lot of time searching for the next profitable trade, but they often overlook something just as important—how efficiently their capital is being used while they wait. It is common for traders to sell a position, move their profits into USDT, and leave those funds sitting idle until the next opportunity appears. The money remains safe and liquid, but it isn't working.
As the crypto industry continues to mature, exchanges are introducing products that help users make better use of idle assets instead of letting them remain inactive. Gate's USDT Deposit Earnings Double Play campaign reflects this shift by combining active trading incentives with passive wealth management. Rather than rewarding users in only one way, the campaign creates two independent earning opportunities from the same USDT balance.
For traders who already plan to deposit funds, trade futures, and keep part of their portfolio in stablecoins, this campaign offers a practical way to improve capital efficiency without changing their overall investment strategy.
Why Idle USDT Matters
USDT has become the backbone of the cryptocurrency market. It is the preferred trading pair for countless digital assets, a common store of value during volatile market conditions, and a temporary parking place for investors waiting to re-enter the market.
However, there is a hidden cost to holding large amounts of USDT without a plan. While your funds remain ready for the next opportunity, they generate no additional value.
Imagine waiting several weeks for Bitcoin to break a key resistance level or for Ethereum to confirm a bullish trend. During that waiting period, your capital could potentially be earning rewards instead of remaining inactive.
This is the problem Gate's Double Play campaign aims to solve.
One Deposit, Two Different Sources of Rewards
Unlike many promotional events that focus on only one activity, Gate combines two completely different earning mechanisms into a single campaign.
The first rewards users for depositing funds and participating in futures trading.
The second allows eligible users to place their unused USDT into VIP fixed-term wealth products to generate passive returns.
These rewards operate independently, meaning users have the opportunity to benefit from both instead of choosing one over the other.
It is a strategy that recognizes two important realities of crypto investing: active traders deserve incentives, and idle capital should continue working.
First Opportunity: Million Deposit Bonus
The first part of the campaign is built around qualified deposits and trading activity.
Users who complete the required net deposit and achieve the corresponding futures trading volume become eligible to receive up to 1% USDT cashback.
Depending on participation, rewards can reach a maximum of 10,000 USDT per user, making this one of the larger cashback campaigns available for active traders.
Unlike random prize draws, this reward is tied directly to measurable participation, creating a transparent framework where users understand exactly how they qualify.
Understanding Net Deposits
One concept that often causes confusion is the calculation of net deposits.
Many users assume every deposit automatically qualifies, but the campaign measures the actual increase in account balance.
The calculation is simple:
Net Deposit = Total Deposits − Total Withdrawals
For example, if a participant deposits 10,000 USDT but later withdraws 3,000 USDT during the campaign period, the qualified net deposit becomes 7,000 USDT.
This method encourages genuine capital growth rather than temporary transfers designed only to meet promotional requirements.
Why Futures Trading Is Included
Depositing assets alone is only part of the campaign.
To qualify for cashback, users must also complete the required futures trading volume specified by Gate.
This structure encourages meaningful market participation while supporting liquidity across the futures platform.
More importantly, it promotes responsible engagement instead of rewarding inactive balances alone.
Users should always review the official campaign requirements to understand which trading volumes correspond to each cashback tier before participating.
Second Opportunity: Putting Idle USDT to Work
After completing deposits and trading, many users still hold a portion of their USDT while waiting for the next opportunity.
Instead of leaving those assets untouched, Gate allows eligible participants to subscribe them to VIP Exclusive Fixed-Term Wealth Products.
Current options include:
7-Day Fixed-Term Savings
- 3.8% APR
30-Day Fixed-Term Savings
- 4.0% APR
These products provide a straightforward way to earn passive income while maintaining exposure to one of the most widely used stablecoins in the crypto market.
For investors who already planned to hold USDT for several days or weeks, this creates an additional layer of value without requiring constant market activity.
Cashback and Passive Income Work Together
One of the strongest aspects of this campaign is that cashback and wealth management are completely separate reward systems.
The cashback is earned by completing campaign requirements related to deposits and futures trading.
The wealth product generates returns through the selected fixed-term subscription.
Because these mechanisms operate independently, users are not forced to choose between trading incentives and passive income.
Instead, they can potentially benefit from both, allowing the same capital to serve multiple purposes during the campaign period.
Choosing the Right Fixed-Term Plan
Every investor has different liquidity needs.
The 7-day option may suit active traders who expect to use their capital again in the near future.
The 30-day product offers the higher 4.0% APR, making it attractive for users who are comfortable locking their USDT for a longer period in exchange for increased returns.
The right choice depends less on the advertised percentage and more on personal investment plans and expected cash requirements.
A Simple Participation Process
Joining the campaign requires only a few steps:
- Register for the official promotion.
- Deposit fresh USDT into your Gate account.
- Maintain a positive qualified net deposit.
- Complete the required futures trading volume.
- Subscribe eligible idle USDT to either the 7-day or 30-day VIP fixed-term product.
Following these steps positions users to participate in both earning opportunities throughout the campaign.
Why This Campaign Is Different
Many exchange promotions focus entirely on increasing trading volume, while others concentrate only on passive income.
Gate combines both concepts into a single campaign.
Instead of asking users to choose one approach, it creates a system where active participation and patient investing complement each other.
This reflects a broader trend in cryptocurrency investing. Successful portfolio management today is not only about finding profitable trades—it is also about improving how efficiently every dollar of capital is used.
Whether markets are moving higher, correcting, or trading sideways, idle assets represent an opportunity cost.
Campaigns that reduce that cost while maintaining flexibility can become valuable tools within a broader investment strategy.
Things to Keep in Mind
Before participating, users should carefully review the campaign rules and product terms.
Cashback eligibility depends on both qualified net deposits and required futures trading volume.
The cashback reward can reach up to 1%, with a maximum payout of 10,000 USDT per user.
VIP Wealth Products currently offer 3.8% APR for the 7-day term and 4.0% APR for the 30-day term, with returns credited according to the product rules after maturity.
As with any financial product, investors should evaluate their own liquidity needs, understand the lock-up period, and avoid committing funds they may require before the selected term ends.
Looking Ahead
The crypto market is evolving beyond simple buying and selling. Investors today are looking for smarter ways to manage capital, balance risk, and generate value even when they are not actively trading.
Gate's USDT Deposit Earnings Double Play campaign reflects that evolution by combining cashback incentives with passive income opportunities in a single strategy.
Rather than allowing USDT to remain idle between trades, users have the opportunity to make their capital productive while staying prepared for future market opportunities.
In a market where every percentage point matters, making your assets work harder can be just as important as choosing the right trade at the right time.
#SummerCreationCamp
#USDTDepositEarningsDoublePlay @Gate_Square @GateSquare
repost-content-media
#SNDK
Why SNDK Jumped 12.63% Today: Dead Cat Bounce or the Start of a New Rally?
After one of the most explosive rallies in the semiconductor sector, SanDisk (NASDAQ: SNDK) is once again attracting market attention. Following a sharp 35–40% correction from its all-time high of $2,354, the stock rebounded strongly today, closing around $1,566.67 (+12.63%). This recovery has reignited the debate: was the recent selloff simply profit-taking in an overheated AI stock, or is the broader uptrend beginning again?
Unlike the SanDisk most investors remember as a consumer storage brand, today's company
MrFlower_XingChen
#SNDK
Why SNDK Jumped 12.63% Today: Dead Cat Bounce or the Start of a New Rally?
After one of the most explosive rallies in the semiconductor sector, SanDisk (NASDAQ: SNDK) is once again attracting market attention. Following a sharp 35–40% correction from its all-time high of $2,354, the stock rebounded strongly today, closing around $1,566.67 (+12.63%). This recovery has reignited the debate: was the recent selloff simply profit-taking in an overheated AI stock, or is the broader uptrend beginning again?
Unlike the SanDisk most investors remember as a consumer storage brand, today's company has evolved into one of the purest AI storage infrastructure plays in the market. Enterprise SSDs, hyperscale data centers, AI inference storage, and next-generation NAND technology are now driving its business. While NVIDIA powers AI computing, SanDisk aims to power where AI stores its data.
Current Market Analysis
Today's rally is significant because buyers stepped in after weeks of heavy selling pressure. The stock recovered from the $1,390 region and pushed back above $1,560, showing renewed confidence after a major correction.
Despite today's strength, SNDK still trades well below its all-time high, meaning the market remains in a price-discovery phase. Long-term investors continue to view the correction as healthy after an extraordinary rally, while short-term traders are watching whether today's rebound can develop into a sustained recovery.
With a market capitalization of approximately $232 billion, a forward P/E near 21.6, and analysts' average target around $2,144, expectations remain high, but volatility is equally elevated.
Technical Analysis
The long-term trend remains firmly bullish.
Price continues trading comfortably above the 20-day, 50-day, and 200-day exponential moving averages despite the recent correction, confirming that the primary uptrend has not been broken.
Earlier this year, RSI moved above 80, placing the stock deep inside overbought territory. That excessive momentum has now cooled considerably, reducing speculative pressure.
MACD recently crossed below its signal line, reflecting weaker short-term momentum, but today's strong rebound suggests buyers are attempting to regain control.
Bollinger Bands previously showed SNDK trading well above the upper band, highlighting how stretched the rally had become. The recent correction has brought price back toward a healthier technical structure.
The most important observation is that although the rising channel has weakened, the broader bull market remains intact unless major support levels fail.
Institutional & Whale Activity
Since SNDK is a NASDAQ-listed equity, traditional blockchain whale analysis does not apply. Instead, institutional capital provides the clearest picture of market conviction.
Large funds have accumulated SNDK aggressively throughout the AI boom. Strong institutional inflows have been one of the biggest drivers behind the stock's remarkable rise from nearly $40 to above $2,300.
Management has reinforced confidence by authorizing a $6 billion share repurchase program, creating structural buying demand while signaling belief that the company's long-term valuation remains attractive.
Another encouraging sign is the absence of significant insider selling despite the massive appreciation in share price.
This combination of institutional accumulation, management confidence, and limited insider selling continues supporting the long-term investment case.
Latest News Driving the Stock
Several major catalysts continue strengthening SanDisk's outlook.
The company recently delivered exceptional quarterly results, reporting revenue growth exceeding 250% year-over-year while comfortably beating analyst expectations.
Its data-center division recorded explosive sequential growth as AI infrastructure spending accelerated across hyperscale cloud providers.
SanDisk also introduced High Bandwidth Flash (HBF) technology, an innovation designed to combine the advantages of NAND flash with characteristics traditionally associated with high-bandwidth memory. If commercial adoption accelerates, HBF could become one of the most important storage technologies supporting future AI inference workloads.
Another major catalyst is the memorandum of understanding with SK hynix aimed at promoting industry standardization for HBF.
Meanwhile, SanDisk and Kioxia have started shipping samples of next-generation 332-layer 3D NAND, strengthening their technological leadership.
Industry fundamentals remain equally supportive. NAND manufacturers continue increasing prices while analysts expect global supply shortages to persist into 2027, creating favorable pricing conditions for producers.
Business Ecosystem
SanDisk's transformation extends far beyond consumer memory cards.
Today, its business is built around three strategic pillars.
The Data Center division has become the company's primary revenue engine by supplying high-performance SSD solutions for cloud computing and AI infrastructure.
The Edge segment supports automotive systems, industrial devices, embedded platforms, and IoT applications where reliable flash storage remains critical.
The Consumer business continues generating stable cash flow through removable storage products, although it now represents a much smaller part of the company's long-term growth strategy.
Its partnership with Kioxia remains one of the company's greatest competitive strengths by sharing manufacturing capacity, research investment, and future production expansion.
Competitive Landscape
Competition within the NAND industry remains intense.
Samsung continues leading global NAND market share through unmatched manufacturing scale.
SK hynix dominates AI memory while expanding NAND production and collaborating with SanDisk on HBF technology.
Micron benefits from diversified exposure across DRAM and NAND while also riding AI demand.
Kioxia remains both a competitor and one of SanDisk's closest strategic partners through their long-standing Flash Venture.
Compared with diversified semiconductor companies, SanDisk offers investors one of the purest ways to gain direct exposure to AI storage demand.
Risk Analysis
Investors should not ignore the risks despite the impressive growth story.
The company's beta of approximately 5.48 makes SNDK one of the market's most volatile large-cap technology stocks.
A broad correction across technology shares could produce significantly larger declines in SNDK than the overall market.
Memory remains a cyclical industry. If AI infrastructure investment slows or NAND supply expands faster than expected, pricing power could weaken rapidly.
Although the recent correction reduced valuation pressure, expectations remain elevated following the stock's extraordinary performance over the past year.
Competition from Samsung, Micron, and SK hynix also continues increasing as each company expands production capacity.
Market Outlook
The long-term outlook remains constructive.
Artificial intelligence continues creating enormous demand for enterprise storage as increasingly larger AI models require significantly more flash capacity for both training and inference.
Industry forecasts suggest enterprise data centers will become the largest source of NAND demand, replacing traditional consumer electronics.
If current supply constraints remain in place while AI infrastructure investment continues accelerating, SanDisk should benefit from both higher shipment volumes and stronger pricing power.
However, investors should also expect continued volatility as markets reassess valuations following one of the strongest rallies in semiconductor history.
Bullish Scenario
If management delivers another strong earnings report, HBF adoption expands, NAND shortages continue through 2027, and hyperscale AI spending remains strong, SNDK could reclaim $1,730 before challenging its previous all-time high near $2,354.
A successful breakout above that level could eventually open the path toward the $2,500–3,000 range.
Bearish Scenario
If hyperscale customers reduce AI spending, NAND prices weaken, or broader equity markets experience another correction, SNDK could revisit the $1,300 support area.
Failure to hold that zone may expose the stock to deeper downside toward $1,000 or even below, particularly given its elevated beta.
Support & Resistance
Immediate Resistance: $1,573
Secondary Resistance: $1,730
Major Resistance: $2,354
Primary Support: $1,350
Secondary Support: $1,304
Major Technical Support: $1,014
Long-Term Structural Support: $466
Today's recovery has improved short-term momentum, but confirmation requires sustained trading above the immediate resistance zone.
Trading Strategy
Swing traders should monitor whether SNDK can establish multiple daily closes above $1,570 with expanding trading volume. That would strengthen the probability of another move toward $1,730.
If price loses the $1,350 region, downside risk increases significantly.
Long-term investors may benefit more from gradual accumulation during periods of weakness instead of chasing sharp rallies.
Given the stock's exceptional volatility, disciplined position sizing remains essential regardless of market outlook.
Investor Guide
Conservative investors should avoid oversized exposure because price fluctuations remain extreme.
Moderate growth investors may consider small portfolio allocations while waiting for stronger technical confirmation.
Aggressive investors who understand cyclical semiconductor investing may view current prices as an opportunity to build positions gradually while maintaining strict risk management.
Active traders should focus on technical confirmation rather than emotional reactions to large daily price swings.
Conclusion
SanDisk has successfully reinvented itself as one of the world's most important AI storage companies. Exceptional earnings growth, institutional accumulation, advanced High Bandwidth Flash technology, the Kioxia partnership, a $6 billion buyback program, and an industry-wide NAND shortage continue supporting its long-term investment thesis.
At the same time, today's rally should not cause investors to overlook the risks. The stock remains highly volatile, valuation expectations are demanding, and the memory industry has historically experienced powerful boom-and-bust cycles.
The battle around the $1,350–1,570 range may determine the next major trend. If buyers continue defending this zone while AI spending remains strong, today's rebound could prove to be the first step toward another advance. If not, further consolidation should be expected before the next sustainable move higher.
Disclaimer
This analysis is intended solely for educational and informational purposes and should not be interpreted as financial or investment advice. Every investor should conduct independent research, evaluate personal risk tolerance, and consult a qualified financial professional before making investment decisions. Past performance does not guarantee future results, and highly volatile stocks such as SNDK can experience significant gains as well as substantial losses.
#SummerCreationCamp
@Gate_Square
repost-content-media
#BTC
Bitcoin Reclaims $65K: Is Institutional Demand Strong Enough to Fuel the Next Breakout?
Bitcoin has finally given bulls a reason to celebrate. After spending weeks under pressure and falling to nearly $58,000 in late June, BTC has staged an impressive recovery, reclaiming the $65,000 level and climbing toward the $66,400–$66,850 range. The move wasn't driven by hype alone. Behind this recovery is a combination of renewed institutional demand, improving macro sentiment, and a market that appears to be rebuilding confidence after one of the toughest corrections of 2026.
The biggest questio
MrFlower_XingChen
#BTC
Bitcoin Reclaims $65K: Is Institutional Demand Strong Enough to Fuel the Next Breakout?
Bitcoin has finally given bulls a reason to celebrate. After spending weeks under pressure and falling to nearly $58,000 in late June, BTC has staged an impressive recovery, reclaiming the $65,000 level and climbing toward the $66,400–$66,850 range. The move wasn't driven by hype alone. Behind this recovery is a combination of renewed institutional demand, improving macro sentiment, and a market that appears to be rebuilding confidence after one of the toughest corrections of 2026.
The biggest question now is whether this is the beginning of a sustainable uptrend or simply another relief rally before the next wave of volatility.
Current Market Overview
Bitcoin is currently trading around $66.4K–$66.8K, gaining roughly 4% over the past 24 hours. More importantly, it has reclaimed the psychologically important $65,000 level, which had previously acted as strong resistance.
Market sentiment has also improved significantly as investors increasingly expect the Federal Reserve to leave interest rates unchanged at the July 28–29 FOMC meeting. Current market pricing suggests an 82%–93% probability of a rate pause, helping risk assets recover.
At the same time, institutional demand has returned through US spot Bitcoin ETFs. Over the last five trading sessions, these funds attracted more than $727 million in net inflows, pushing total ETF assets back above $79 billion. This indicates that large investors are once again adding exposure instead of reducing it.
Technical Analysis
Bitcoin's technical structure has improved noticeably over the past several sessions.
After defending the $58,000 region, BTC broke above multiple short-term resistance levels and reclaimed the 50-day EMA, signaling that bullish momentum is returning.
The Relative Strength Index (RSI) has recovered into the 55–60 range after previously entering oversold territory. This suggests momentum is strengthening without yet reaching overheated conditions.
Although the recovery is encouraging, Bitcoin still trades below its long-term 200-day EMA, meaning the broader macro trend has not fully turned bullish. To confirm a larger trend reversal, buyers must continue defending higher lows while pushing through the next resistance zones.
Overall, the technical picture has shifted from bearish to cautiously bullish.
On-Chain Analysis
On-chain data continues supporting the recovery.
Long-term holders remain remarkably resilient, with little evidence of panic selling despite the recent correction. Exchange balances have stabilized as Bitcoin continues flowing away from centralized exchanges, reducing immediate selling pressure.
Derivatives activity also appears healthier than during previous periods of excessive leverage. While short-term speculation has increased following the recent rally, the broader market structure remains considerably more balanced than earlier this year.
These metrics suggest the recovery is supported by genuine accumulation rather than purely speculative buying.
Whale Activity
Large Bitcoin holders are becoming increasingly active again.
Wallets holding more than 1,000 BTC have shifted from aggressive distribution earlier this year toward a much more neutral and selective accumulation strategy.
Instead of moving massive amounts of Bitcoin directly on-chain, institutional participation is becoming increasingly visible through regulated investment products, particularly US spot ETFs.
This transition reflects growing institutional confidence while reducing concerns about large-scale whale selling.
News Driving the Market
Several important developments are supporting Bitcoin's recovery.
The strongest catalyst remains the resurgence of ETF demand. Five consecutive days of positive inflows demonstrate renewed confidence among institutional investors after months of heavy withdrawals.
Macro conditions have also become more supportive. Cooling inflation data has strengthened expectations that the Federal Reserve will keep interest rates unchanged later this month, improving overall liquidity expectations.
Meanwhile, easing geopolitical tensions have encouraged investors to rotate back into higher-risk assets, benefiting both equities and cryptocurrencies.
Together, these factors have created a much healthier environment than the one seen only a few weeks ago.
Bitcoin Ecosystem
While excitement surrounding Ordinals, Runes, and Bitcoin Layer-2 networks has cooled compared to late 2025, development activity remains healthy.
Builders continue expanding Bitcoin's ecosystem, focusing on scalability, infrastructure, and long-term adoption rather than speculative growth.
Across the broader crypto market, improving risk appetite has also encouraged capital rotation into selected altcoins, historically a positive sign during recovering market cycles.
Key Risks
Despite the improving outlook, several risks remain.
The upcoming FOMC meeting represents the largest short-term catalyst. Any unexpectedly hawkish comments from the Federal Reserve could quickly strengthen the US dollar and pressure both equities and cryptocurrencies.
Rapid rallies driven by ETF inflows and short covering also increase the probability of sudden profit-taking if important resistance levels fail.
Regulatory uncertainty remains another long-term challenge as governments continue introducing new crypto frameworks across major jurisdictions.
Competitive Position
Bitcoin continues dominating the digital asset market as the world's largest cryptocurrency and preferred institutional store of value.
Although networks such as Ethereum and Solana compete in smart-contract applications, Bitcoin's primary investment thesis remains centered on scarcity, institutional adoption, ETF demand, and macroeconomic positioning.
Its leadership within the crypto market remains firmly intact.
Market Outlook
The market outlook has improved from deeply bearish to cautiously optimistic.
Holding above $65,000 is now the most important requirement for maintaining positive momentum.
If institutional inflows continue and macro conditions remain supportive, Bitcoin could transition from recovery mode into a stronger medium-term uptrend.
However, confirmation still depends on successfully breaking higher resistance levels during the coming weeks.
Bullish Scenario
If ETF inflows remain strong and Bitcoin closes convincingly above $68,000, momentum traders could drive price toward the $70,000 psychological level.
A supportive Federal Reserve statement would further strengthen this bullish scenario by encouraging additional institutional participation.
Bearish Scenario
If Bitcoin loses the $65,000 support area following disappointing macroeconomic developments, sellers may regain control.
A breakdown below this level could trigger another test of the important $60,000 support zone, especially if broader financial markets move into risk-off mode.
Support & Resistance
Immediate Resistance: $67,500–$68,000
Major Resistance: $70,000–$74,693
Key Pivot: $65,000
Primary Support: $64,100–$65,000
Major Structural Support: $60,000
The battle around $65,000 will likely determine Bitcoin's next major directional move.
Trading Strategy
Breakout traders should wait for a confirmed daily close above $68,000 before targeting higher levels.
Range traders may continue buying near support while taking profits near resistance until a decisive breakout occurs.
Risk management remains essential. Protective stop-loss placement below the $64,000 region may help reduce downside exposure if market sentiment suddenly changes around the FOMC meeting.
Investor Guide
For long-term investors, gradual Dollar-Cost Averaging continues to be one of the most disciplined strategies during periods of consolidation.
Short-term traders should remain focused on technical confirmation, ETF flow data, and macroeconomic developments rather than reacting emotionally to daily price swings.
Matching position size with personal risk tolerance remains more important than attempting to predict every market move.
Conclusion
Bitcoin has delivered one of its strongest recoveries in recent months by reclaiming the $65,000 level and attracting renewed institutional demand through US spot ETFs. Strong inflows, improving macro expectations, healthier on-chain activity, and stabilizing whale behavior all point toward a market that is rebuilding confidence.
However, the next phase depends on whether bulls can defend current support while overcoming resistance near $68,000. With the Federal Reserve meeting approaching, volatility is almost certain to remain elevated.
For now, Bitcoin has shifted the narrative from survival to recovery—but the next breakout still requires confirmation.
Disclaimer
This analysis is for educational and informational purposes only and should not be considered financial or investment advice. Cryptocurrency markets are highly volatile and involve significant risk. Always conduct your own research and consider your financial objectives before making any investment decisions.
#SummerCreationCamp
@Gate_Square
repost-content-media
#GUSDYieldRisesto3.8%
GUSD Yield 3.8%: The Evolution of Productive Stablecoins
Most people treat stablecoins as a parking space.
They convert profits into USDT or USDC, wait for the next market opportunity, and let their funds remain idle for days or even weeks. While waiting, that capital generates no return despite being one of the safest assets in a crypto portfolio.
The market is gradually moving away from that approach.
Instead of asking, "Where should I park my funds?" investors are asking, "How can my capital continue working without sacrificing liquidity?"
Gate's latest GUSD update re
MrFlower_XingChen
#GUSDYieldRisesto3.8%
GUSD Yield 3.8%: The Evolution of Productive Stablecoins
Most people treat stablecoins as a parking space.
They convert profits into USDT or USDC, wait for the next market opportunity, and let their funds remain idle for days or even weeks. While waiting, that capital generates no return despite being one of the safest assets in a crypto portfolio.
The market is gradually moving away from that approach.
Instead of asking, "Where should I park my funds?" investors are asking, "How can my capital continue working without sacrificing liquidity?"
Gate's latest GUSD update reflects exactly this shift.
A New Stage for GUSD
GUSD has become more than a simple stablecoin issued inside the Gate ecosystem.
Users can now mint GUSD 1:1 using USD1, alongside the previously supported USDT and USDC. This expands flexibility and gives users more ways to enter the ecosystem without unnecessary conversions.
At the same time, the current annual yield has increased to 3.8% APR, with rewards distributed automatically every day before 12:00 UTC.
Another major improvement is the launch of Fast Redemption, allowing eligible users to redeem GUSD back into their original minting currency through a dynamic fee-free quota, making access to liquidity significantly faster than traditional redemption methods.
The circulating minted supply has already exceeded $230 million, showing growing confidence in the product.
Why This Matters
Crypto investing is no longer only about price appreciation.
Today, efficient investors look for ways to generate returns even while waiting for their next trading or investment opportunity.
Holding idle stablecoins creates opportunity cost.
By converting eligible stablecoins into GUSD, users can begin earning daily yield without locking their assets for extended periods.
This changes stablecoins from passive storage into productive capital.
Multiple Entry Options
One of the strongest improvements is support for multiple minting assets.
Users now have the flexibility to mint GUSD using:
• USD1
• USDT
• USDC
This reduces unnecessary transfers between different stablecoins and creates a smoother experience for users operating within the Gate ecosystem.
As liquidity becomes more fragmented across different stablecoins, this flexibility becomes increasingly valuable.
Daily Yield Instead of Waiting
Unlike products that distribute rewards weekly or monthly, GUSD distributes earnings every day.
Daily distribution offers several advantages:
• Faster compounding
• Better visibility of returns
• Continuous reward generation
• Improved capital management
Rather than waiting weeks before seeing rewards, users receive them automatically while holding GUSD.
Capital That Keeps Working
The biggest innovation is not simply the 3.8% APR.
It is the ability to continue earning while using GUSD throughout different ecosystem products.
For example, eligible GUSD can continue generating minting rewards while participating in supported opportunities such as Launchpool or selected Pre-IPO subscriptions.
Instead of choosing between earning yield or participating in new opportunities, users may benefit from both simultaneously where supported.
This significantly improves overall capital efficiency.
Where the Yield Comes From
A healthy yield should have sustainable foundations.
GUSD's return is supported through a combination of:
• Real-world Treasury-backed assets
• Gate ecosystem revenue
• High-quality stablecoin yield strategies
This diversified structure helps reduce dependence on promotional incentives or unsustainable reward emissions.
As real-world asset adoption continues growing across crypto, combining traditional income sources with blockchain infrastructure is becoming an increasingly important trend.
Liquidity Remains Important
Generating yield has little value if users cannot access their funds when needed.
Fast Redemption addresses this concern by enabling near real-time redemption within available fee-free quotas.
If quota limits are reached, standard redemption remains available.
This creates a balance between liquidity and operational stability.
Advantages Compared With Traditional Stablecoin Holding
Keeping stablecoins idle offers security but no productivity.
Many traditional earning products introduce lock-up periods, delayed withdrawals, or changing interest structures.
GUSD focuses on:
• Daily reward distribution
• Flexible redemption
• Multiple minting options
• Integration across Gate products
For many users, this creates a more practical balance between accessibility and passive returns.
Important Risks Investors Should Understand
Every financial product carries risk.
Several factors deserve attention.
The current 3.8% APR is variable, not permanently fixed.
Future changes in interest rates, Treasury yields, or ecosystem revenue may affect future returns.
Fast redemption depends on available fee-free quotas.
During periods of unusually high redemption demand, users may need to use the standard redemption process.
Platform performance also matters because part of the yield originates from ecosystem revenue rather than Treasury income alone.
Regulatory developments across different jurisdictions may also influence product availability over time.
Understanding these factors helps investors make informed decisions instead of focusing only on advertised returns.
Market Perspective
Real-world assets continue becoming one of the fastest-growing sectors in digital finance.
Institutional investors increasingly seek blockchain products backed by traditional financial assets rather than purely speculative yield.
GUSD fits directly into this trend by combining blockchain efficiency with real-world income generation.
If adoption continues expanding, productive stablecoins could become a standard feature rather than a niche product.
Looking Ahead
Several developments will determine GUSD's future.
Growth in minted supply.
Expansion of ecosystem integrations.
Future interest-rate decisions.
Increasing adoption of RWA-backed financial products.
The product's long-term success will depend on whether it can continue delivering competitive returns while maintaining liquidity, transparency, and user confidence.
As crypto matures, investors are becoming less interested in simply holding assets and more interested in making every dollar productive.
GUSD represents that changing mindset.
Instead of waiting for the next opportunity, your capital can continue generating value every single day.
#SummerCreationCamp
@Gate_Square
repost-content-media
GUSD-0.02%
USDC-0.01%
USD1-0.01%
RWA-1.29%
View More