
Share your thoughts
placeholder
Article
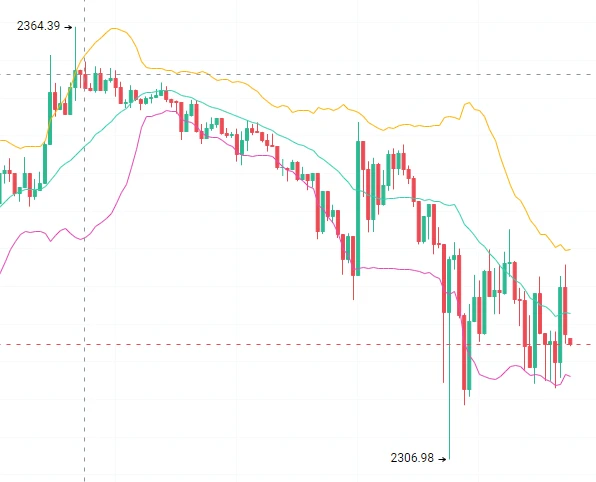
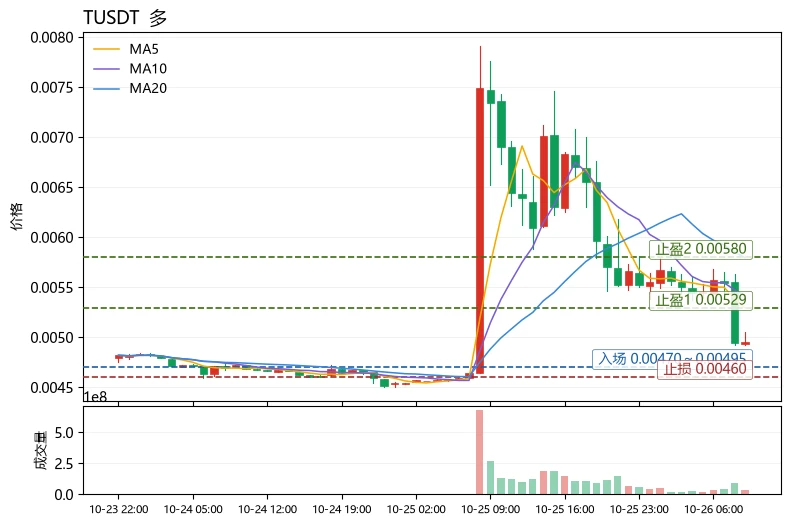
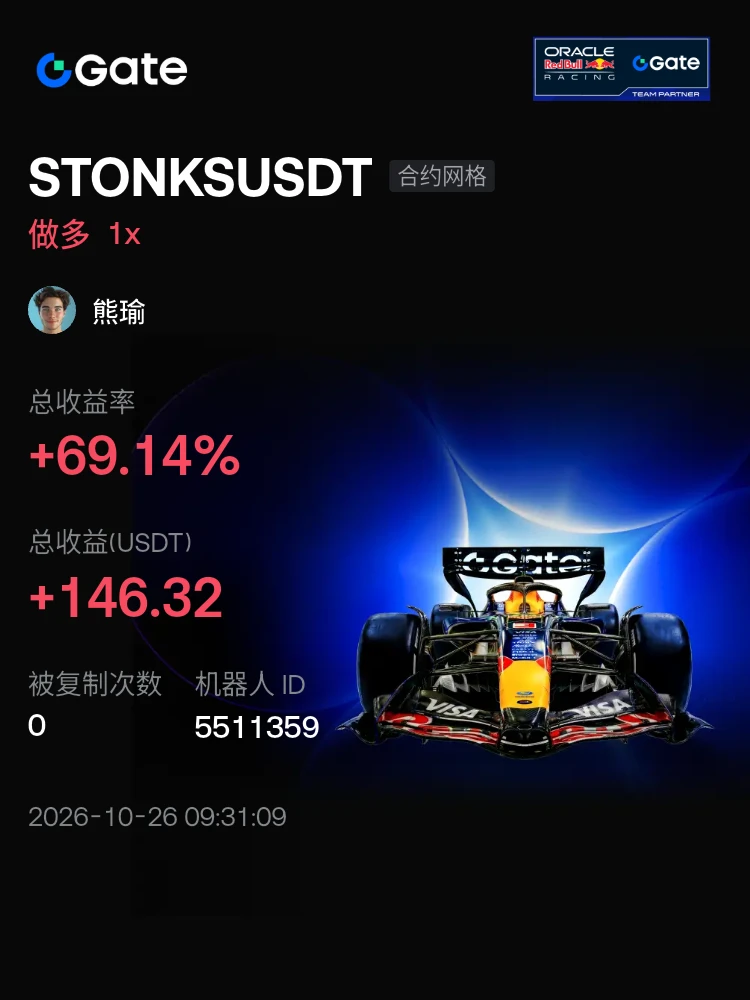
$LTC this time I’m taking a bullish-on-the-pullback approach. After the earlier breakout, I didn’t chase directly and waited until it pulled back near the key level before entering long. The price action hasn’t been particularly fast since entry, but it has continued to hold the key level, with buying support still present in the long-short battle.

After reaching +431.83%, I first closed 70% of the position. Taking some profit off the table makes me feel more secure, while I’ll continue watching how the remaining position performs around the key level. No conclusion can be drawn about 53.56
post-image
LTC-0.09%
SOL+0.10%
LAB-9.86%
#Gate主流CEXTop4 GATE HOLDS TOP 4 IN AUGUST WHAT THE NUMBERS ACTUALLY SAY
THE HEADLINE The August mainstream CEX rankings are out, and Gate held its position inside the global top four. The reported figures: roughly $40 billion in spot trading volume and approximately $285 billion in derivatives volume across the month, placing the platform fourth among mainstream exchanges worldwide.
That is a position earned in a difficult month, not an easy one.
THE AUGUST BACKDROP August was not a quiet month for exchange flows. Aggregate derivatives volume across major venues rose by roughly 14% month-on-mo
BTC-0.03%
ETH+0.41%
$1000 to $100,000 Crypto Trade Challenge Today
live-cover
LIVE558
It has to be Pinduoduo…
The brand-new iPhone 18 Pro 256G is priced at 9,999 on the official website,
but costs 9,699 on Pinduoduo😂
post-image
#SenateReleasesNewCLARITYAct
🔥 Senate Releases New CLARITY Act Is U.S. Crypto Regulation Entering a New Phase?
The U.S. Senate has released a revised 630-page version of the Digital Asset Market CLARITY Act, putting crypto regulation back at the center of the market narrative just ahead of the expected September 15 procedural vote.
For me, this is not simply another political headline. The bigger question is whether the United States is finally moving toward a regulatory structure that can clearly define how digital assets, exchanges, DeFi protocols and financial institutions should operate
post-image
  • 1
  • 1
Insiders are calling ZEC a trap, but the 1h data screams otherwise.

$ZEC /USDT - LONG

Trade Plan:
Entry: 1123.24 – 1129.98
SL: 1094.24
TP1: 1150.89
TP2: 1167.08
TP3: 1191.36

Why this setup?
Why now? The daily trend is bullish with a 95% confidence score, setting the stage for a move higher. The 1h price sits at 1126.61, right inside the entry zone between 1123.24 and 1129.98, offering a precise trigger. The 15m RSI at 48.19 shows room to run without being overextended, while the 1h ATR of 13.488792 signals a volatile push is imminent. The first target sits at 1150.89, with a second at 11
ZEC+0.05%
Everyone is missing the real move happening inside SYMBOL right now.

$XAU /USDT - SHORT

Trade Plan:
Entry: 4358.10 – 4359.56
SL: 4364.65
TP1: 4354.47
TP2: 4351.56
TP3: 4347.20

Why this setup?
Why now? The 1h price is holding 4358.83 inside a tight range while the 15m RSI sits at 64.64, meaning momentum is still leaning bullish and a sudden short burst could catch longs off guard. The 1h ATR of 2.908477 shows the market is volatile enough to push from the entry zone at 4358.10 4359.56 down to TP1 at 4354.47 and further to TP2 at 4351.56 in a single session. This aligns with the daily rang
XAU+0.05%
  • 1
Financial News, Crypto Market Updates, and Real Trading Strategies
live-cover
LIVE1,499
#8月CPI数据出炉
CPI Changed the Fed Debate — But PPI Made the Picture More Complicated
August U.S. CPI has given the market an important signal, but in my opinion the real opportunity is understanding the complete macro chain rather than looking at one inflation number alone. August CPI increased 0.4% month over month and 3.4% year over year, while core CPI rose 0.3% monthly and 2.4% annually. At the same time, August PPI increased 0.4% monthly and accelerated to 5.4% year over year from 4.8%. This combination explains why traders are seeing higher volatility across Bitcoin, Ethereum, gold, U.S.
CryptoMishu
#8月CPI数据出炉
CPI Changed the Fed Debate — But PPI Made the Picture More Complicated
August U.S. CPI has given the market an important signal, but in my opinion the real opportunity is understanding the complete macro chain rather than looking at one inflation number alone. August CPI increased 0.4% month over month and 3.4% year over year, while core CPI rose 0.3% monthly and 2.4% annually. At the same time, August PPI increased 0.4% monthly and accelerated to 5.4% year over year from 4.8%. This combination explains why traders are seeing higher volatility across Bitcoin, Ethereum, gold, U.S. stocks and the wider crypto market.
The important point is that inflation has not disappeared. Headline CPI remains at 3.4%, above the Federal Reserve's 2% objective, while producer inflation is much hotter at 5.4%. Energy prices have also become an important variable because higher oil prices can eventually increase transportation, production and consumer costs.
1. Will August CPI Change Expectations for the Federal Reserve?
My answer is yes, but not in a simple one-directional way.
The 0.4% monthly CPI increase was broadly in line with expectations, so the report was not an inflation shock. However, it confirmed that price pressures remain sticky. Core CPI at 2.4% annually is closer to the Fed's objective, but still above 2%.
The bigger complication is PPI. Producer prices increased 0.4% in August and 5.4% year over year, accelerating from 4.8%. This means businesses are still facing significant price pressure, and some of those costs can eventually move through the economy.
After PPI, expectations for a September 25-basis-point Fed rate increase moved sharply higher, with some market measures later putting the probability in the roughly 80%–90% area. These probabilities can change quickly with new economic data, but the message is clear: traders are no longer treating inflation as a completely solved problem.
My view is that the Fed is facing a difficult balance. Cutting rates aggressively while inflation remains elevated could create renewed price pressure, while keeping policy restrictive for too long could weaken economic growth and employment.
For traders, this means every upcoming CPI, PPI, jobs, wage and energy-price release can create another volatility wave.
2. What Does This Mean for Crypto and U.S. Stocks?
Bitcoin recently traded around $77,000–$77,300. During the September 11 session, BTC moved approximately between $76,559 and $79,818, creating a high-to-low range of about 4.3%. That is significant volatility for a major asset and shows how sensitive BTC has become to macroeconomic headlines.
For me, $80,000 remains the key psychological resistance.
From $77,000:
$80,000 = approximately +3.9%
$82,000 = approximately +6.5%
$85,000 = approximately +10.4%
On the downside:
$76,000 = approximately -1.3%
$74,000 = approximately -3.9%
$70,000 = approximately -9.1%
I therefore would not call BTC strongly bullish simply because it bounced. I want confirmation through price, spot volume and liquidity.
Recent reporting also showed strong Bitcoin ETF demand, including roughly $1 billion of net inflows across a short period. That is important because institutional liquidity can support price even while macro uncertainty remains high.
If BTC holds $76K–$77K while ETF inflows remain healthy, I would view the structure more positively. If BTC breaks $80K with strong spot volume, the next areas I would watch are $82K, $83K and $85K.
Ethereum
Ethereum remains more sensitive to risk appetite and broader crypto liquidity.
My key ETH range is approximately $2,400–$2,530.
Above $2,530:
$2,600 = approximately +2.8%
$2,700 = approximately +6.7%
$2,800 = approximately +10.7%
Below $2,400:
$2,300 = approximately -4.2%
$2,200 = approximately -8.3%
My strategy would be to wait for confirmation instead of trying to predict the exact bottom. If BTC breaks $80K with strong volume and ETH simultaneously reclaims $2,530, capital rotation into major altcoins could become stronger.
If BTC loses $76K, however, I would become more defensive with ETH and smaller-cap assets.
U.S. Stocks: CPI Did Not Destroy the Rally
The U.S. stock market showed resilience after the inflation data.
On September 11, the Dow gained around 1.0% to approximately 52,573, the S&P 500 gained about 0.9% to around 7,657, and the Nasdaq gained roughly 1.0% to approximately 26,333.
However, the weekly picture was more mixed. The S&P 500 remained down around 0.8% for the week, the Dow around 1.6%, while the Nasdaq was down roughly 0.7%.
This tells me investors are balancing inflation against earnings, oil prices, economic growth and liquidity rather than reacting to CPI alone.
Treasury yields are particularly important. The 10-year yield recently approached 5%, while the 2-year yield was around 4.6%. If the 10-year yield breaks decisively above 5% and stays there, expensive growth and technology stocks could face additional valuation pressure.
On the other hand, if yields retreat while inflation expectations stabilize, technology and growth stocks could recover quickly.
That is why I would watch Treasury yields almost as closely as CPI.
Gold: Inflation Hedge vs Higher-Rate Pressure
Gold is also caught between two powerful forces.
Spot gold recently traded around $4,350–$4,400 per ounce. Gold recovered around 0.8% during one recent session after suffering a sharp decline, but it remains highly sensitive to movements in the dollar and Treasury yields.
Inflation, geopolitical uncertainty and safe-haven demand can push gold higher.
Higher Treasury yields and expectations for tighter Fed policy can push gold lower because gold does not provide interest income.
For me, $4,300–$4,400 is therefore an important observation zone.
A sustained breakout above $4,400 would strengthen the bullish structure.
A rejection around $4,400 followed by a move below $4,300 would signal caution.
3. Where Are the Biggest Trading Opportunities?
I see opportunities in volatility rather than blindly choosing one direction.
Bullish Scenario
If BTC holds $76K–$77K, ETF liquidity remains positive, Treasury yields stabilize and BTC reclaims $80K with strong volume, the next areas I would monitor are $82K, $83K and $85K.
A move from $77K to $85K would represent approximately 10.4%.
For ETH, a confirmed break above $2,530 could put $2,600, $2,700 and potentially $2,800 on the radar.
For U.S. stocks, declining Treasury yields would be particularly supportive for technology and growth sectors.
For gold, sustained strength above $4,400 could improve the bullish setup.
Bearish Scenario
If PPI remains elevated, oil stays above $100, Treasury yields break above 5% and the Fed communicates a more restrictive policy path, risk assets could experience another correction.
BTC below $76K could expose $74K.
Below $74K, the $70K psychological area becomes important.
A decline from $77K to $70K would be approximately 9.1%.
ETH below $2,400 could expose $2,300 and $2,200.
Growth stocks could also experience valuation pressure if the 10-year yield remains around or above 5%.
Gold could remain volatile because inflation supports demand while higher yields create resistance.
My Trading Plan
My strategy in this environment is confirmation first, position size second and prediction last.
For BTC:
Above $80K with strong volume = bullish confirmation.
$76K–$80K = high-volatility range; reduce position size and wait.
Below $76K = defensive setup; monitor $74K and $70K.
For ETH:
Above $2,530 = stronger bullish confirmation.
$2,400–$2,530 = waiting/range zone.
Below $2,400 = risk increases.
For U.S. stocks, I would closely watch the 10-year Treasury yield. Falling yields with stable index support would improve the setup for growth stocks, while a sustained move above 5% would make me more selective.
For gold:
$4,400 breakout = stronger bullish signal.
$4,300 breakdown = caution.
Liquidity and Volume Are More Important Than a Single Candle
One of my biggest lessons from this market is that price alone is not enough.
A 3% BTC move with weak volume can be completely different from a 3% move supported by strong spot buying.
I want to see increasing spot volume during a breakout, healthy ETF flows, stable funding conditions and strong liquidity around resistance.
Traders should monitor:
Spot volume
Futures open interest
ETF inflows and outflows
Funding rates
Liquidations
Stablecoin liquidity
Treasury yields
DXY direction
Oil prices
These indicators together provide a much clearer picture than one green or red candle.
The crypto market can also become thin during uncertain periods, meaning relatively modest buying or selling can create surprisingly large percentage moves. This is why liquidity conditions should always be considered when evaluating volatility.
Risk Management Is the Real Strategy
My strongest advice is simple: CPI and PPI days are not ordinary trading days.
When volatility expands, leverage can turn a normal 2%–4% market move into a major account drawdown.
I would rather miss the first part of a breakout than chase a candle after a sudden 5% move.
My preferred process is:
Wait for the initial data reaction.
Mark the high and low created after the release.
Watch volume.
Wait for a confirmed breakout or breakdown.
Define invalidation before entering.
Reduce position size when volatility expands.
Avoid excessive leverage.
Take partial profits at planned levels instead of waiting for a perfect top.
Most importantly, TP1, TP2 and TP3 are planning zones, not guaranteed outcomes.
Final Market Outlook
My overall view is cautiously constructive but highly data-dependent.
August CPI at 3.4% year over year and 0.4% month over month did not produce an inflation surprise, but it confirmed that inflation remains above the Fed's 2% objective. Core CPI at 2.4% is improving, yet the 5.4% annual PPI reading makes the inflation picture more complicated.
Oil is another major variable. Brent recently moved above $100 and briefly approached $110 before pulling back, keeping inflation expectations sensitive to energy prices.
This explains the current volatility.
BTC is fighting around $77K–$80K.
ETH is fighting around $2.4K–$2.53K.
Gold is fighting around $4.3K–$4.4K.
The S&P 500 is around 7,657.
The Nasdaq is around 26,333.
The Dow is around 52,573.
The 10-year Treasury yield is close to 5%.
Brent crude remains above $100.
This is not a market where I would blindly chase price. It is a market where I would watch liquidity, volume, yields and confirmation.
My most important market chain remains:
CPI → PPI → Oil → Treasury Yields → Fed Policy → Dollar → Liquidity → U.S. Stocks → Bitcoin → Ethereum → Altcoins.
If inflation stabilizes and yields fall, risk assets could receive another liquidity boost.
If inflation remains sticky and yields stay near 5%, volatility can remain elevated.
For me, BTC above $80K with strong volume is the confirmation I want before becoming more aggressive. Below $76K, I would shift toward capital protection. For ETH, $2,530 is the key confirmation level. For gold, $4,400 is the important upside area while $4,300 is the key downside zone.
The biggest opportunity may not be predicting the next candle. It may be preparing for both directions and allowing price, volume and liquidity to tell us which scenario is actually developing.#weeklyshare #ShareWeekly
repost-content-media
  • 2
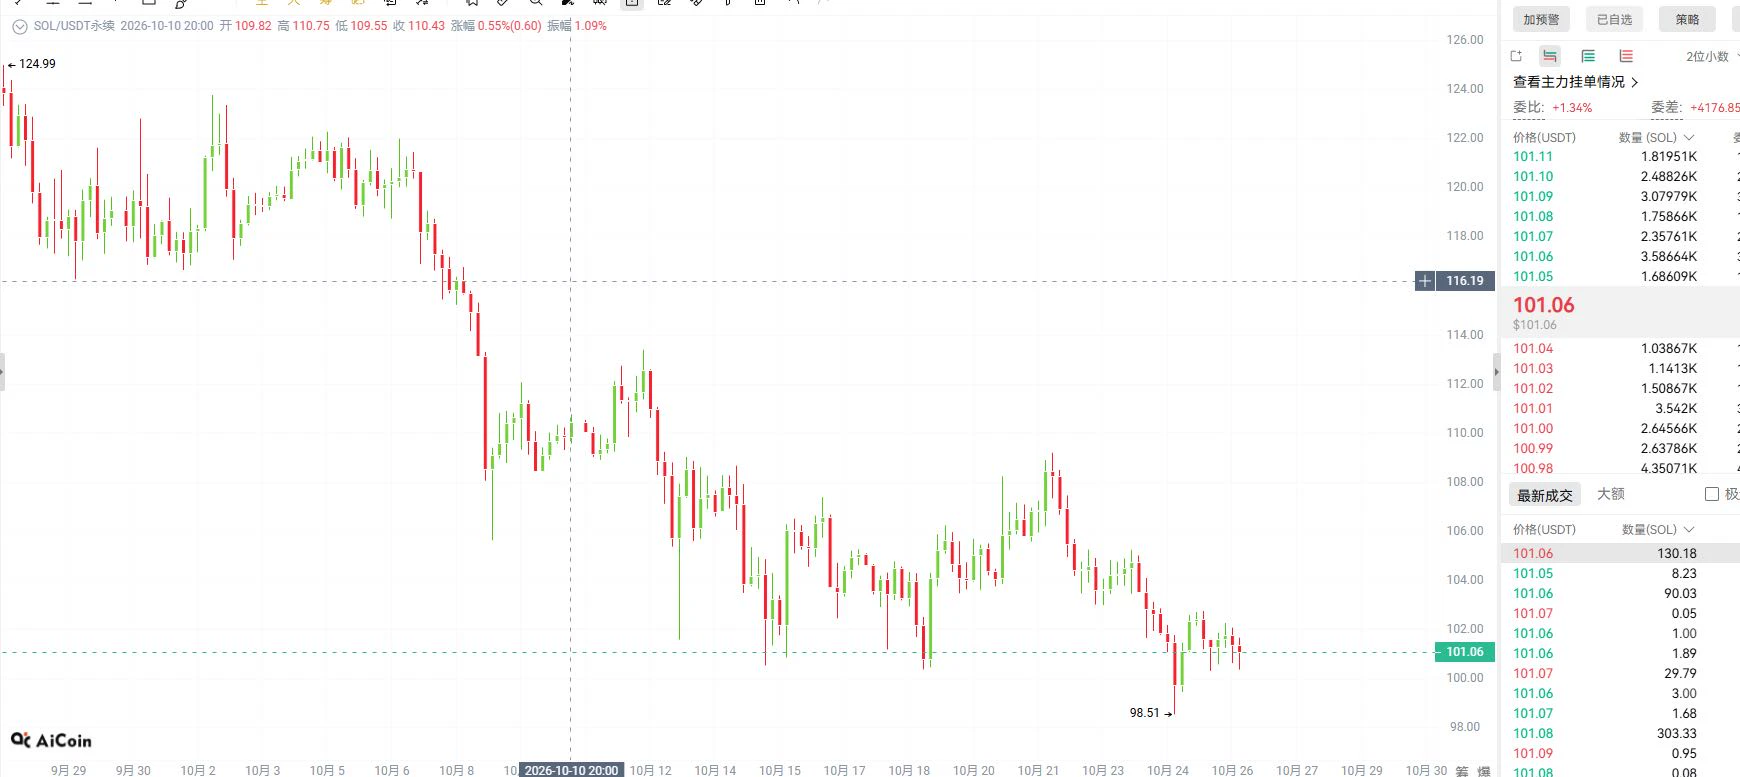
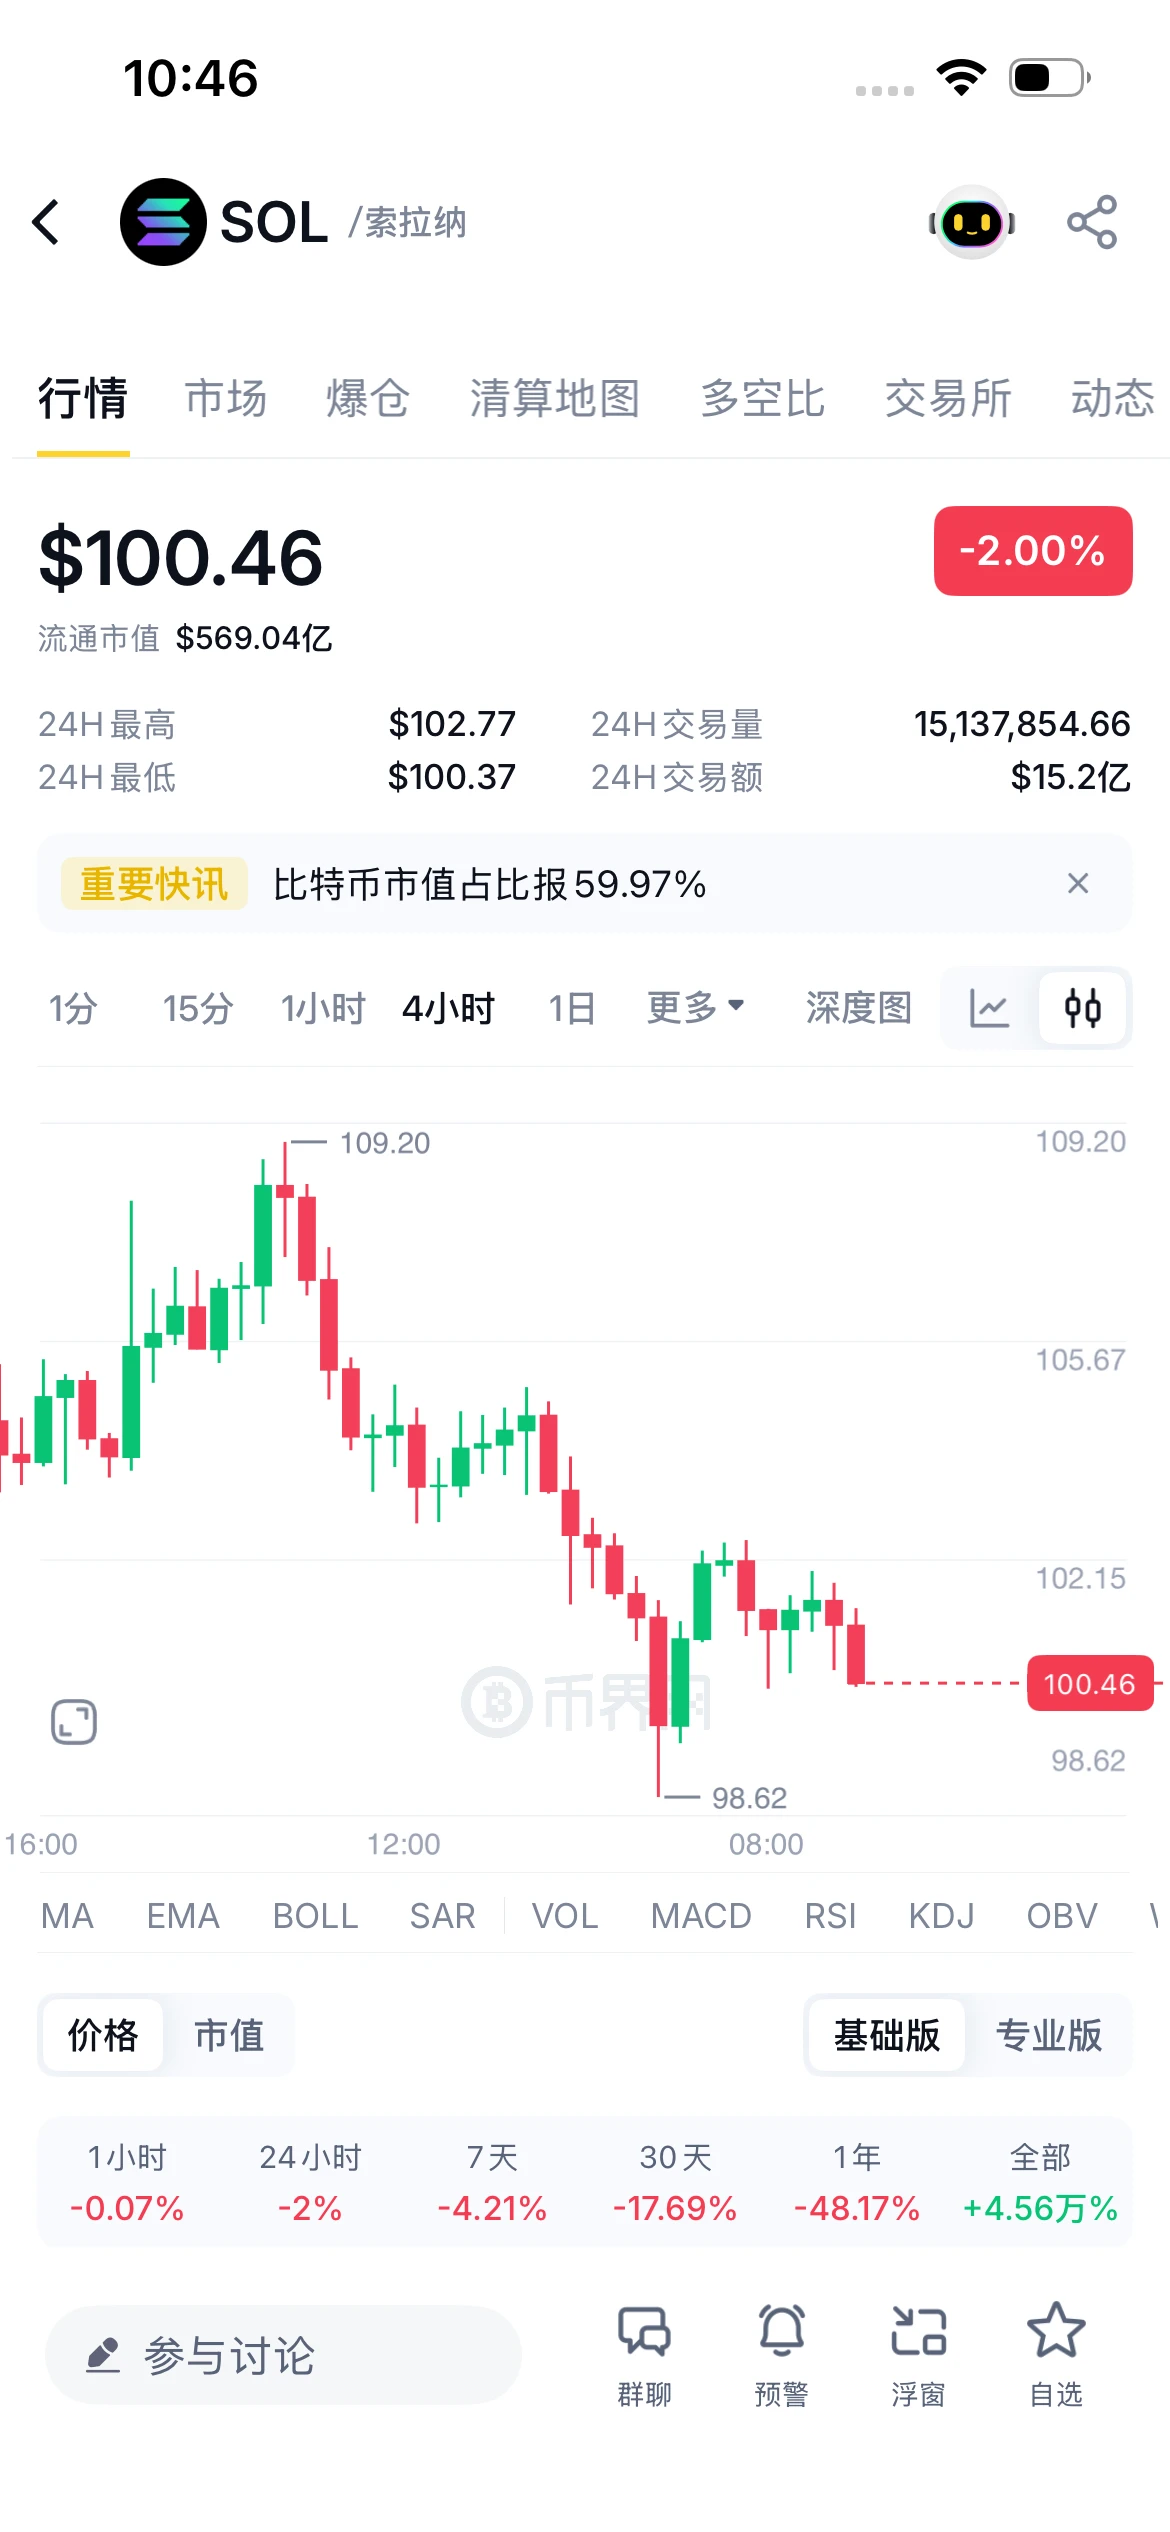
solana:DrdwSUzt5ZMqa9Yj1cpvNRRx7zQZP5s9Gm2S8m62STNK strange dump had to scoop up some
DrdwSUzt5ZMqa9Yj1cpvNRRx7zQZP5s9Gm2S8m62STNK
#memecoin #crypto $sol
post-image
SOL+0.05%
Next week will bring another wave of news catalysts. The market is still moving within a range, with BTC at 82,000-76,000, and it has been ranging for nearly a month. If the gap cannot be filled upward, we’ll continue watching the downside. Before the bull market returns, there will definitely be another major drop. We’ll wait and see. Currently holding a short position at 81,750.
Additionally, according to Coinglass data,
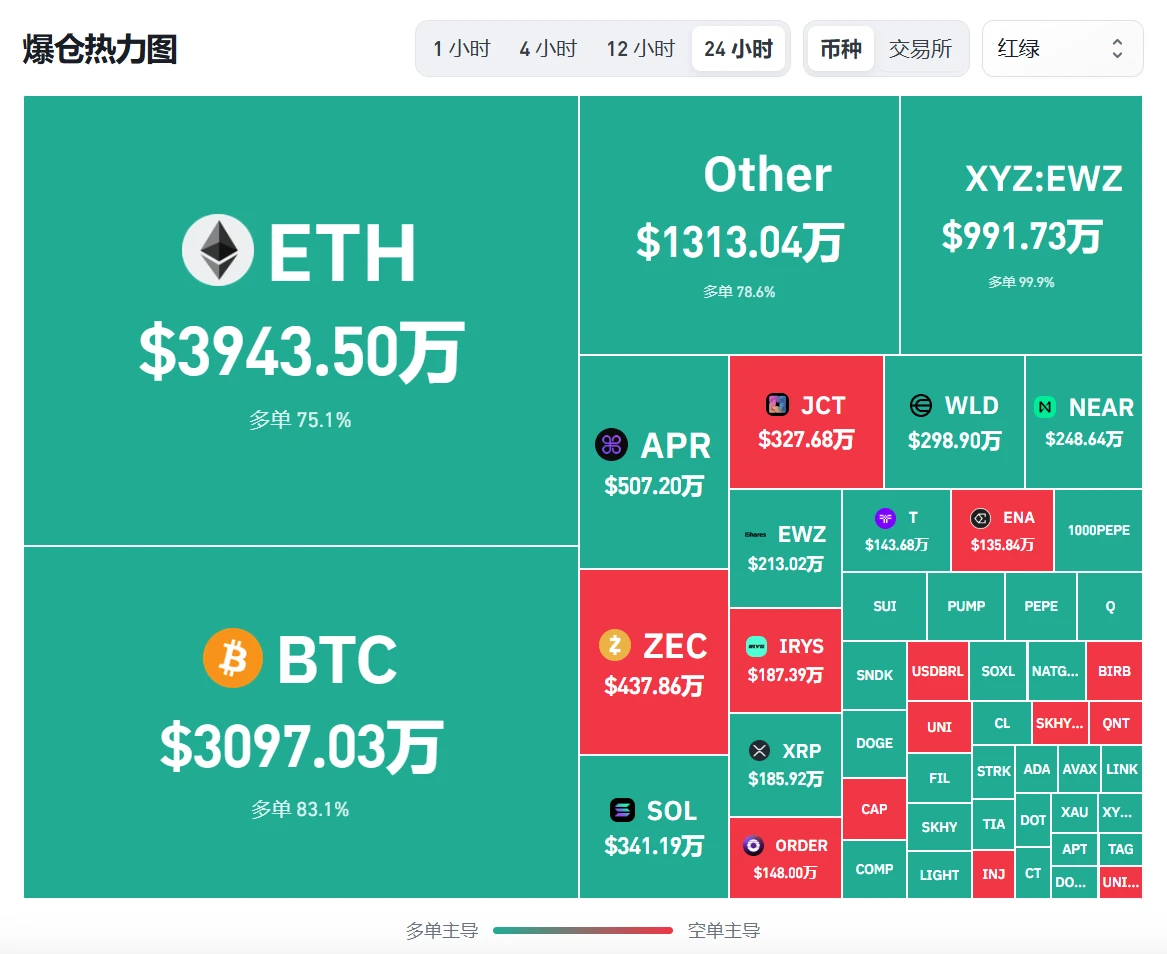
If BTC breaks above $80,574, the cumulative liquidation intensity of short positions on major CEXs will reach $682 million; if BTC falls below $73,944, the cumulative liquid
BTC-0.03%
  • 1
just saw this update on coindesk and had to share. a major digital bank got tricked by a fraudulent government request exposing user passports and bitcoin transaction activity. no funds were lost which is a huge relief ngl but data leaks like this are always stressful to see. makes you realize why self custody and keeping personal info locked down matters so much these days. #CryptoNews #Bitcoin #GateIdleEarnAutoYieldUpTo3% #GateLaunchesTrenchesWith0GasFee
post-image
BTC-0.04%
CZ: The market gives you plenty of opportunities to enter (or exit). All you have to do is to make the right decisions
What's the right decision right now?
post-image
I’m handling this short position with an 80/20 approach: take most profits off the table first, and let the remaining 20% ride to see if the move continues. $BEAT repeatedly faced resistance at the key level, failed to hold the breakout, and then confirmed weakness on the retest, so I leaned bearish. There was a rebound while holding, but it failed to reclaim the key level, and I never moved the protection level.

The unrealized profit is now +603.99%, and I don’t plan to bet all the profits on an acceleration. As long as the previous low holds and price quickly recovers, the short side rema
post-image
BEAT-2.82%
SNDK-0.66%
BTC-0.03%
Remember those who are kind to you, because they did not have to be. — *Spirited Away*
They said it’s #memeseason but it feels like Crime season
$@ansem
AVABnbdabYGmz4M651hW3GbULvLJ95oi4H8PFQVeBQFV
post-image
ANSEM+16.91%
September 13 $BTC Comprehensive Market Analysis
News:
Friday’s CPI cooled year-over-year but ran hot month-over-month, surging to nearly 80,000 in a false breakout. The probability of a 25bp FOMC rate hike on 9/16 is around 85%, which is the actual pricing window. OSFI and the Liquid hack are just noise.
Fund flows:
Spot ETFs saw outflows for four consecutive days from 9/8–11, totaling about $460 million, including a single-day outflow of $280 million on 9/10. ETH ETFs, on the other hand, saw inflows. Funding rates were slightly positive, the Fear & Greed Index was at 61, and volume contracte
GT-0.42%
BTC-0.04%
ETH+0.41%
The $25,690 whale buy order was made into big news: MET surged to 0.2563 before pulling back
Good grief, a $25,690 whale buy order somehow became $MET big news—the price action front-ran the move to 0.2563 before pulling back to 0.2412. The direction is clear first: I’m bullish and treating this as a shakeout.
The whale only bought $25,690 worth of MET, which is nothing compared with 4,773,735 USDT in 24-hour trading volume—not even a fraction.
The money in the market is real, though—up 8.259% over 24 hours, with volume 2.525 times the 30-day average, RSI at 59.9 and not overbought, and the M
MET+9.15%
I just casually hit refresh, and it pumped on its own, leaving me completely caught off guard. 😂

The last thing I saw before bed a few days ago, $BTW was still bottoming around 0.377246. Honestly, no one could tell which way it would go at the time, but I noticed funds were quietly moving in. Someone kept buying every dip; when it bottoms without breaking down, that’s often the night before a breakout. So I placed a buy-the-dip order and left it alone.

When I woke up this morning, I saw that the current price had already surged to 0.554158, with +467.03% in the bag? I froze for a few sec
post-image
BTW+7.85%
XRP+0.17%
SNDK-0.66%
A few days ago I was still calculating whether I had enough money for instant noodles this month; this morning I was already wondering whether to add a sausage.
A few days ago $OKB pulled back to 96.30. Many people saw the green candles and ran, but buying pressure clearly strengthened at that level. I saw it as an opportunity and went long right away. I had just one thought at the time: don’t mess around—hold it first and see.
When I opened the chart again today, the price had already run up to 114.24, with +456.14% secured. Looking back at the whole trade, there’s only one takeaway: assets
post-image
OKB-0.37%
SOL+0.10%
LAB-9.86%
Load More

Join 40 M users in our growing community

⚡️ Join 40 M users in the crypto craze discussion

💬 Engage with your favorite top creators

👍 See what interests you