Square
Following
Hot
News
Notifications
Profile
Share your thoughts
placeholder
Article
History is always strikingly similar
The machinery of the state operates through mechanisms and laws
rather than through any single supreme decision-maker.
post-image
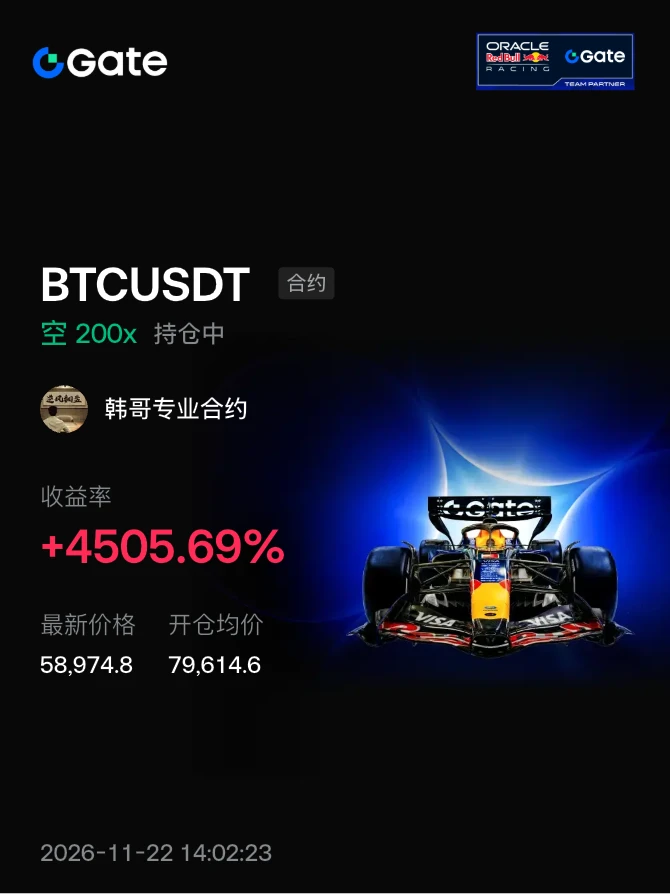
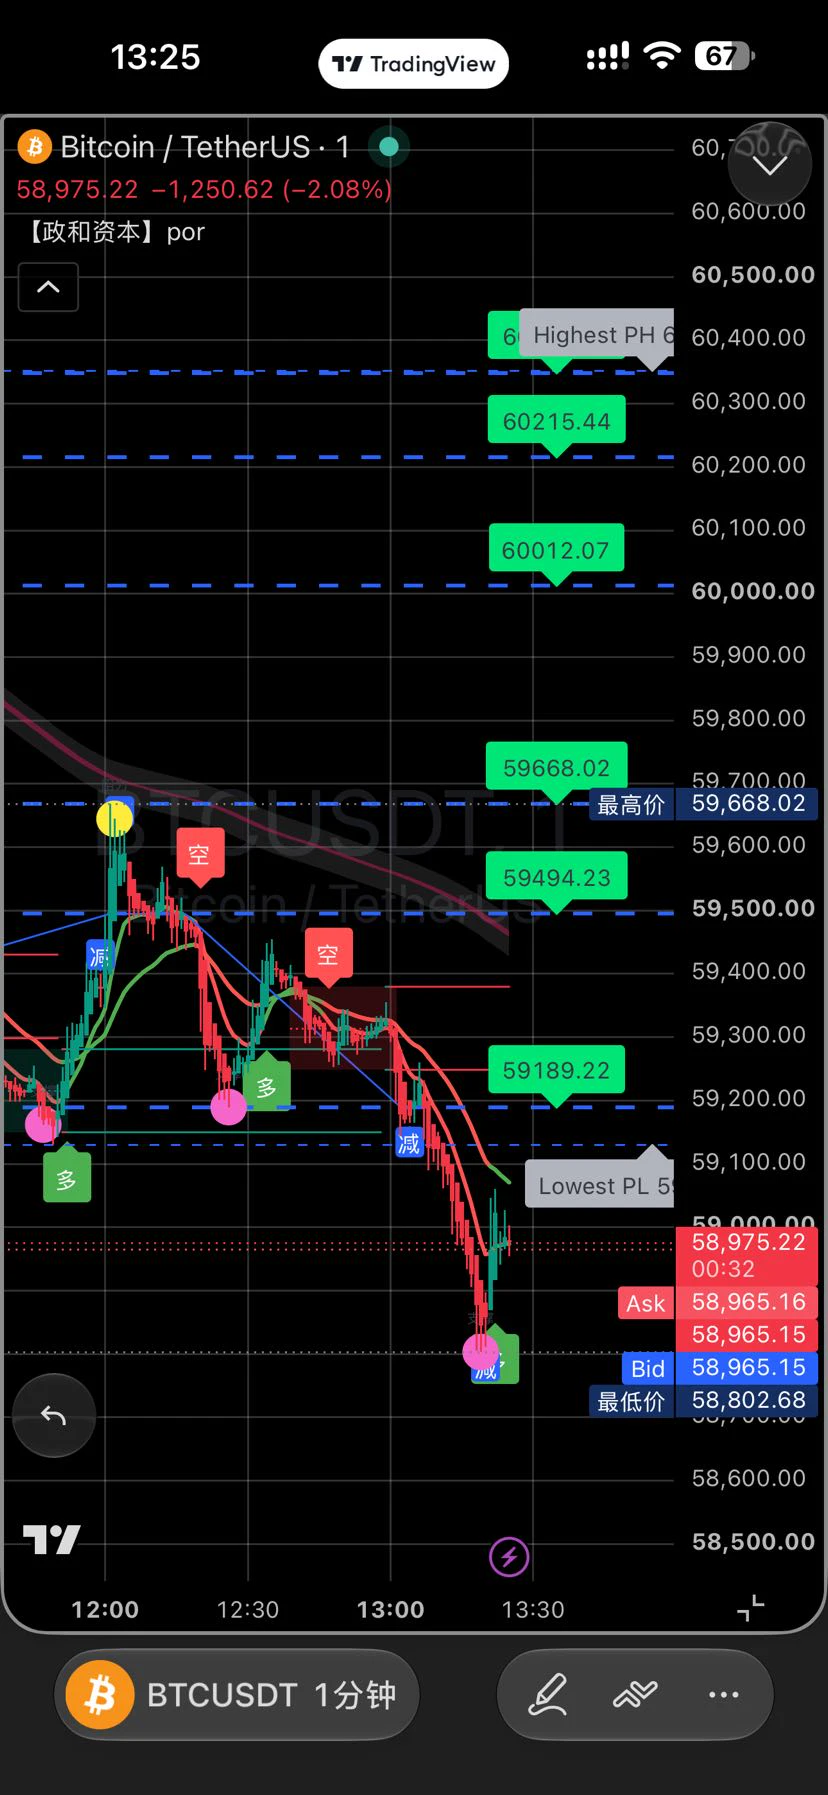
A 4507% short position, entered at 79614.6, currently at 58974.9. Discipline: stop-loss at 62000; take profits in stages at 55000 and 52000; position size no more than 10%.

Looking at the bigger picture: $BTC failed to break 80,000, with lower highs marking the start of a correction cycle. Macroeconomic rate expectations are weighing on risk assets.

The risk is that 200x leverage is extremely sensitive—a tiny wick can trigger liquidation. It is currently deeply oversold, making the position very unpleasant to hold.

Trend-wise, if it breaks below 55,000, 50,000 is in sight; otherwise, expec
post-image
BTC-0.65%
ETH-1.23%
SOL-0.74%
  • 2
Trenches
IDOL
I
bade
b
IDOL
0x3b...ab07
Market Cap
$.
Change
.
24h Vol
$.
Holders
.
JAGENT
J
bade
b
JAGENT
0x8e...ae15
Market Cap
$.
Change
.
24h Vol
$.
Holders
.
PIEVERSE
P
bade
b
PIEVERSE
0x0e...25a9
Market Cap
$.
Change
.
24h Vol
$.
Holders
.
FIONA
F
bade
b
FIONA
B34n...pump
Market Cap
$.
Change
.
24h Vol
$.
Holders
.
mihao
m
bade
b
mihao
4Cxj...pump
Market Cap
$.
Change
.
24h Vol
$.
Holders
.
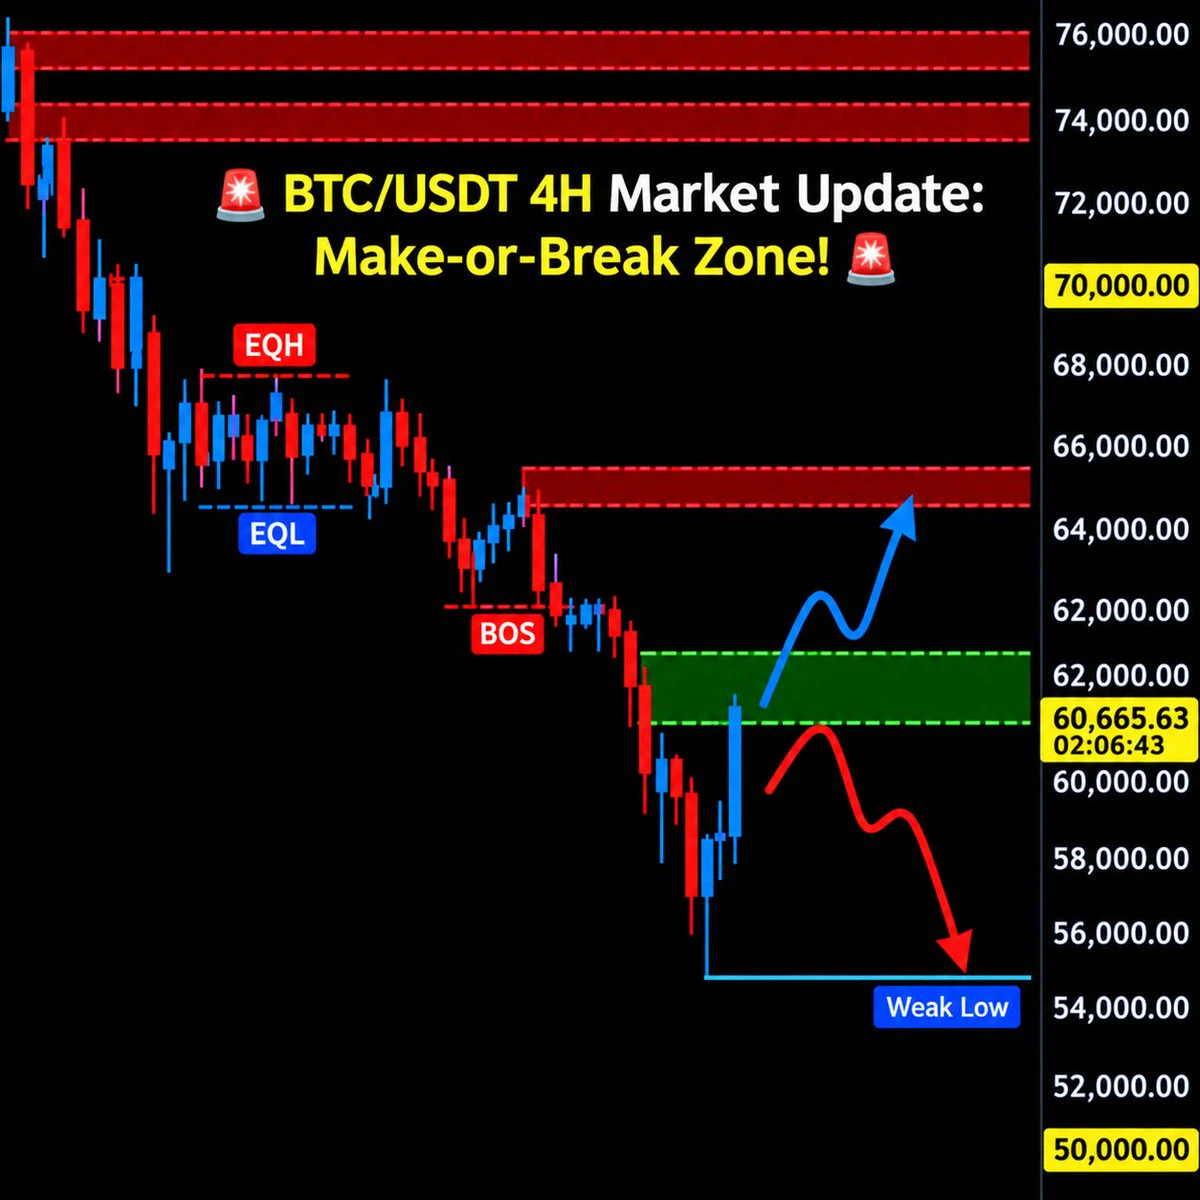
🚨 BTC/USDT 4H Market Update: Make-or-Break Zone! 🚨
Bitcoin is currently sitting at $60,665 right inside a critical decision zone ($59,800 – $61,500) after a sharp drop to $55,000.
With the overall trend still bearish and that $55,000 bottom acting as a "Weak Low," here are the two scenarios to watch next:
📉 Scenario 1: Rejection & Drop (Bearish)
If sellers defend this green zone and price gets rejected around $60,600, expect another leg down to sweep the $55,000 low.
📈 Scenario 2: Breakout & Bounce (Bullish)
If buyers push price cleanly above $61,500 and hold it as support, BTC could ra
post-image
BTC-0.67%
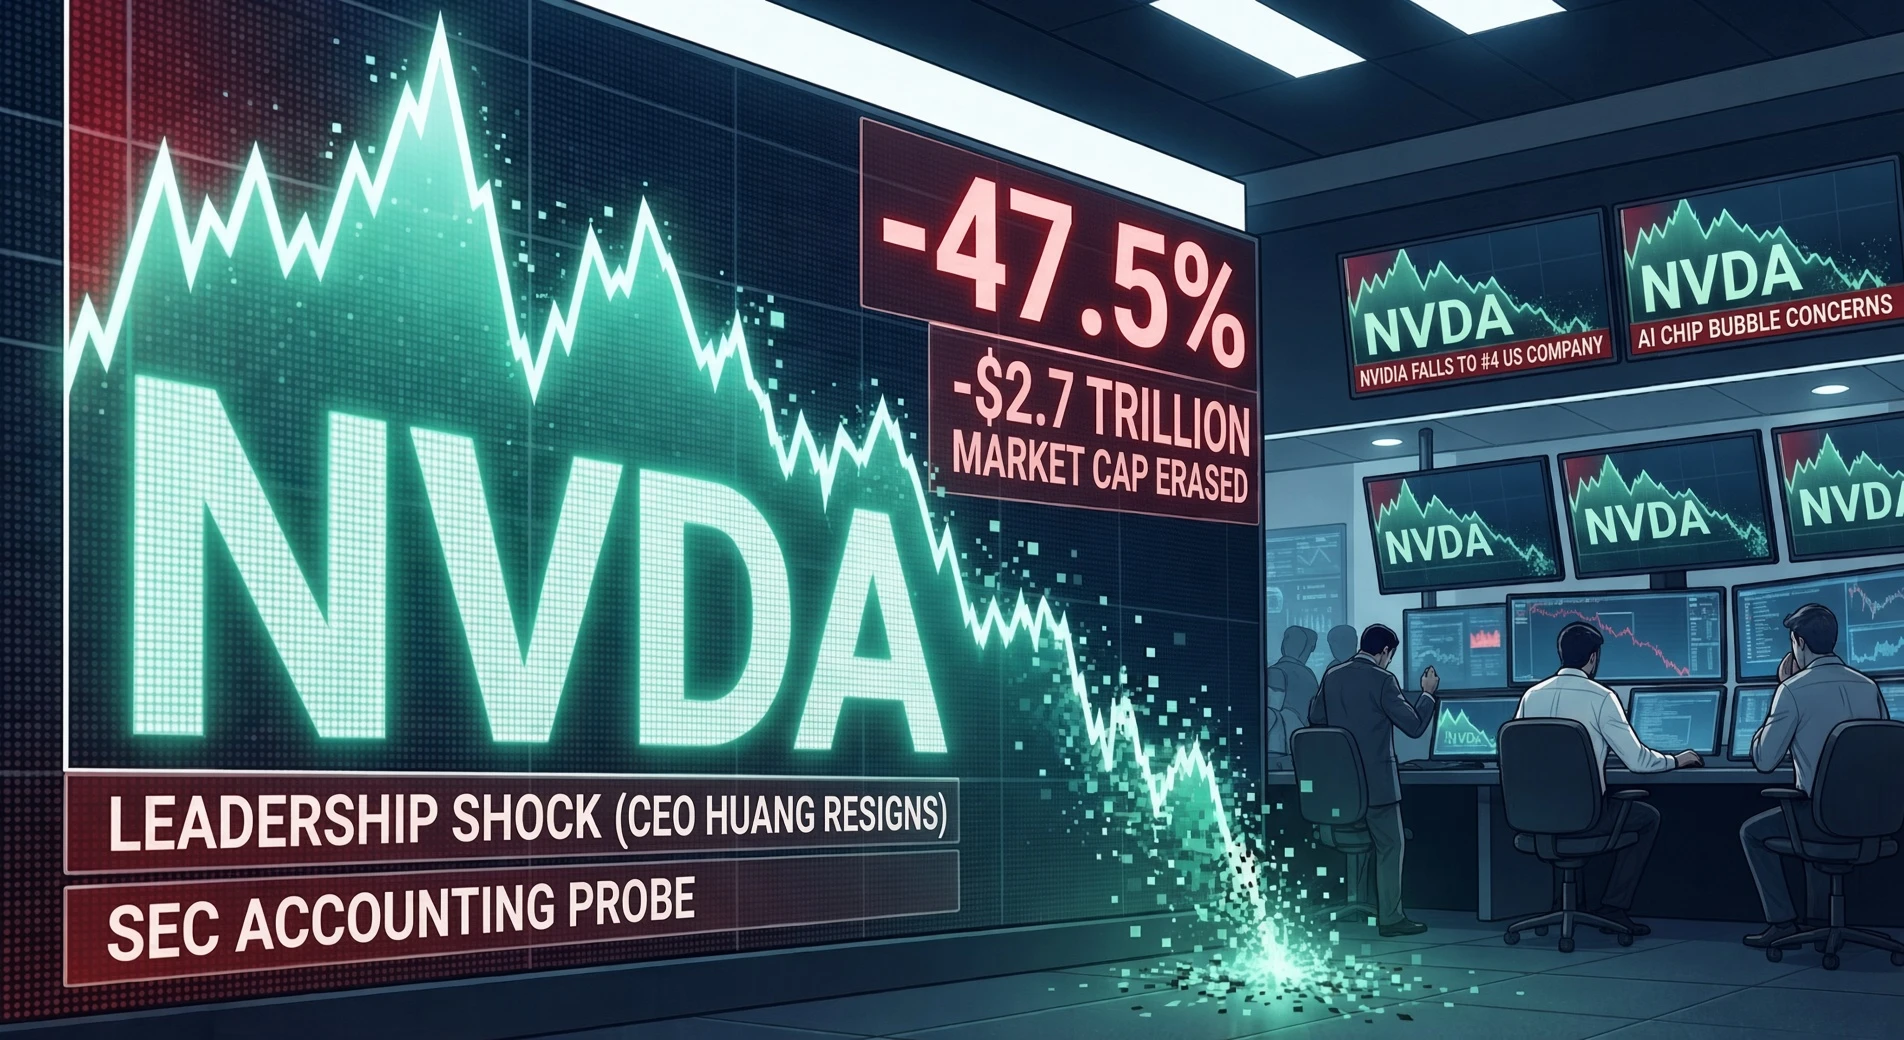
Historic Selloff: Nvidia Wipes Out $2.7 Trillion in 1.5 Months

Between its all-time high in early October 2026 and November 20, 2026, AI chip giant Nvidia (NVDA) lost roughly $2.7 trillion in market capitalization—erasing nearly 47% of its value (dropping from ~$5.77 trillion to ~$3.0 trillion) and marking its longest weekly losing streak since the 2008 financial crisis.

3 Key Drivers Behind the Rout:

- Leadership Shock: Co-founder and CEO Jensen Huang abruptly resigned in mid-November following personal scandals involving ties to a businesswoman suspected of intelligence links and U.S. exp
post-image
NVDAG-0.24%
The data-heavy week before Thanksgiving has brought “whether to hike in December, and by how much” to the fore. The October meeting minutes showed that nearly all participants considered further rate hikes appropriate; markets expect core PCE inflation to rise from 3.1% year over year to 3.2%, while the Royal Bank of Canada forecasts 3.3% and expects both headline and core prices to rise 0.3% month over month, signaling that inflation is accelerating again. If Wednesday’s PCE report and Thursday’s Beige Book confirm this, rate expectations will tighten further. Over the past week, the Nasdaq f
post-image
NAS100-0.07%
  • 1
The differences between spot and perp $BTC chart is the 2022 cycle low anchored vwap
Spot side is above avwap while perp side is still below the avwap. Until both side trended above on the weekly then it is safe to bet again the low is in. 67.3k continue to act as HTF resistance for now.
post-image
BTC-0.67%
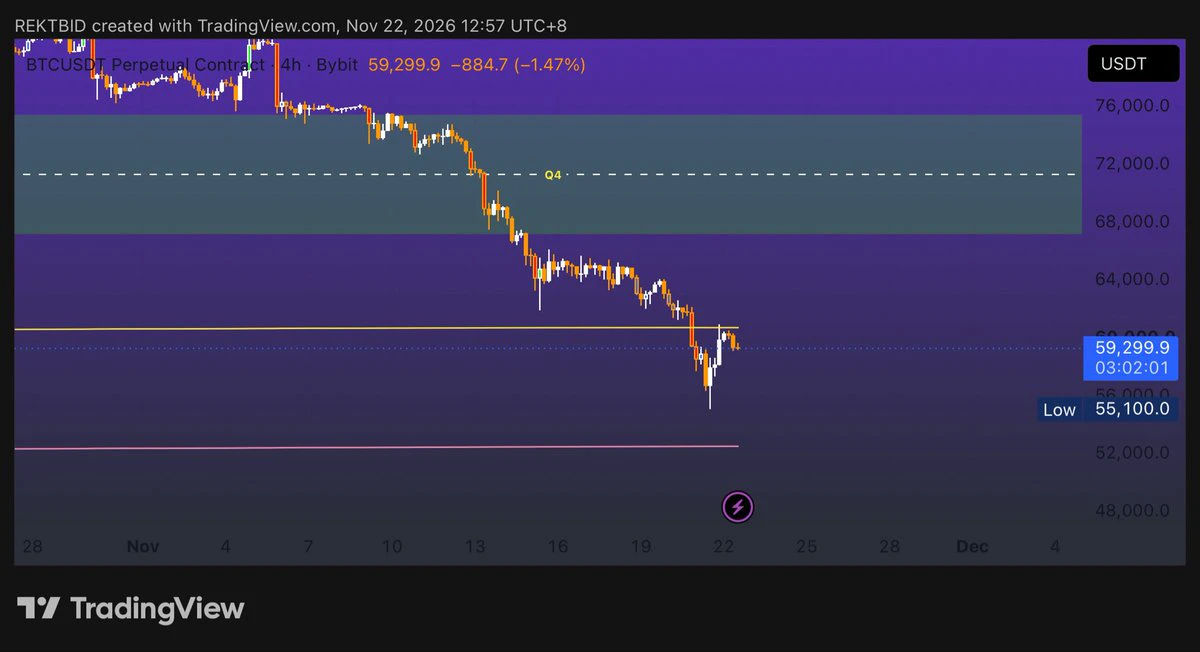
#BTC跌破6万美元关口 It is still too early to confirm that the bottom is in. The price briefly fell below $60k and then recovered, which looks more like an oversold bounce than a sign that capital flows have turned positive. It needs to hold $60k first and then climb back above $63k before stabilization can be said to have begun.

Where things stand
· November 21: It briefly fell to $55,130, its lowest level since September 2024.
· Morning of November 22: It recovered to around $60,300, up about 2% over 24 hours.
· Nature of the rebound: This 9% rebound was driven mainly by short covering and liquidat
BTC-0.67%
$HYPE 60.5, 24H +6.42%. It has rebounded from the lows to 60.5—a sizable gain—but the short-term trend hasn’t fully turned bullish yet. I don’t want to mistake a rebound for a reversal. This looks more like a recovery than the start of a new trend. 61.9 is resistance; I’d only look higher once it holds above that level. A break below 55.88 would weaken the short-term outlook. Volume hasn’t followed through, so I won’t chase until a breakout is confirmed. This is a level to watch closely right now. Let’s watch the market and not rush—I’d rather wait for a clear direction. Not investment advice.
post-image
HYPE+0.24%
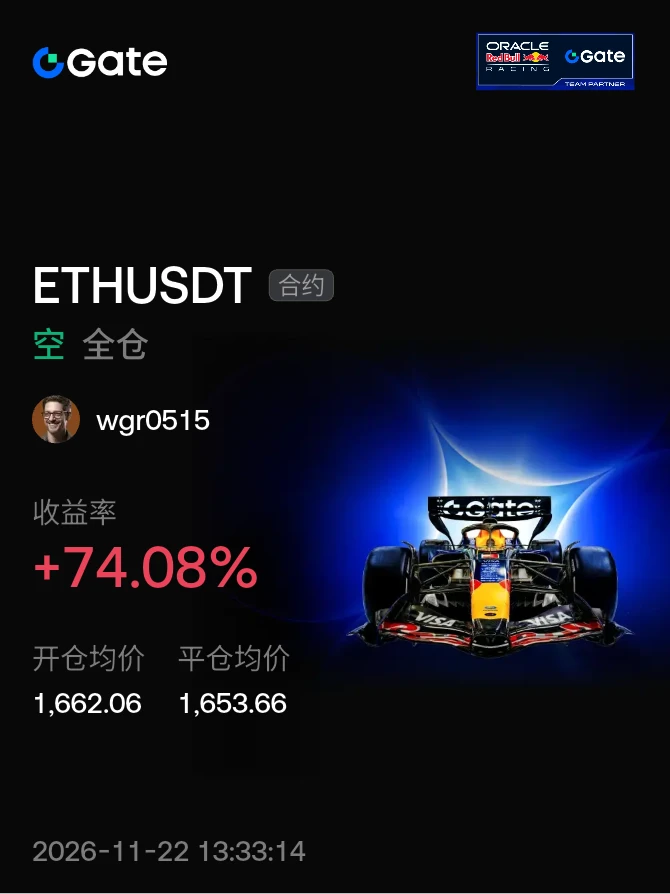
#晒出我的合约收益 The market is currently highly volatile, and the rebound is driven more by short covering after leveraged liquidations and oversold buying than by a fundamental improvement in spot demand. Do not mistake the rebound for a reversal; before the trend is clear, controlling position sizes and avoiding high leverage are the top priorities.$ETH
post-image
ETH-1.23%
November 22, 2026 (Sunday) SOL Futures Strategy Analysis for Today (based on the current range of approximately $69.5–$70.5)
Core View (Bearish Bias; Caution on Oversold Bounce)
SOL has fallen sharply from above $80, touching near $65 over the past two days before rebounding to around $70. The daily chart structure is bearish, while the RSI is in oversold territory, leaving room for a short-term technical bounce, though overhead resistance is significant. With lower liquidity on Sunday, prioritize watching for a rejection on a bounce as a short entry, or consider longs only after a pullback to
post-image
SOL-0.74%
BTC market Ubdates
live-cover
LIVE2,683
BTC-0.67%
ETH-1.26%
TODAY LIVE UPDATE
live-cover
LIVE948
BTC-0.67%
ETH-1.26%
$DOGE It has suffered a cumulative drawdown of 31.10% over the past month, with daily highs continuing to move lower and the bearish trend still intact.

I’m keeping a close eye on that long lower wick at 0.05077—there was buying support at the time, but the rebound that followed was weak, suggesting limited bullish confidence. The current price is around 0.05418.
In a weak market, what gets tested is patience, not judgment. My question is: before a clear higher low forms, would you choose to trust this rebound?
Risk warning: The above is only my personal market observation and does not consti
post-image
DOGE-0.22%
#BTCReboundFaces60KTest
BTC Rebound Faces $60K Test: Can Bitcoin Turn Its Recovery Into a Powerful Comeback?
Bitcoin is entering one of the most important moments of its recent market correction. After experiencing an aggressive sell-off that pushed BTC to its lowest level in more than two years, the world's largest cryptocurrency has started showing signs of recovery. However, the rebound is now facing a critical psychological and technical challenge around the $60,000 level. The big question for investors is whether Bitcoin can establish sustainable support above this level or whether anoth
BTC-0.67%
November 22, 2026 (Sunday) BTC Futures Analysis for Today (based on the current range of approximately $59,000–$60,000)
Key view (bearish, oversold rebound)
BTC has fallen sharply from above $75,000, touching near $55,000 over the past two days before rebounding to around $60,000. The daily structure remains bearish, and the RSI is in oversold territory. A short-term technical rebound is possible, but there is clear resistance above. Sunday liquidity is low, so the main strategy is to short rebounds, with buying support pullbacks as a secondary option; keep positions light.
Today's Strategy
1.
post-image
BTC-0.65%
My avatar was originally supposed to cosplay as Qingyun-ge.
post-image
The Crypto Market Is Catching Its Breath — Is This the Start of a Recovery?

After seven difficult weeks of selling pressure, Bitcoin has finally delivered a meaningful rebound. The long lower wick on its daily candle suggests buyers are defending the lower price region.

However, I wouldn't rush to call this a confirmed bull market. The next phase could involve sideways movement, volatility, and another test of important support zones.

My focus is on buying strategically rather than chasing the rebound. Spot accumulation should be gradual, while leveraged positions need strict risk managemen
post-image
BTC-0.67%
ETH-1.26%
SOL-0.77%
BNB-0.76%
  • 3
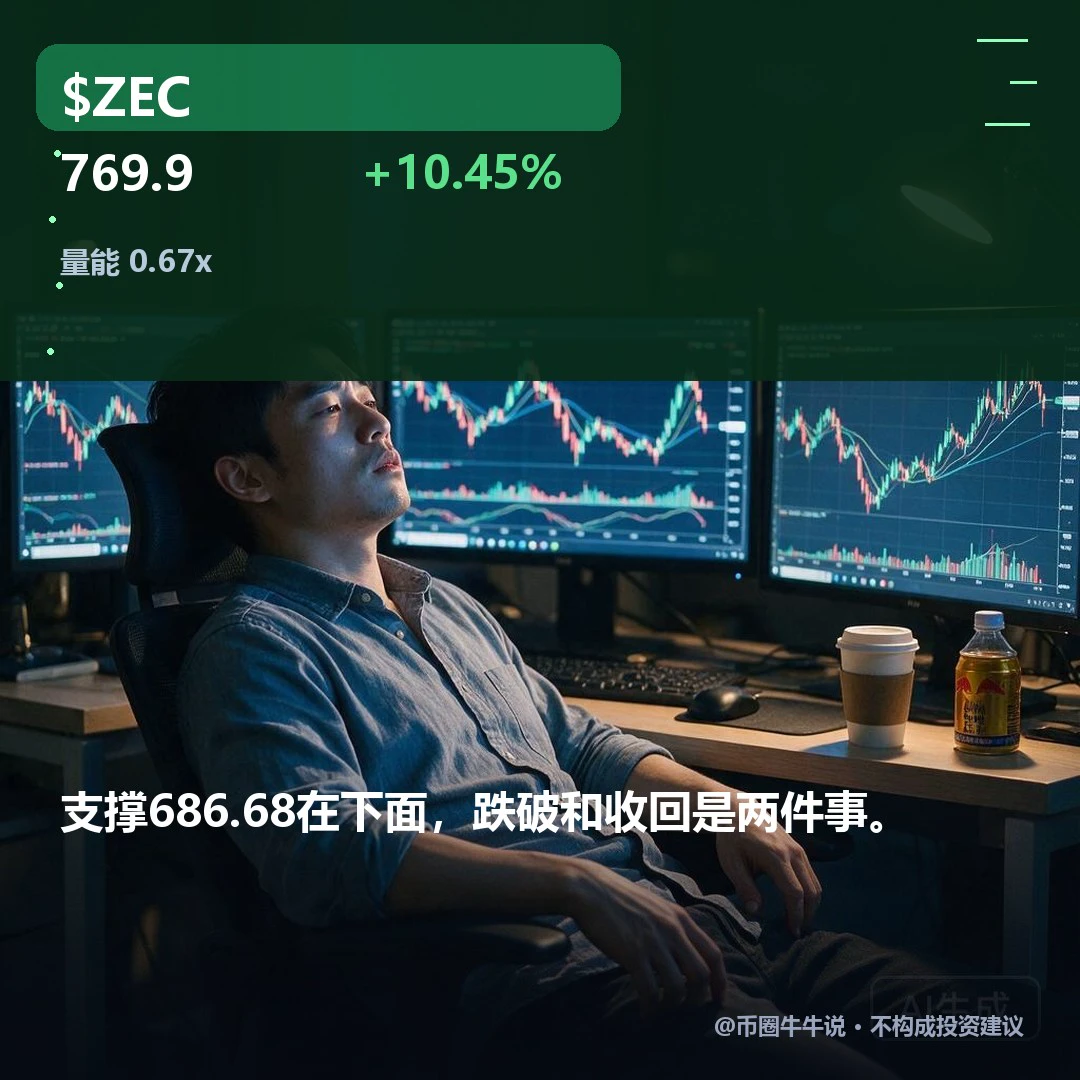
$ZEC rose 10.45% over the past 24 hours, but both the 1-hour and 4-hour timeframes show weakness. The 1-hour RSI has fallen to 23.56, entering oversold territory, but the price failed to break above the 1-hour resistance at 807.95. The 4-hour RSI is 31.01, also showing weakness. Despite the rebound, the price has failed to sustain its upward momentum, and there is a risk of further declines after the bounce.
Don't chase shorts. The current price is 769.9, with a stop-loss at 686.68; if it breaks below that level, I'll admit defeat. Buying demand has emerged on the rebound, but until the struc
post-image
ZEC+1.16%
Bitcoin/Ethereum: The shorts on rallies and additional shorts that have been repeatedly flagged since last night still had room to fall, as noted again this morning. They have now reached lows of around 58,700 and 1,647, respectively, with decent overall moves. In fact, the longs entered after yesterday morning's pullback to 55,600 and 1,545 also saw a significant rally. The subsequent short entries were not ideal, but still offered decent room. #BTC反弹后再争6万美元关口
BTC-0.65%
ETH-1.23%
  • 4
#BTCReboundFaces60KTest

Bitcoin rebounded very nicely and almost over $5k back but After that it falled below $59k again, it has to break Bearish trend ..
post-image
BTC-0.67%
Load More

Join 40 M users in our growing community

⚡️ Join 40 M users in the crypto craze discussion

💬 Engage with your favorite top creators

👍 See what interests you

Trending Topics

BTCReboundFaces60KTest

2.1M Views30.1K Discussing

BTC rebounded from around $55,300 on November 21, briefly reclaiming $60,000 before pulling back to around $59,300. The $60K level is back in focus as traders assess whether the recovery can last. Is this rebound a sign of stabilization or a short-lived recovery? Would reclaiming and holding $60K be enough, or do you need confirmation from trading volume and fund flows?

PCEAndGDPDataNextWeek

257.9K Views2.6K Discussing

GateDirectIPOPhase3ANTAllocates92100Shares

814.6K Views5K Discussing

View More