Share your thoughts
placeholder
Article
I hear pushing the boundaries has now
become a legitimate profession?
Every industry has traces of boundary-pushing
No boundary-pushing, no money
So what are those who can't do it supposed to do? 🤣
Just arrived. No video today; the content isn't much different from Saturday's video. Things will be back to normal tomorrow.
Most traders are about to get blindsided by a hidden move in $SAMSUNG /USDT.

$SAMSUNG /USDT - SHORT

Trade Plan:
Entry: 199.90 – 200.38
SL: 202.45
TP1: 198.41
TP2: 197.25
TP3: 195.52

Why this setup?
Why now? The daily chart is range-bound, which usually traps directional traders, yet the 1h ATR of 0.961712 shows a volatility spike that is cracking the range open. The 15m RSI at 50.55 confirms the market is not overbought or oversold, leaving room for a decisive push. The 1h price of 200.14 sits at the entry zone of 199.90 to 200.38, which is the exact level where short sellers should init
SAMSUNG+0.83%
Everyone is missing the quiet setup forming inside SYMBOL right now.

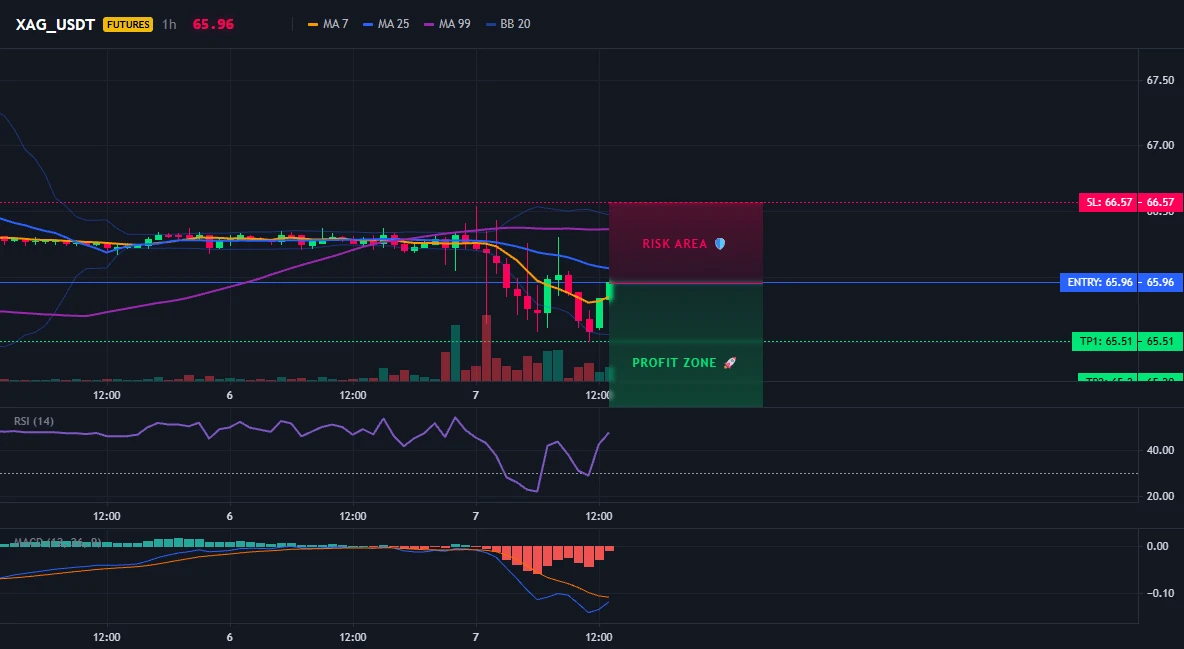
$XAG /USDT - SHORT

Trade Plan:
Entry: 65.90 – 66.02
SL: 66.57
TP1: 65.51
TP2: 65.20
TP3: 64.75

Why this setup?
Why now? The 1h price sits at 65.96, which is the exact entry_ref and the center of the entry zone between 65.90 and 66.02. The 15m RSI at 56.14 shows neither overbought nor oversold, meaning the move can lean either way before a decisive break. The 1h ATR of 0.252199 tells us the average hourly swing size, so any impulse beyond that is genuinely out of the ordinary. The daily trend is range, which favors fades
post-image
XAG-0.51%
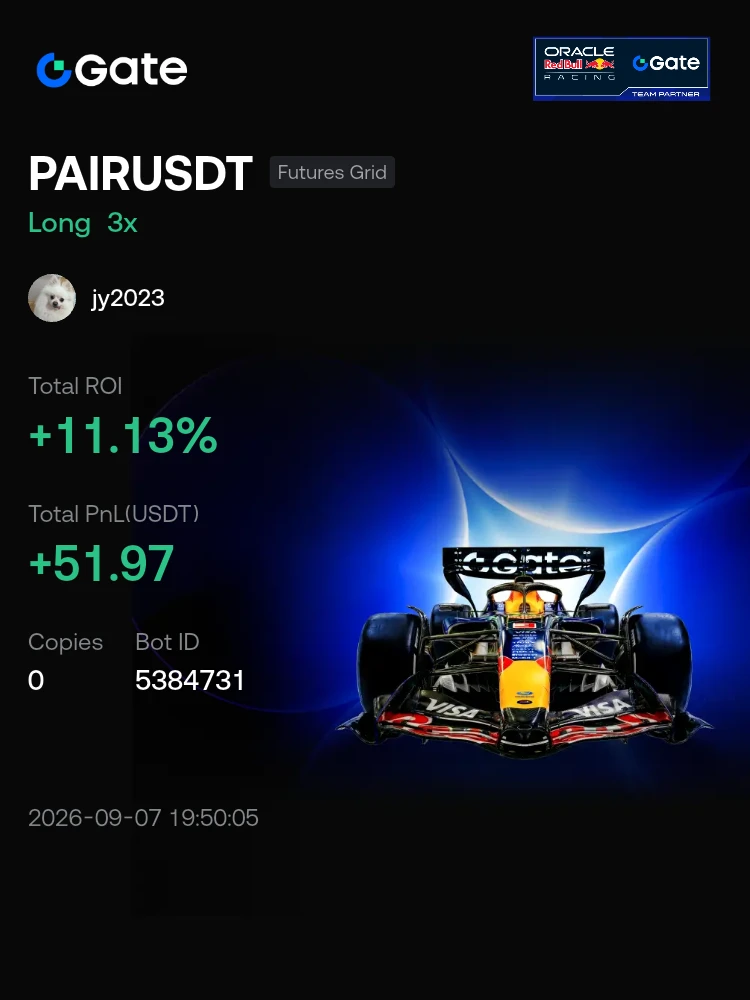
Come on. A V2 app doesn't mean a V2 token. #Bots I'm trading PAIRUSDT with the Futures Grid bot on Gate. Join me!
post-image
BOT+1.34%
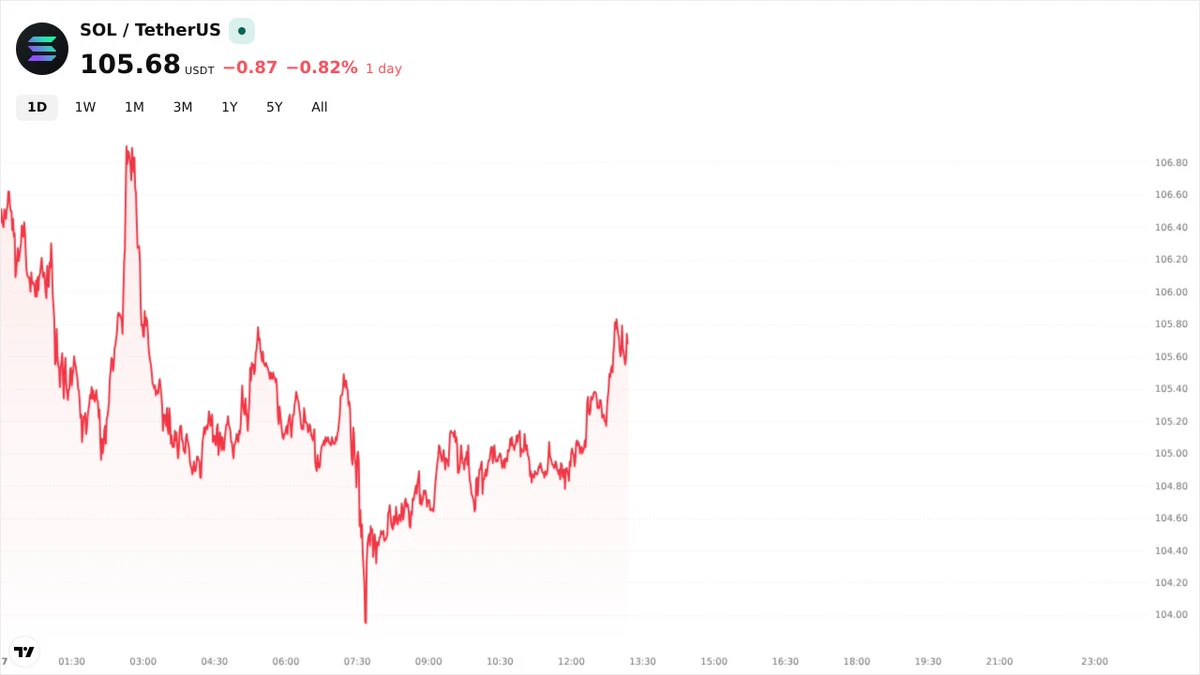
Quietly: SOL's September is up just 2.5%, the worst September performance in 5 years.
post-image
SOL-0.49%
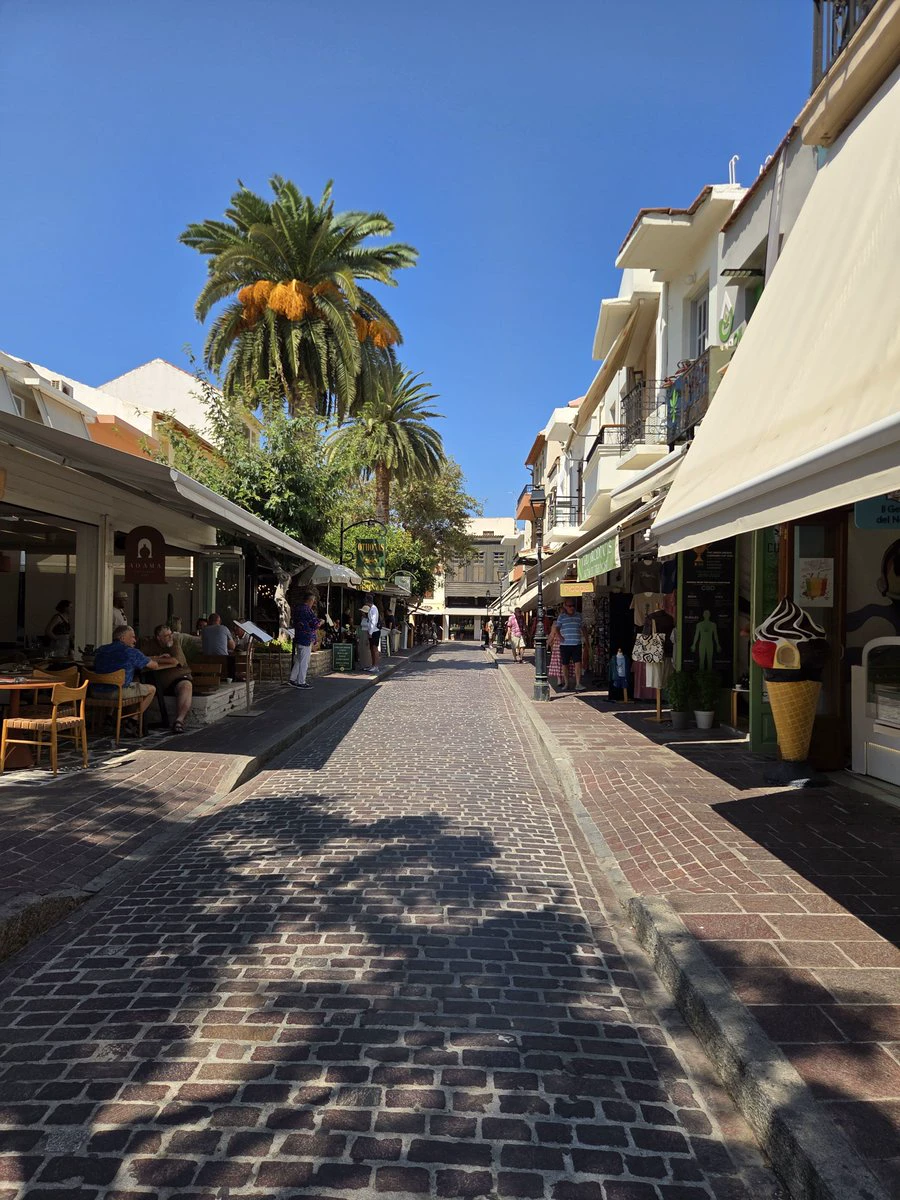
Crete is beautiful 🇬🇷☀️
post-image
BTC, Gold, and Crude Oil Analysis
live-cover
LIVE2,484
I didn’t do anything—just went to the bathroom, and when I came back, the candlestick chart had already done the work for me. This market is practically better at catching the rhythm than I am. 🔥

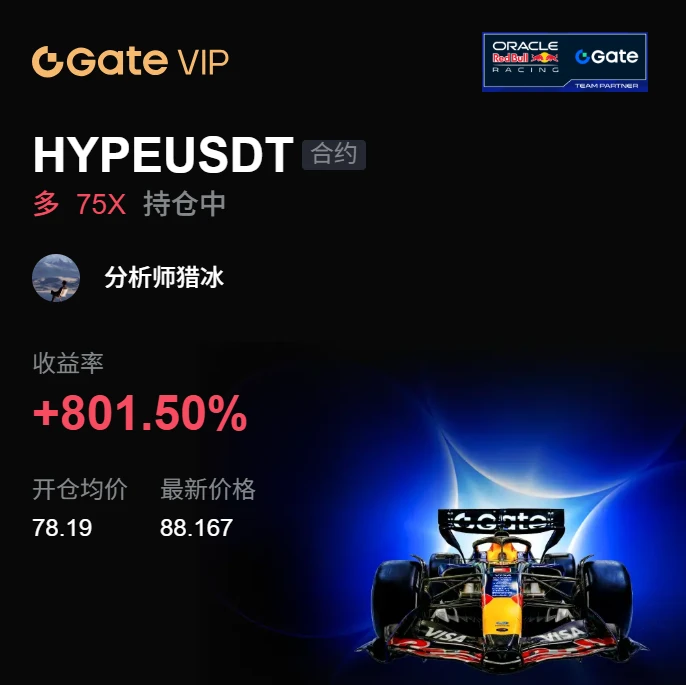
While the market was bottoming intraday, I watched $HYPE oscillate around 78.190, but buyers stepped in every time it dipped, with buying pressure quietly strengthening. Bottoming without breaking down—that’s a signal that it’s building strength. I didn’t hesitate either, decisively followed with a long position, and continued watching the market without making unnecessary moves.

I had planned t
post-image
HYPE-1.08%
ADA+2.33%
ETH+0.60%
Why is everyone suddenly quiet on WLD just before a possible move?

$WLD /USDT - SHORT

Trade Plan:
Entry: 0.4435 – 0.4487
SL: 0.4713
TP1: 0.4272
TP2: 0.4146
TP3: 0.3957

Why this setup?
Why now? The 1h price is holding at 0.4461 inside a tight range, and the 15m RSI is sitting at 50.46, which means neither buyers nor sellers are in control yet. The 1h ATR is only 0.010495, so volatility is compressed and a breakout is overdue. For a SHORT, the entry zone between 0.4435 and 0.4487 offers a precise setup with TP1 at 0.4272 and TP2 at 0.4146 as realistic targets. The invalidation level at 0.4
WLD+10.21%
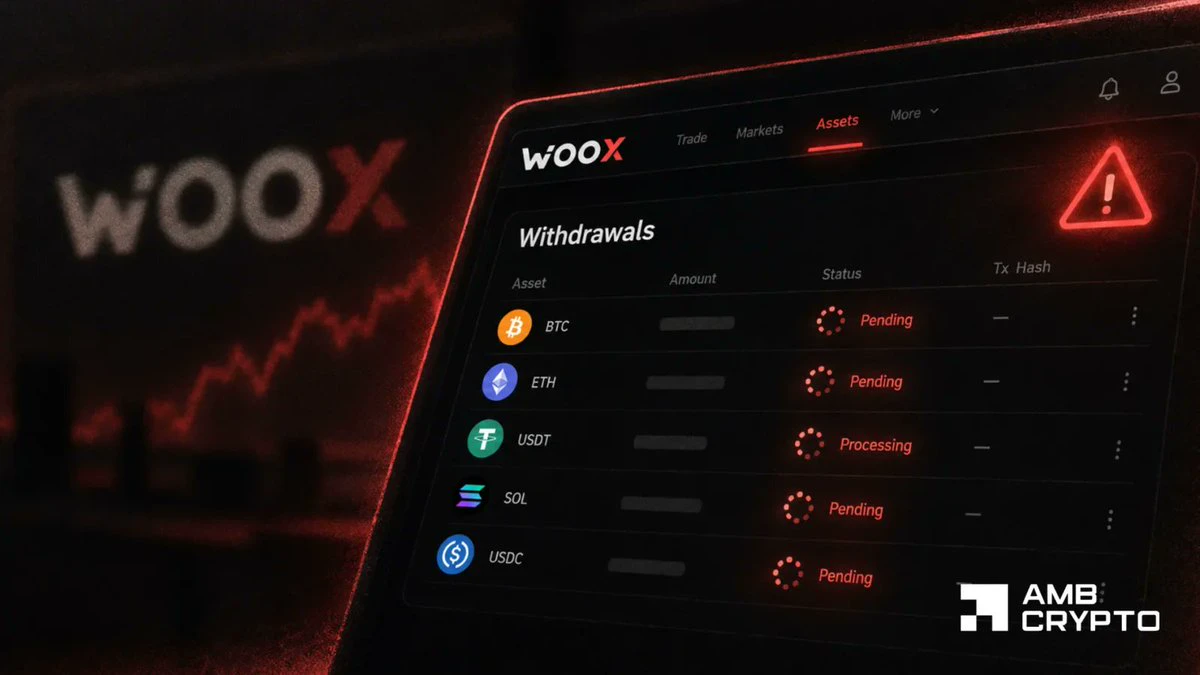
JUST IN: 🚨 WOO X hit a 3-day withdrawal crisis, sparking community fears of a rug pull.
Users can't access funds.
No official statement on cause or timeline.
If unresolved soon, this becomes an exchange solvency question, not just operational hiccup.
post-image
WOO-1.88%
Insiders are quietly stacking shorts on $HOME /USDT right now.

$HOME /USDT - SHORT

Trade Plan:
Entry: 0.00600 – 0.00602
SL: 0.00612
TP1: 0.00593
TP2: 0.00587
TP3: 0.00578

Why this setup?
Why now? The 1h price sits at 0.00601 inside the entry zone, the 15m RSI reads 56.29 showing room to fall, the 1h ATR of 0.000047 confirms the market is active enough for a clean move, and the daily trend remains bearish. The 1h price is pinned at the entry_ref level of 0.00601, giving a precise trigger for the short. A break below the entry_low of 0.00600 opens the first target at 0.00593, while a deepe
HOME-2.43%
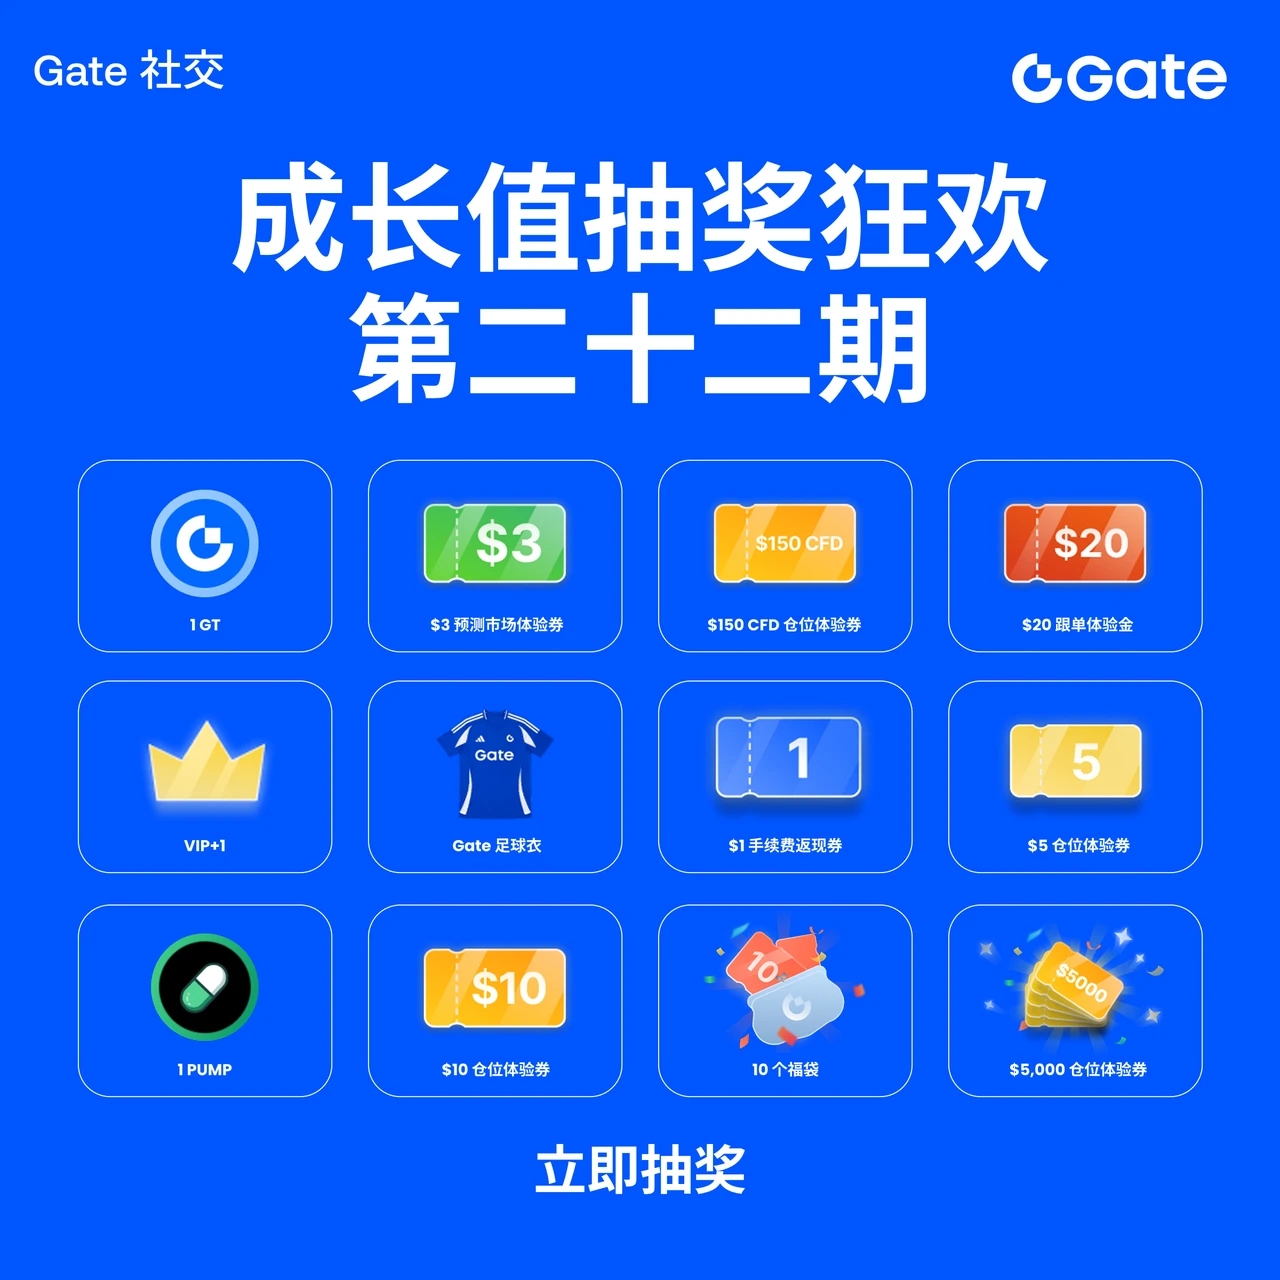
🎁 Win a share of 5,000 USDT in rewards—the 2️⃣ 2️⃣nd growth-point lottery is underway!
Spend 300 growth points per draw, up to 10 draws daily, with a 100% chance of winning! 🤩
💫 Interact daily and earn growth points with ease
🔹 Explore the Square: post, like, comment, and share, for up to +600 daily
🔹 Watch livestreams: watch, reserve, like, comment, and share, for up to +300 daily
🔹 Join Hot Chat: participate in discussions and share trading cards, for up to +90 daily
🔹 Creator bonus: publish content featuring designated tokens/trading cards, up to +300 per task
Gate VIP soccer jerseys
post-image
GateSquare
🎁 Win a share of 5,000 USDT in rewards—the 2️⃣ 2️⃣nd growth-point lottery is underway!
Spend 300 growth points per draw, up to 10 draws daily, with a 100% chance of winning! 🤩
💫 Interact daily and earn growth points with ease
🔹 Explore the Square: post, like, comment, and share, for up to +600 daily
🔹 Watch livestreams: watch, reserve, like, comment, and share, for up to +300 daily
🔹 Join Hot Chat: participate in discussions and share trading cards, for up to +90 daily
🔹 Creator bonus: publish content featuring designated tokens/trading cards, up to +300 per task
Gate VIP soccer jerseys, prediction market experience vouchers, fee cashback vouchers, and more await your unlock!
Draw now 👉️ https://www.gate.com/activities/pointprize?now_period=22
#BTC #ETH #HYPE
repost-content-media
BTC-0.25%
ETH+0.59%
HYPE-0.90%
With this price action, I don't even need to think—the account is dancing on its own.
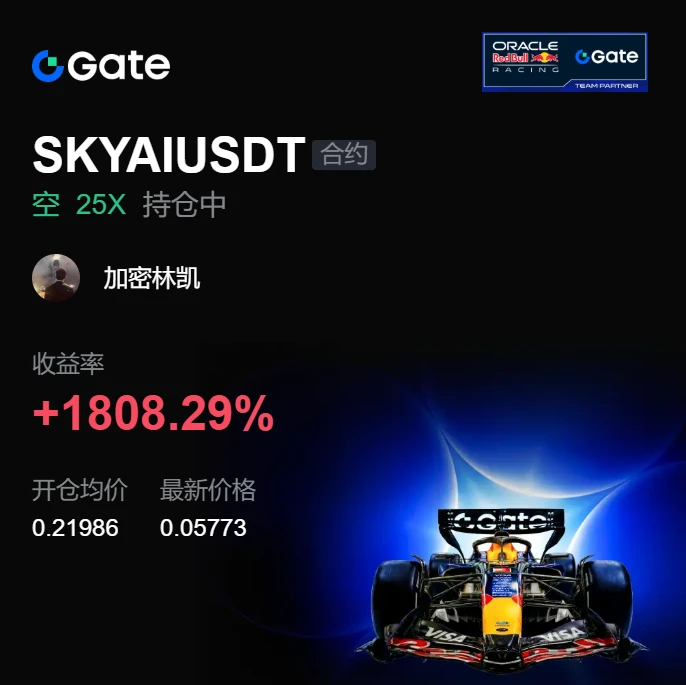
During the repeated intraday swings, the rebound looked lively, but volume failed to follow. I kept my eye on the key level above $SKYAI ; it tried to break through several times but fell just short, which was a classic bull-trap signal. Without hesitation, I placed a short order and waited for the pullback.
When I checked the chart again after lunch, the price had already slid to 0.0577. With an entry cost of 0.21986, the +1808.29% gave me the answer directly. This profit feels great; those who were already o
post-image
SKYAI-1.83%
XRP-0.19%
DOGE+2.48%
$BTC August results are out: leading followers to profits and withdrawals—Wei Ge has the rhythm on point this time
Throughout August, the market swung wildly. Some were liquidated and left, while others kept losing more. But followers who followed Wei Ge did not miss a single bite of the profits they were supposed to take, and did not hesitate for a second when it was time to exit
From accurately bottom-fishing ETH near 1900 at the start of the month, to profiting from both long and short positions on Shandi and repeatedly taking profits mid-month, then riding ZEC from its launch at 700 all th
BTC-0.25%
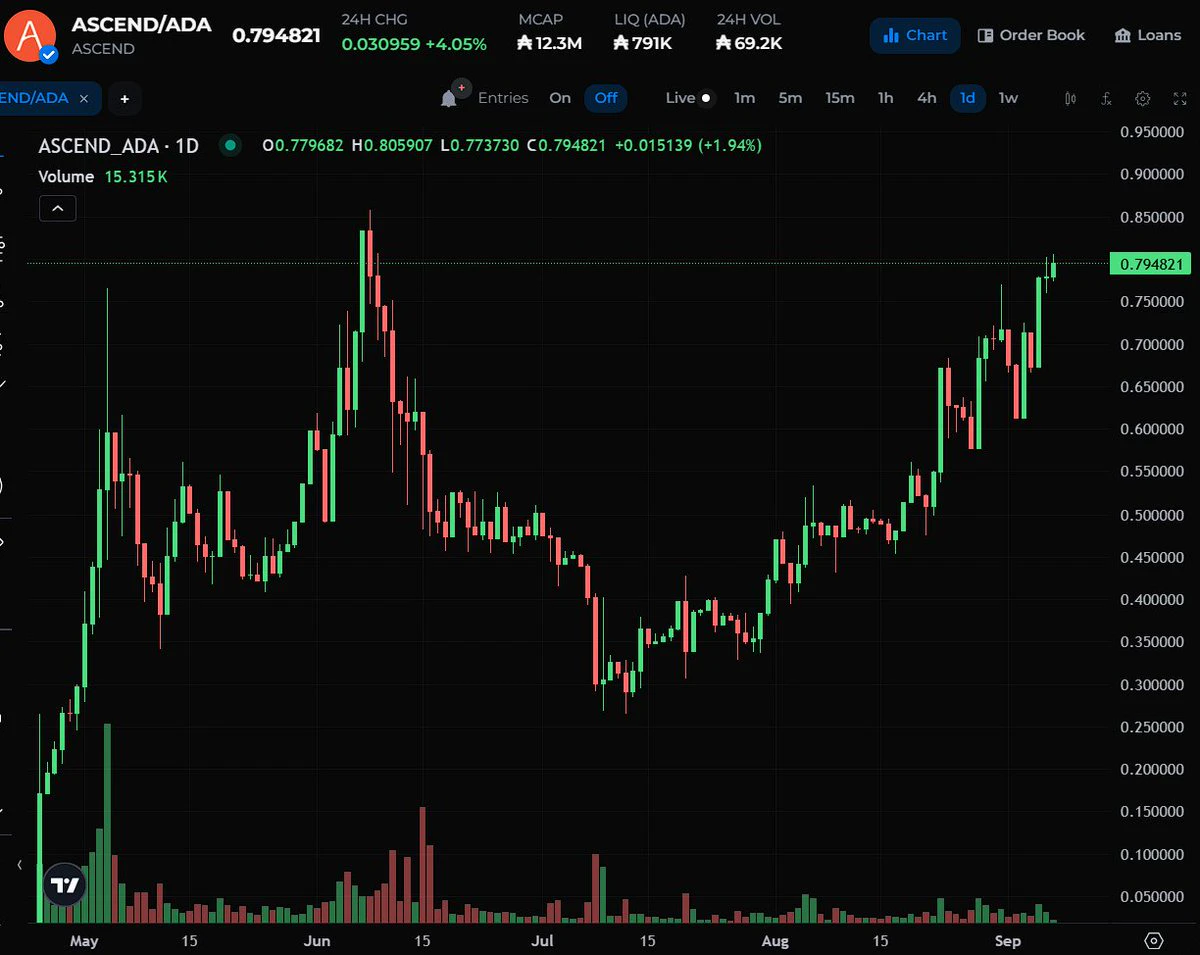
$ASCEND is the definition of ascending.
New ATH very soon🚀
post-image
#AltcoinOISurpassesBitcoinforFirstTimeinOveraYear
ALTCOIN OI SURPASSES BITCOIN A MAJOR DERIVATIVES MARKET SHIFT
The crypto derivatives market has just delivered one of the strongest signals of changing trader positioning in more than a year: total altcoin perpetual-futures open interest has moved above Bitcoin’s for the first time since December 2024. The crossover is based on Coinalyze data and shows that a larger share of outstanding leveraged positions is now concentrated across altcoins rather than BTC.
WHY THIS UPDATE MATTERS
Open interest represents the total value of derivative contra
post-image
Jiaa_Insights
#AltcoinOISurpassesBitcoinforFirstTimeinOveraYear ALTCOIN OI SURPASSES BITCOIN A MAJOR DERIVATIVES MARKET SHIFT
The crypto derivatives market has just delivered one of the strongest signals of changing trader positioning in more than a year: total altcoin perpetual-futures open interest has moved above Bitcoin’s for the first time since December 2024. The crossover is based on Coinalyze data and shows that a larger share of outstanding leveraged positions is now concentrated across altcoins rather than BTC.
WHY THIS UPDATE MATTERS
Open interest represents the total value of derivative contracts that remain open and unsettled. When altcoin OI moves above Bitcoin OI, it does not automatically mean that every altcoin is bullish. Instead, it tells us that traders are becoming increasingly active and willing to deploy leverage outside Bitcoin.
This is a major change in market structure.
For months, Bitcoin remained the primary center of derivatives positioning. Now traders are rotating more aggressively toward the broader altcoin market, suggesting that risk appetite is expanding beyond BTC.
The timing is also important because the combined market capitalization of altcoins outside the top 10 has moved above $200 billion and has risen more than 10% since the beginning of September. That means this rotation is happening alongside an increase in spot-market capitalization rather than being purely a futures phenomenon.
ALTCOIN SEASON OR LEVERAGE TRAP?
This is where I would be careful.
The first interpretation is bullish: capital and trader attention are moving deeper into the altcoin market, creating the conditions for stronger relative performance across selected altcoins.
But the second interpretation is equally important: higher OI means higher leverage.
If too many traders become positioned in the same direction, even a relatively normal correction can trigger liquidations. Those liquidations can then force additional positions to close, creating a much larger move than the original price change.
So rising altcoin OI is both a bullish participation signal and a volatility warning.
BTC VS ALTCOINS
Bitcoin is still trading around the $80K region, but the derivatives structure is changing underneath the market.
This creates an interesting setup.
If BTC remains stable while altcoin OI continues expanding, traders may continue searching for higher-beta opportunities in Ethereum, Solana, Zcash, DeFi tokens and other large or mid-cap assets.
If BTC breaks higher at the same time, the combination could become even stronger because rising BTC liquidity can create a broader risk-on environment.
However, if BTC suddenly loses major support while altcoin leverage remains elevated, altcoins could experience significantly larger percentage declines than Bitcoin.
That is why the next BTC move is still extremely important for the entire altcoin market.
ZEC IS A PERFECT EXAMPLE
Zcash provides one of the clearest examples of what this rotation can look like.
ZEC open interest reached approximately $2.4 billion, while its price pushed through $1,000 and short liquidations reached roughly $34 million.
This shows both sides of the current market.
When momentum accelerates, high OI can fuel a powerful short squeeze.
But if sentiment suddenly reverses, that same leverage can become fuel for a long-liquidation cascade.
The lesson is simple: high OI can amplify both directions.
WHAT I AM WATCHING NEXT
The most important confirmation now is whether altcoin OI continues rising while spot market capitalization also expands.
If both increase together, the move would suggest genuine market participation rather than leverage alone.
If OI rises rapidly while spot prices and market capitalization stop advancing, the setup becomes much more dangerous because derivatives exposure would be growing faster than underlying demand.
I would therefore monitor three things closely:
1. Altcoin OI
Continued expansion would show that traders are maintaining strong interest in altcoin derivatives.
2. Altcoin spot market capitalization
Continued growth above the $200B area would provide stronger confirmation that the rotation is not purely leverage-driven.
3. BTC stability
Bitcoin holding the $80K region would give altcoins more room to continue outperforming. A sharp BTC breakdown could quickly change the entire risk environment.
BULLISH SCENARIO
If Bitcoin remains stable or moves higher while altcoin market capitalization continues expanding and OI grows in a controlled manner, the current rotation could develop into a much broader altcoin rally.
In that scenario, traders may continue moving down the risk curve:
BTC → ETH → large-cap altcoins → mid-cap altcoins
The strongest projects with improving liquidity, volume and momentum would likely attract the greatest attention.
A sustained decline in Bitcoin dominance would add another confirmation signal for this rotation.
BEARISH SCENARIO
The biggest risk is excessive leverage.
If altcoin OI continues increasing rapidly while prices become overextended, the market could become vulnerable to a sharp liquidation event.
The previous December 2024 episode is worth remembering: the last time altcoin OI exceeded Bitcoin's, several mid-cap altcoins later experienced significant corrections even while Bitcoin remained comparatively stable.
That does not mean the same pattern must repeat now, but it demonstrates why this indicator should not be interpreted as a guaranteed buy signal.
MY MARKET VIEW
For me, this update is bullish for altcoin participation but cautious for leverage risk.
The fact that altcoin OI has overtaken Bitcoin after more than a year is a major structural development. It suggests traders are becoming increasingly interested in opportunities beyond BTC.
The additional confirmation is that altcoin market capitalization outside the top 10 has already moved above $200 billion and gained more than 10% since the start of September.
That makes the current environment much more interesting than a simple derivatives-driven pump.
But I would not call it a guaranteed altseason yet.
For me, the confirmation will come when:
Altcoin OI ↑
Spot market cap ↑
Trading volume ↑
BTC remains stable or bullish
BTC dominance continues weakening
If those conditions remain aligned, the probability of sustained altcoin outperformance increases.
FINAL TAKE
The most important message from today's data is not simply that altcoins have more open interest than Bitcoin.
The bigger message is that risk appetite is moving deeper into the crypto market.
Traders are no longer concentrating their derivatives exposure primarily around Bitcoin. They are increasingly willing to take leveraged positions across altcoins.
That can become the foundation for a powerful altcoin expansion.
But it can also create a much more fragile market.
More OI = more opportunity.
More OI = more leverage.
More leverage = bigger moves in both directions.
So my strategy would be to watch OI + volume + spot market capitalization + BTC structure together, rather than treating the OI crossover alone as a buy signal.
The next few sessions could reveal whether this is the beginning of a sustained altcoin rotation or simply a leverage-driven expansion that eventually produces a sharp correction.
ALTCOIN OI > BITCOIN OI
ALTCOIN MARKET CAP: ABOVE $200B
SEPTEMBER ALTCOIN MARKET CAP GROWTH: 10%+
KEY SIGNAL: CAPITAL AND LEVERAGE ARE ROTATING TOWARD ALTCOINS
KEY RISK: LIQUIDATION CASCADES
The market is clearly changing. Now the question is whether altcoins can turn this derivatives dominance into sustained spot-market strength.
BTC-0.28%
ETH+0.60%
SOL-0.52%
ZEC+0.58%
  • 2
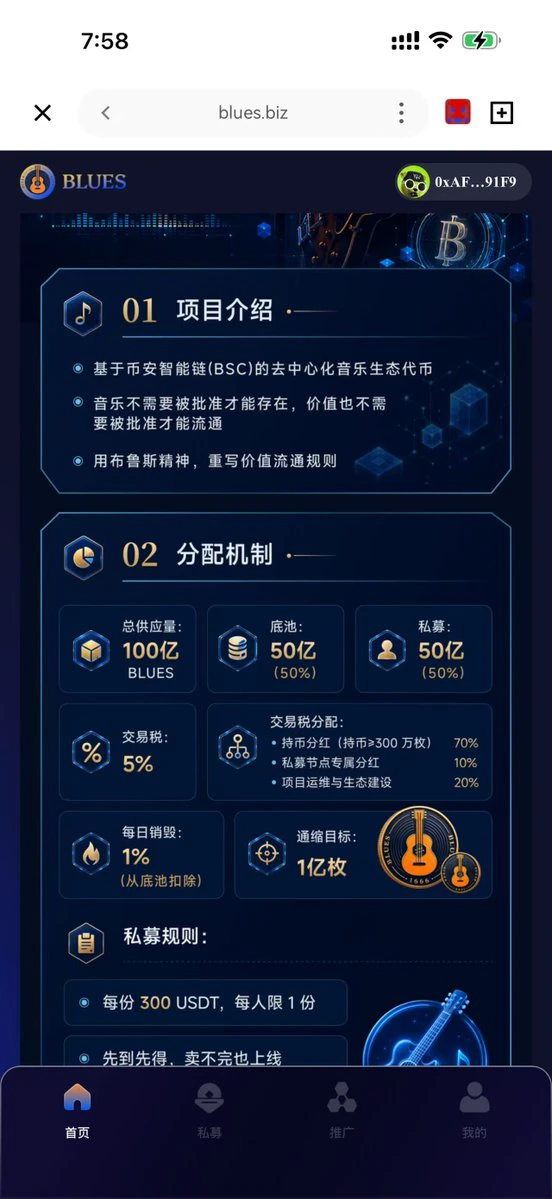
A few days ago, a friend privately invested in some $blues
, saying it would be listed on the 9th. I haven’t participated in a private sale for a long time.
Let’s see what multiple the ground marketing team can drive it to by then.
post-image
Load More

Join 40 M users in our growing community

⚡️ Join 40 M users in the crypto craze discussion

💬 Engage with your favorite top creators

👍 See what interests you

View More